. 2018 Oct 11;13(10):e0202460.
doi: 10.1371/journal.pone.0202460. eCollection 2018.

Oral iron exacerbates colitis and influences the intestinal microbiome

Affiliations

Oral iron exacerbates colitis and influences the intestinal microbiome

Awad Mahalhal et al. PLoS One. .

Abstract

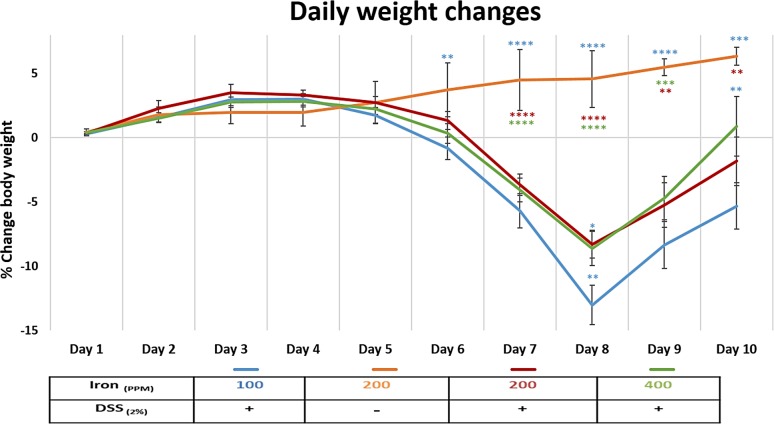
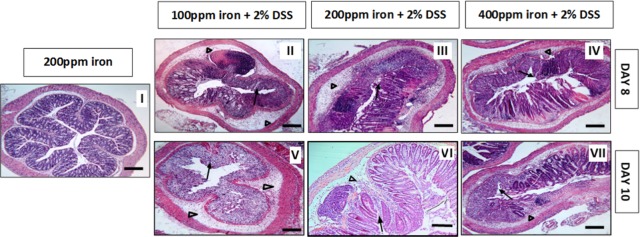
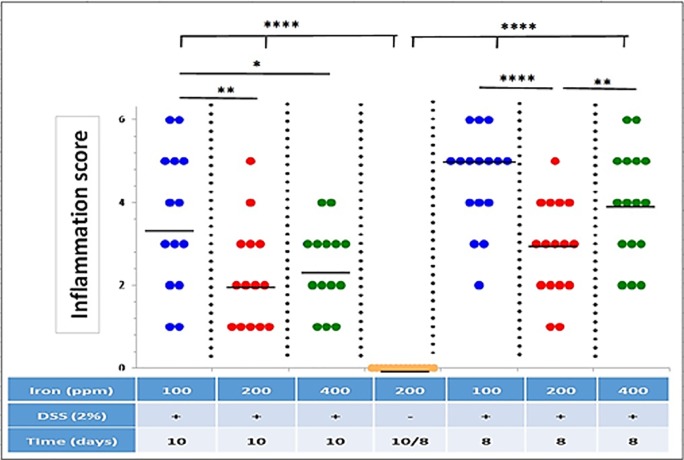
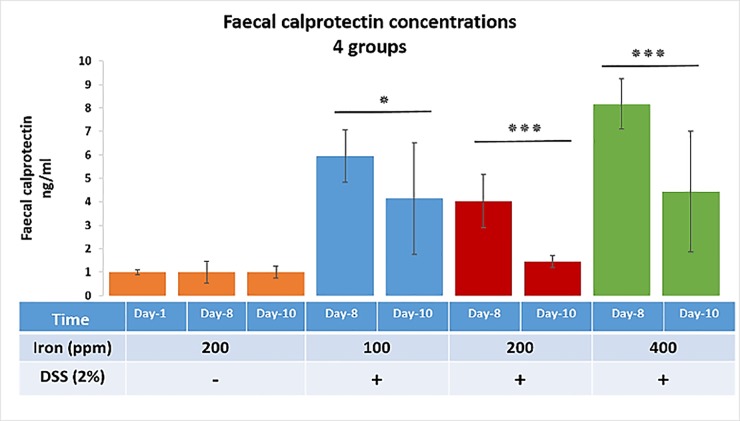
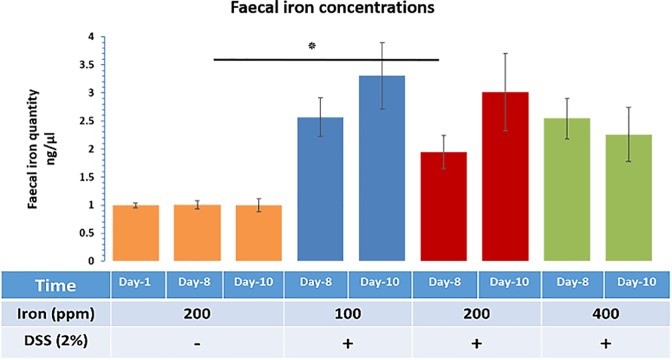
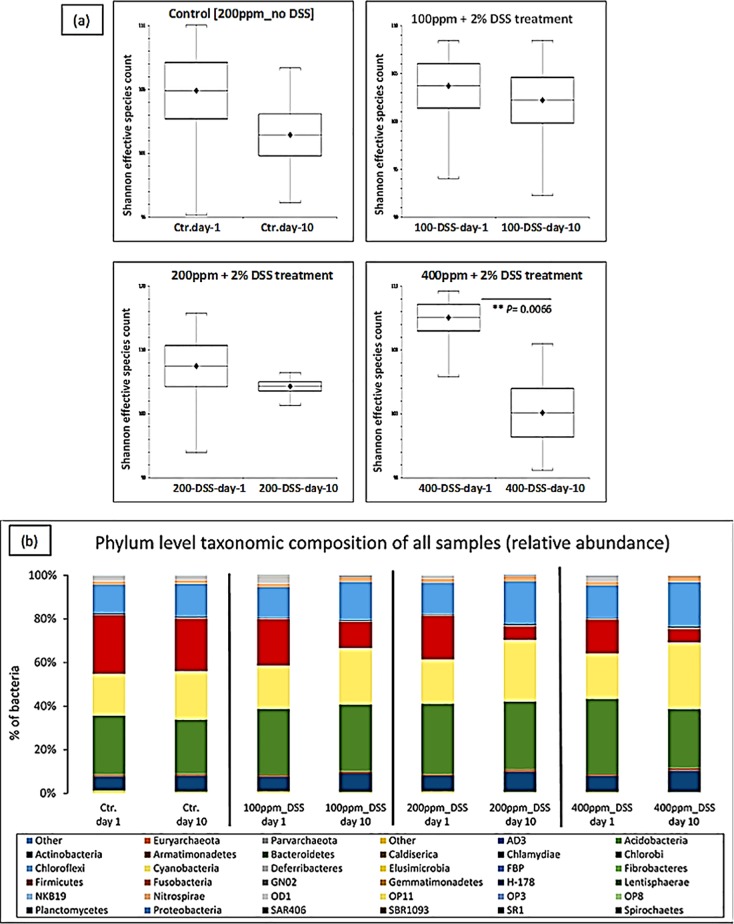
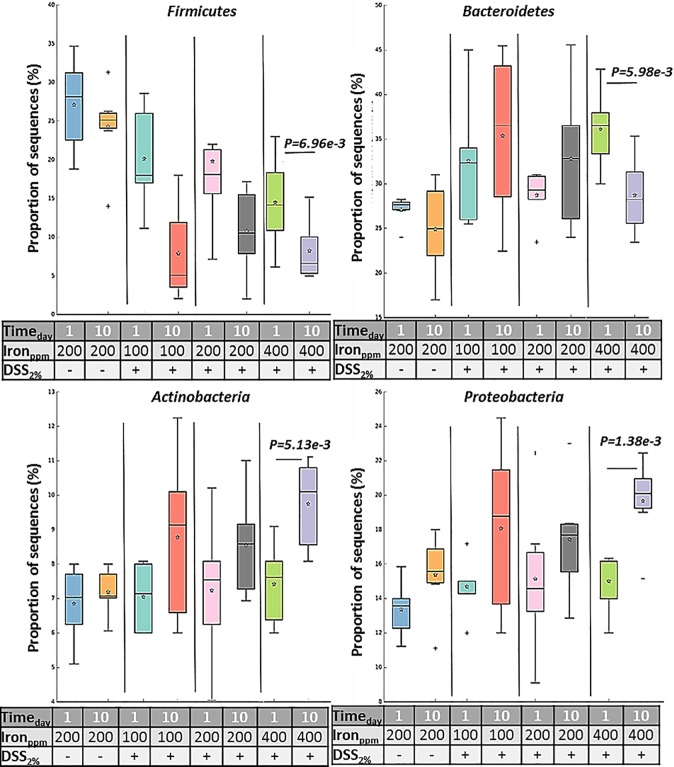
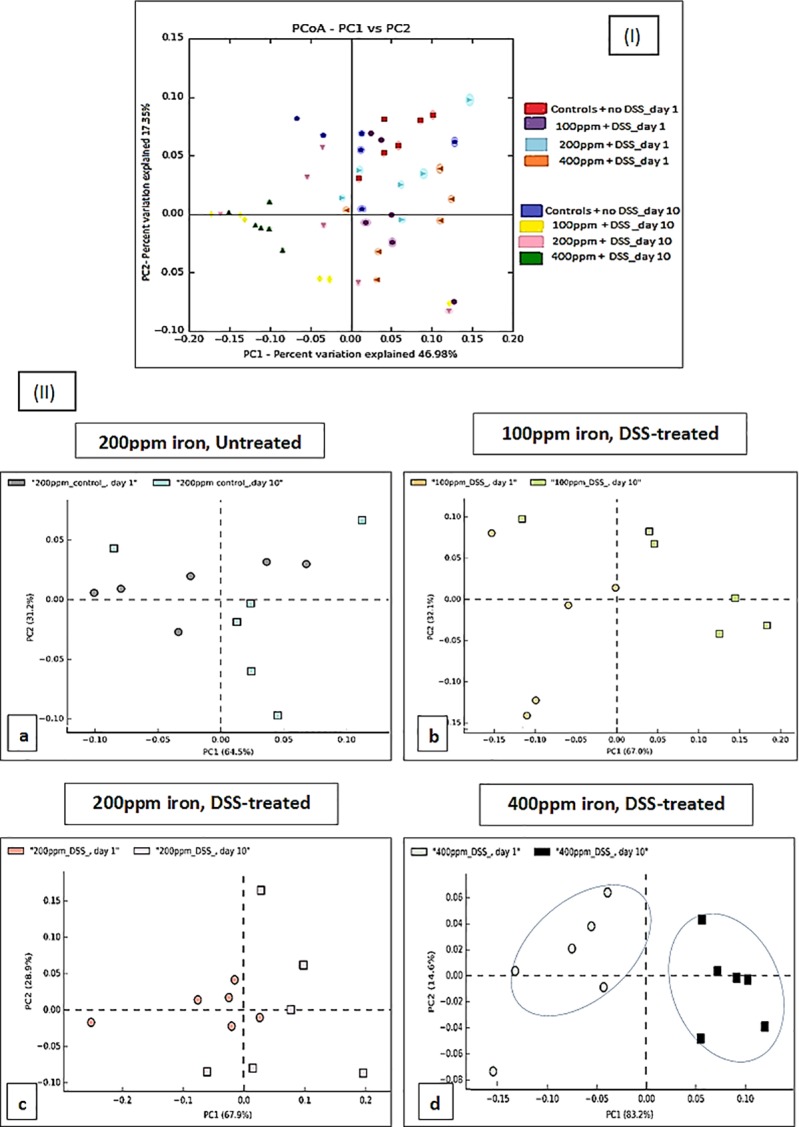
Inflammatory bowel disease (IBD) is associated with anaemia and oral iron replacement to correct this can be problematic, intensifying inflammation and tissue damage. The intestinal microbiota also plays a key role in the pathogenesis of IBD, and iron supplementation likely influences gut bacterial diversity in patients with IBD. Here, we assessed the impact of dietary iron, using chow diets containing either 100, 200 or 400 ppm, fed ad libitum to adult female C57BL/6 mice in the presence or absence of colitis induced using dextran sulfate sodium (DSS), on (i) clinical and histological severity of acute DSS-induced colitis, and (ii) faecal microbial diversity, as assessed by sequencing the V4 region of 16S rRNA. Increasing or decreasing dietary iron concentration from the standard 200 ppm exacerbated both clinical and histological severity of DSS-induced colitis. DSS-treated mice provided only half the standard levels of iron ad libitum (i.e. chow containing 100 ppm iron) lost more body weight than those receiving double the amount of standard iron (i.e. 400 ppm); p<0.01. Faecal calprotectin levels were significantly increased in the presence of colitis in those consuming 100 ppm iron at day 8 (5.94-fold) versus day-10 group (4.14-fold) (p<0.05), and for the 400 ppm day-8 group (8.17-fold) versus day-10 group (4.44-fold) (p<0.001). In the presence of colitis, dietary iron at 400 ppm resulted in a significant reduction in faecal abundance of Firmicutes and Bacteroidetes, and increase of Proteobacteria, changes which were not observed with lower dietary intake of iron at 100 ppm. Overall, altering dietary iron intake exacerbated DSS-induced colitis; increasing the iron content of the diet also led to changes in intestinal bacteria diversity and composition after colitis was induced with DSS.


Conflict of interest statement

The authors have declared that no competing interests exist.

Figures

Fig 1
Fig 1. Daily weight changes.
Percentage weight change in mice consuming diets containing iron [100 ppm (blue), 200 ppm (red) and 400 ppm (green)] during dextran sulfate sodium (DSS)-induced colitis, and mice consuming a diet containing 200 ppm iron without DSS treatment (orange) during the 10-day study period. Data are presented as a mean ± standard error of the mean (SEM). Statistical differences were assessed by Kruskal–Wallis test followed by multiple comparisons (Conover-Inman) tests (* p<0.05, ** p<0.01, *** p<0.001, **** p<0.0001). (n = 30 female mice per DSS-treated; n = 22 mice per untreated group).
Fig 2
Fig 2. H & E histology.
Representative Haematoxylin- and eosin-stained sections of the distal colon from untreated and 2% w/v DSS-treated mice. Mice received either water (control, I) or 2% w/v DSS for 5 days followed by another 3 days on plain drinking water (II, III and IV) or 5 days on plain drinking water (V, VI, and VII). Arrowheads highlight submucosal oedema; arrows highlight almost complete loss of colonic epithelium.
Fig 3
Fig 3. Inflammation score.
Inflammation (colitis) scores for all groups of DSS-treated mice (n = 16 [8-days] and n = 14 [10-days] mice per group) and untreated control mice (n = 24) on diets containing different levels of iron (100, 200 and 400 ppm). Horizontal lines represent medians. Significant differences were assessed using one-way ANOVA followed by multiple comparisons against untreated control by Dunnett’s test; * p<0.05, ** p<0.01, **** p<0.0001.
Fig 4
Fig 4. Faecal calprotectin concentrations.
Faecal calprotectin concentrations at three different time points (day-1, 8 and 10) for four groups, three DSS-treated groups (consuming diets containing 100, 200 and 400 ppm iron) and one untreated control group (consuming a standard 200-ppm iron containing chow diet). Data are presented as a mean ± SEM. Significant differences were identified using the Kruskal–Wallis test followed by multiple comparisons (Conover-Inman) test; * p<0.05, *** p<0.001. (30 samples for all DSS-treated groups and 22 samples for untreated mice at each time point).
Fig 5
Fig 5. Faecal iron concentrations.
Faecal iron concentration at three different time points (day-1, 8 and 10) for four groups, three DSS-treated groups (consuming diets containing 100, 200 and 400 ppm iron) and one untreated control group (consuming a standard 200-ppm iron containing chow diet). Data are presented as a mean ± SEM. Significant differences were identified using the Kruskal–Wallis test followed by multiple comparisons (Conover-Inman) test; * p<0.05.
Fig 6
Fig 6. Relative abundance of bacteria.
Effect of iron on the microbiota composition in the colon after DSS-induced colitis. (a) Shannon effective diversity boxplots display decreased numbers of dominant molecular species in all groups, day-1 versus day-10 of the study. (b) The Phylum-level taxonomic composition of all samples (average relative abundance). Ctr. = untreated controls on a standard chow diet containing 200 ppm iron; DSS = 2% w/v dextran sulfate sodium (DSS) treated mice on diets containing low iron (100 ppm), standard iron (200 ppm) and high iron (400 ppm) levels.
Fig 7
Fig 7. Proportions of sequences.
Box plot is showing the distribution in the proportion of four key phyla (Firmicutes, Bacteroidetes, Actinobacteria and Proteobacteria) assigned to samples from all groups at day-1 and day-10. Boxes indicate the interquartile ranges (75th to 25th IQR) of the data. The median values are shown as lines within the box, and the mean values are indicated by stars. Whiskers extend to the most extreme value within 1.5*IQR. Outliers are shown as crosses. Statistical differences were assessed by Welch’s t-test followed by Storey’s FDR multiple test correction.
Fig 8
Fig 8. Principal Coordinate/Component analysis.
Analysis of faecal microbiota shifts assessed by Principal Coordinate/Component Analysis (PCA-PCoA) plots of the unweighted UniFrac distances of pre-and post-DSS-intervention stool samples (I) PCoA; all groups (II) PCA; DSS-treated mice on diets containing low iron (100 ppm), standard iron (200 ppm) and high iron (400 ppm) (b, c, and d respectively) and untreated control mice on a diet containing standard 200 ppm iron (a) at phylum-level, phylogenetic classification of 16S rRNA gene sequences. Symbols represent data from individual mice, colour-coded by the indicated metadata. Statistical differences were assessed by Welch’s t-test followed by Storey’s FDR multiple test correction.

References

    1. Kulnigg S, Teischinger L, Dejaco C, Waldhor T, Gasche C. Rapid recurrence of IBD-associated anemia and iron deficiency after intravenous iron sucrose and erythropoietin treatment. Am J Gastroenterol. 2009;104(6):1460–7. 10.1038/ajg.2009.114 . - DOI - PubMed
    1. Manfred Wick WP, Paul Lehmann. Clinical Aspects and Laboratory–Iron Metabolism. 6th ed. SpingerWienNewYork: Springer Vienna; 2011.
    1. Stein J, Dignass AU. Management of iron deficiency anemia in inflammatory bowel disease—a practical approach. Ann Gastroenterol. 2013;26(2):104–13. ; PubMed Central PMCID: PMCPMC3959949. - PMC - PubMed
    1. Rizvi S, Schoen RE. Supplementation with oral vs. intravenous iron for anemia with IBD or gastrointestinal bleeding: is oral iron getting a bad rap? Am J Gastroenterol. 2011;106(11):1872–9. 10.1038/ajg.2011.232 . - DOI - PubMed
    1. Lee TW, Kolber MR, Fedorak RN, van Zanten SV. Iron replacement therapy in inflammatory bowel disease patients with iron deficiency anemia: a systematic review and meta-analysis. J Crohns Colitis. 2012;6(3):267–75. 10.1016/j.crohns.2011.09.010 . - DOI - PubMed

Publication types

MeSH terms