. 2018 Oct 10;100(1):120-134.e6.
doi: 10.1016/j.neuron.2018.09.017.

CD47 Protects Synapses from Excess Microglia-Mediated Pruning during Development

Affiliations

CD47 Protects Synapses from Excess Microglia-Mediated Pruning during Development

Emily K Lehrman et al. Neuron. .

Abstract

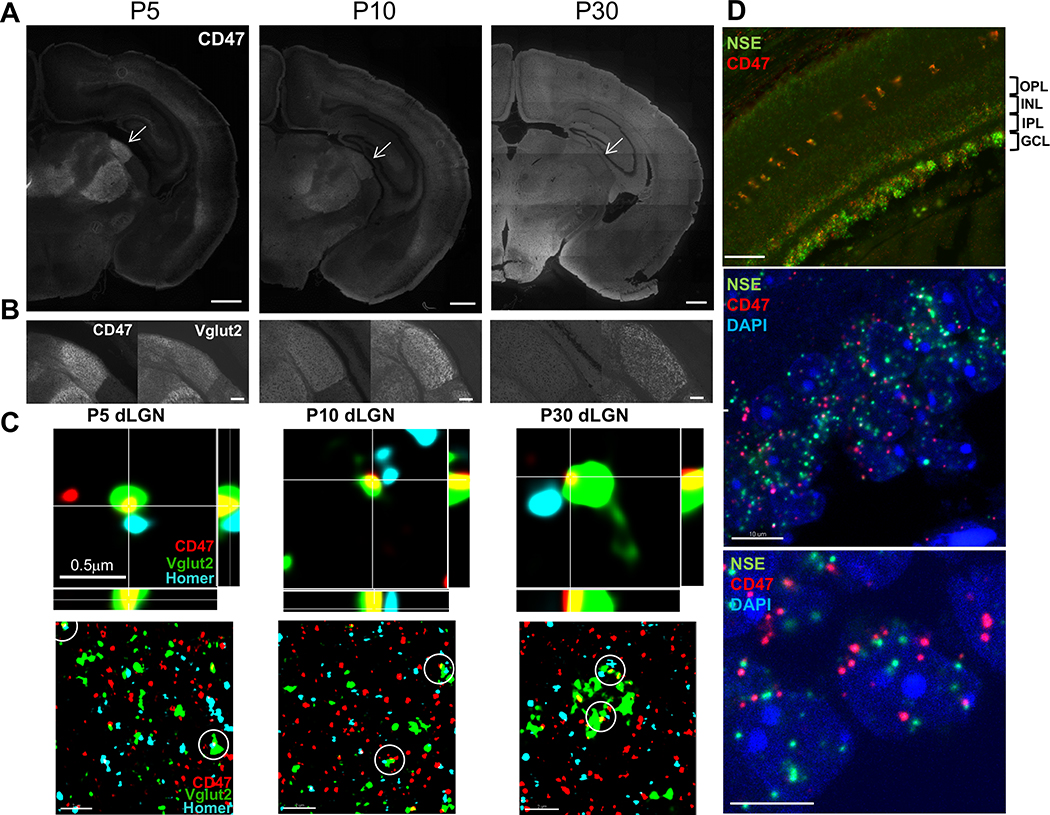
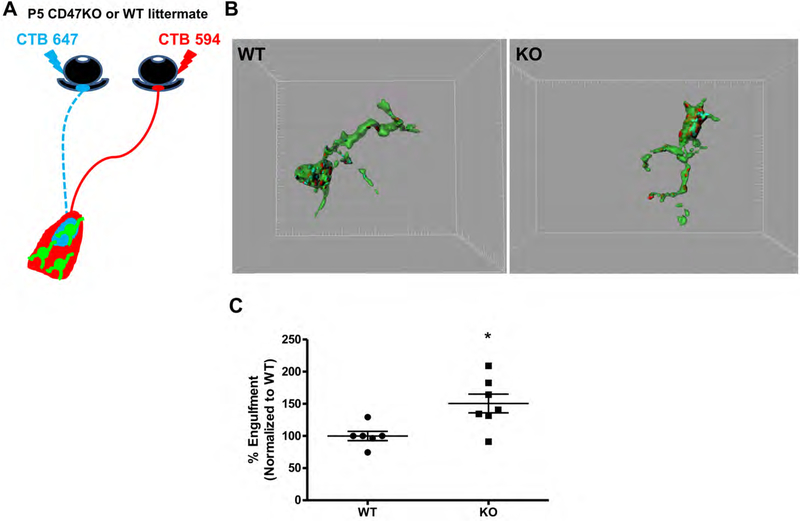
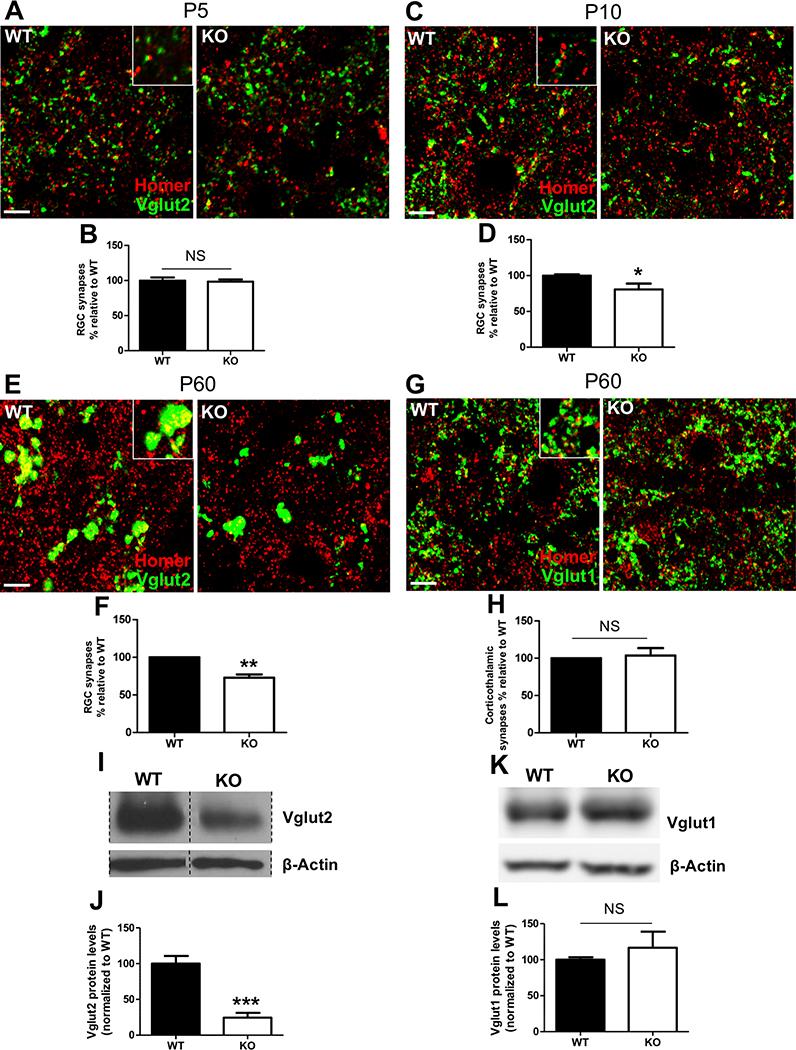
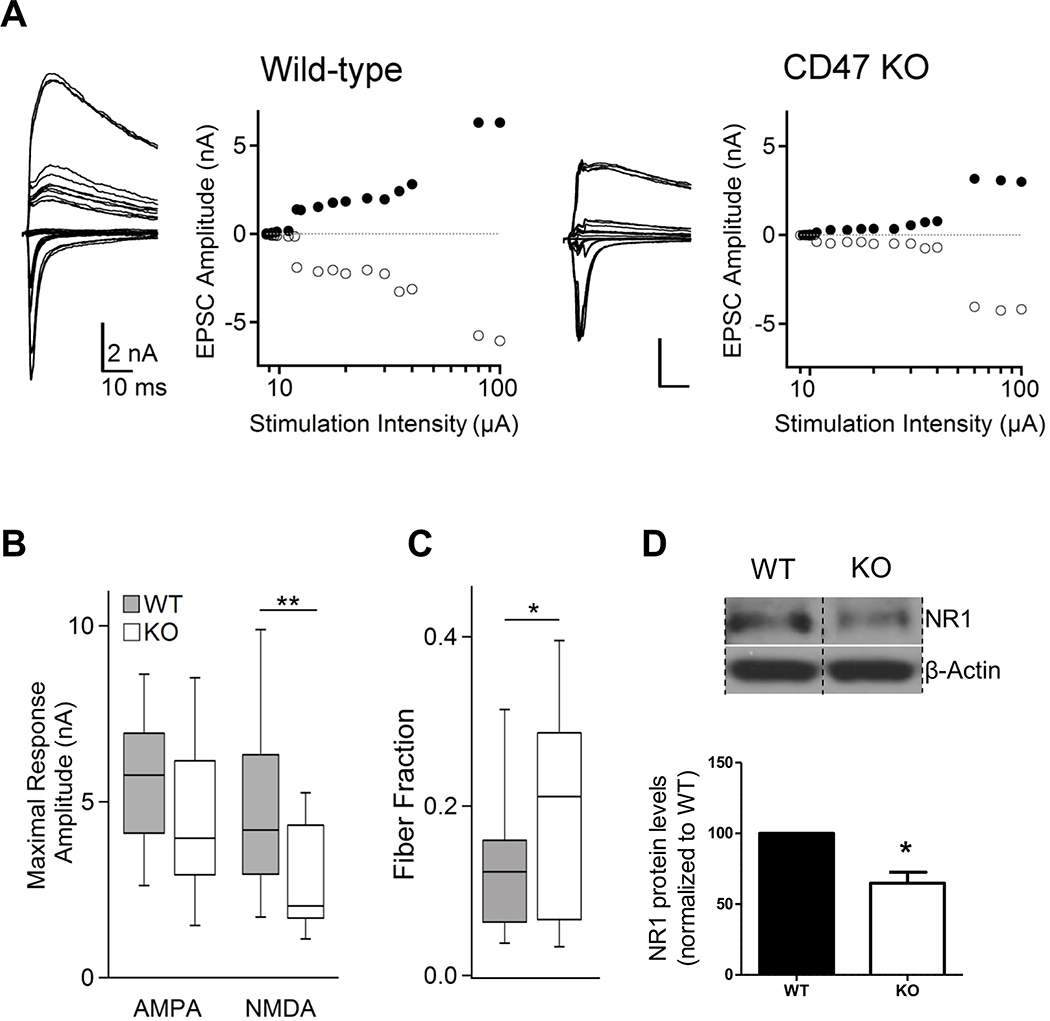
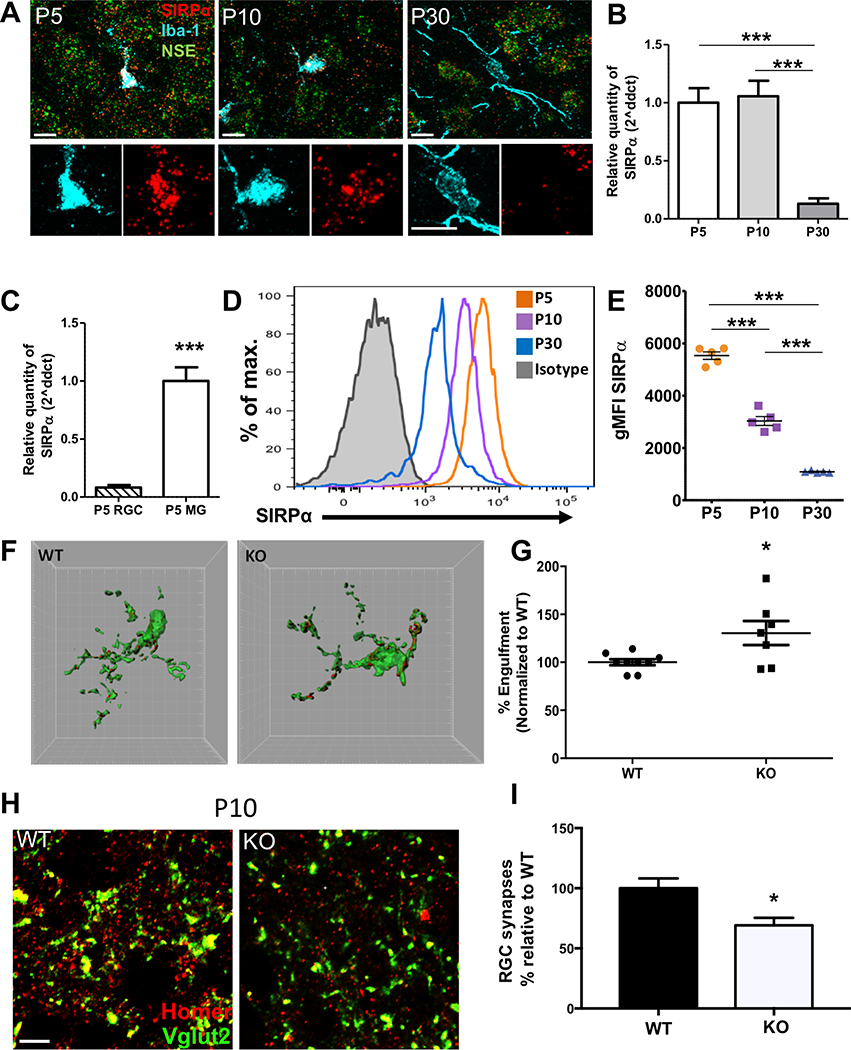
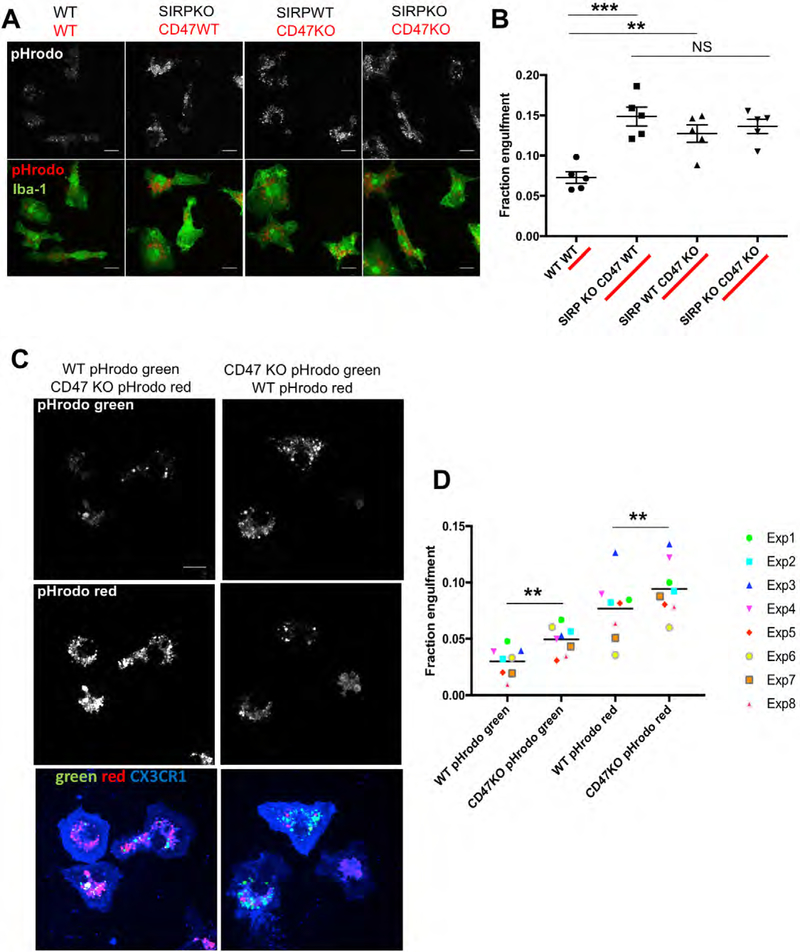
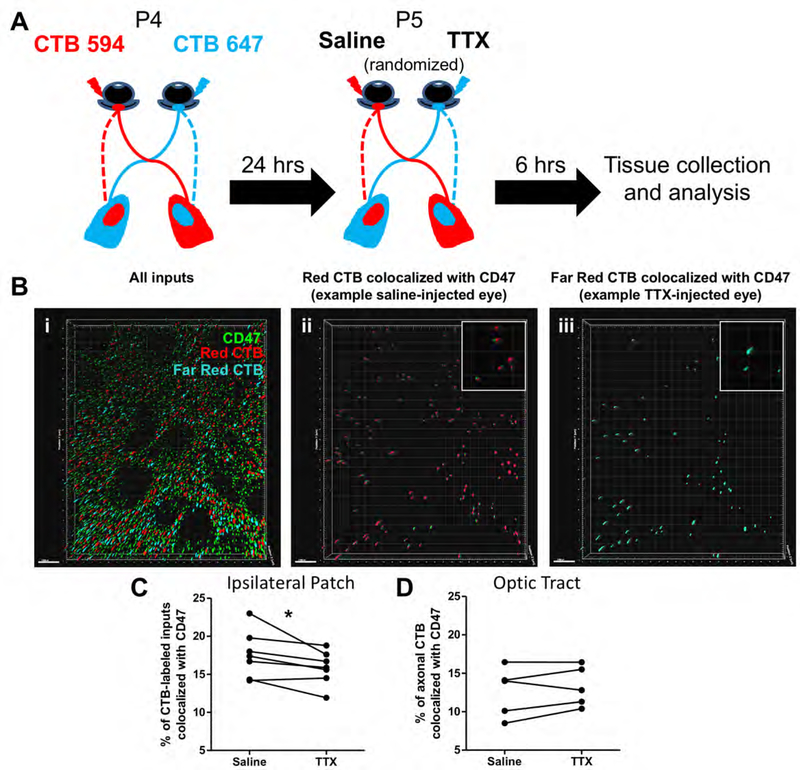
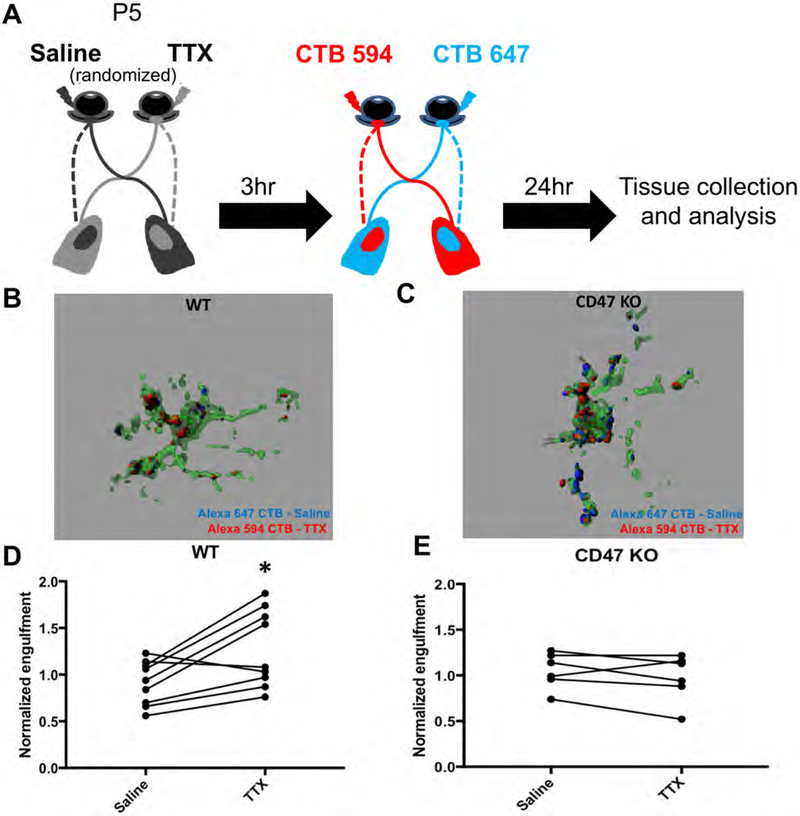
Microglia regulate synaptic circuit remodeling and phagocytose synaptic material in the healthy brain; however, the mechanisms directing microglia to engulf specific synapses and avoid others remain unknown. Here, we demonstrate that an innate immune signaling pathway protects synapses from inappropriate removal. The expression patterns of CD47 and its receptor, SIRPα, correlated with peak pruning in the developing retinogeniculate system, and mice lacking these proteins exhibited increased microglial engulfment of retinogeniculate inputs and reduced synapse numbers in the dorsal lateral geniculate nucleus. CD47-deficient mice also displayed increased functional pruning, as measured by electrophysiology. In addition, CD47 was found to be required for neuronal activity-mediated changes in engulfment, as microglia in CD47 knockout mice failed to display preferential engulfment of less active inputs. Taken together, these results demonstrate that CD47-SIRPα signaling prevents excess microglial phagocytosis and show that molecular brakes can be regulated by activity to protect specific inputs.

Keywords: CD47; SIRPα; activity; don’t eat me; microglia; phagocytosis; protective signal; pruning; refinement; retinogeniculate system.


Conflict of interest statement

Declaration of Interests

The authors declare no competing interests. Beth Stevens serves on the scientific advisory board of Annexon LLC. and is a minor shareholder of Annexon LLC but this is unrelated to the submitted work.

Figures

Figure 1.
Figure 1.. CD47 Is Expressed by RGCs, Localized to dLGN Synapses, and Enriched in the dLGN during Pruning
(A) Representative 10× magnification mosaics of P5, P10, and P30 wild-type (WT) coronal sections. CD47 is enriched in the dLGN (arrow) during peak pruning at P5 and P10 but evenly distributed throughout the brain at P30. Scale bar, 500 μm. (B) CD47 (left) is highly enriched in the dLGN during pruning, similar to Vglut2 (right), a marker of retinogeniculate synapses. Scale bar, 50 μm. (C) Orthogonal views of CD47 (red), presynaptic Vglut2 (green), and postsynaptic Homer1 (blue) staining in P5, P10, and P30 dLGN captured using structured illumination microscopy (SIM, upper panels). Images show examples of CD47 colocalization with RGC synapses (defined as presynaptic Vglut2 and postsynaptic Homer1 puncta that exist within 300 nm of each other). Scale bar, 0.5 μm. Lower-magnification, single-plane (z depth, 0.101 μm) SIM images of P5, P10, and P30 WT dLGN show that CD47 (red) colocalizes with both presynaptic (Vglut2, green) and postsynaptic (Homer1, blue) puncta during pruning (lower panels). Examples of synapses colocalized with CD47 are circled. Scale bar, 2 μm. (D) Representative fluorescence in situ hybridization (FISH) 20× (top) and 63× (middle and bottom) images of Cd47 and neuron-specific enolase (NSE, a general neuronal marker) in the P5 retina. Cd47 is expressed in neuronal layers of the retina, including the ganglion cell layer (GCL) that projects presynaptic inputs to the LGN (top). Scale bar, 50 μm. In the GCL (middle and bottom images), the Cd47 signal is present in cells (nuclei labeled with DAPI, blue) that are also positive for neuronal marker NSE. The bottom image provides a higher-magnification view of the GCL. Scale bar, 10 μm.
Figure 2.
Figure 2.. Microglia in the CD47KO dLGN exhibit increased engulfment.
A, Schematic depicting CTB-labeled RGC inputs projecting to the dLGN. B, Representative 3-dimensional reconstructions of P5 WT (left) and CD47KO (right) littermate microglia (green) with internalized CTB-labeled inputs (red and blue). Grid line increments = 5 μm. C, Graph depicting the average percent of microglia volume occupied by CTB-labeled material in microglia from the dLGN of CD47KO mice and WT littermates (% Engulfment), n= 6 WT, 7 CD47KO mice, *p<0.02, unpaired t-test.
Figure 3.
Figure 3.. CD47KO Mice Have Reduced Numbers of Vglut2-Positive Retinogeniculate Synapses
(A) Representative 63× confocal image depicting synaptic staining for retinogeniculate presynaptic marker Vglut2 (green) and postsynaptic marker Homer1 (red) in P5 WT (left) and CD47KO (right) mouse dLGN. Scale bars, 5 μm. (B) Graph depicting the percentage of retinogeniculate (RGC) synapses in P5 CD47KO mice relative to that seen in WT littermate controls, n = 5 WT and 6 CD47KO mice. Not significant (NS), unpaired t test. (C) Representative 63× confocal images of synaptic staining for retinogeniculate presynaptic marker Vglut2 (green) and postsynaptic marker Homer1 (red) in P10 WT (left) and CD47KO (right) dLGN. Scale bars, 5 μm. (D) Graph depicting the percentage of RGC synapses in P10 CD47KO mice relative to that seen in WT littermate controls, n = 6 WT and 5 CD47KO mice. ∗p < 0.04, unpaired t test. Unlike at P5, P10 CD47KOs have significantly reduced numbers of RGC synapses. (E) Representative 63× confocal images of synaptic staining for Vglut2 (green) and Homer1 (red) in P60 WT (left) and CD47KO (right) dLGN. Scale bars, 5 μm. (F) Graph depicting the percentage of RGC synapses in P60 CD47KO mice relative to that seen in WT littermate controls, n = 5 WT and 5 CD47KO mice. ∗∗p < 0.01, one-sample t test. P60 CD47KOs have a sustained reduction in RGC numbers. (G) Representative 63× confocal images of synaptic staining for corticogeniculate presynaptic marker Vglut1 (green) and postsynaptic marker Homer1 (red) in P60 WT (left) and CD47KO (right) dLGN. Scale bars, 5 μm. (H) Graph depicting the percentage of corticogeniculate synapses in P60 CD47KO mice relative to that seen in WT littermate controls, n = 4 WT and 4 CD47KO mice. NS, one-sample t test. (I) Representative western blot image of Vglut2 in microdissected dLGN from P60 WT and CD47KO littermates (lanes containing other samples, indicated by hashed lines, removed for clarity). (J) Quantification of western blot in (I) shows Vglut2 levels are significantly reduced in the P60 CD47KO dLGN, n = 5 WT and 4 CD47KO mice. ∗∗∗p < 0.001, unpaired t test. (K) Representative western blot image of Vglut1 in microdissected dLGN from P60 WT and CD47KO littermates. (L) Quantification of western blot in (K) indicates that Vglut1 levels are unchanged in the mature CD47KO dLGN, n = 7 WT and 6 CD47 mice. NS, unpaired t test. All error bars represent SEM.
Figure 4.
Figure 4.. dLGN relay neurons in mature (P60–73) CD47KO mice receive fewer retinal inputs.
A, Representative retinogeniculate slice recordings from wild-type (left two panels) and CD47KO (right two panels) dLGN neurons. For each example, the left panel shows superimposed traces of EPSCs recorded in response to increasing stimulation of the optic tract at alternating holding potentials of −70 mV (inward/AMPA receptor currents) and +40 mV (outward/combined AMPA and NMDA receptor currents). Each right panel plots the peaks of inward (filled markers) and outward (empty circles) currents against the stimulus intensity. B, Maximal retinogeniculate EPSCs (stimulation of the bulk of the optic tract) are altered in KO (n = 15 cells) relative to WT (n = 23 cells) mice (AMPA: NS, NMDA *p<0.01, Wilcoxon-signed rank). C, Fiber Fraction (FF) estimate of RGC convergence onto relay neurons is larger in mature CD47KO mice than WT mice (*p<0.05 Mann-Whitney), indicating fewer retinal inputs per neuron. D, Western blot analysis of NR1 in microdissected dLGN from P60 WT and CD47KO littermates shows that NR1 levels are reduced in the P60 CD47KO dLGN, n = 4 WT, 4 CD47KO (lanes containing other samples removed for clarity). *p<0.03, one-sample t-test. In B-C, the line represents the median, the box outlines the 25–75% range, and the whiskers show 90% of the maximal range. In D, error bars represent s.e.m.
Figure 5.
Figure 5.. SIRPα Is Highly Expressed by Microglia in the dLGN during the Pruning Period and Required to Prevent Excess Microglial Engulfment
(A) Representative 63× confocal images of FISH for Sirpα (red) and neuronal marker NSE (green) combined with IHC for microglial marker Iba-1 (blue) in the dLGN. Sirpα is primarily expressed by microglia at P5 and continues to be expressed by microglia at P10, but it is primarily expressed by neurons at P30. Lower panels show magnified images of the microglial cell body to more clearly depict colocalization between in situ hybridization (ISH) signal for Sirpα and Iba-1 staining. Scale bars, 10 μm. (See also Figure S5A.) (B) Sirpα expression declines in acutely isolated microglia as the pruning period nears completion (P30), as measured by qPCR, n = 6 samples per age. ∗∗∗p < 0.0001, one-way ANOVA with P5 versus P30 and P10 versus P30; ∗∗∗p < 0.0001 via Tukey’s multiple comparison test. (C) Acutely isolated microglia (MG) express approximately 12-fold more Sirpα than acutely isolated RGCs, as measured by qPCR, n = 5 RGC samples and 5 microglia samples. ∗∗∗p < 0.0001, unpaired t test. (D and E) Developmental time course of cell surface SIRPα levels in acutely isolated microglia evaluated by flow cytometry. Representative histograms (D) and quantification of geometric mean fluorescent intensity (gMFI) of SIRPα (E) are shown for microglia (defined as the CD45int CD11bhigh P2RY12high population; see Figure S5D) and demonstrate a significant reduction at each time point as mice age, n = 5 mice per age. ∗∗∗p < 0.0001, one-way ANOVA with P5 versus P10, P5 versus P30, and P10 versus P30; ∗∗∗p < 0.0001 via Tukey’s multiple comparison test. (F) Representative three-dimensional reconstructions of SIRPαKO (right) and WT (left) littermate microglia (green) with internalized CTB-labeled inputs (red). Grid line increments = 5 μm. (G) Graph showing percentage engulfment of CTB-labeled inputs in microglia from P5 SIRPαKOs relative to that seen in WT littermates, n = 9 WT mice and 7 SIRPαKO mice. ∗p < 0.02, unpaired t test. (H) Representative confocal images of synaptic staining for retinogeniculate presynaptic marker Vglut2 (green) and postsynaptic marker Homer1 (red) in the core region of the dLGN of P10 WT (left) and SIRPαKO (right) mice. Scale bars, 5 μm. (I) Graph depicting the percentage of RGC synapses in P10 SIRPαKO mice relative to that seen in WT littermate controls, n = 6 WT and 5 SIRPαKO mice. ∗p < 0.05, unpaired t test. SIRPαKOs have significantly reduced numbers of RGC synapses. All error bars represent SEM.
Figure 6.
Figure 6.. Neuronal CD47 and Microglial SIRPα Are Both Required to Specifically Reduce Engulfment of CD47-Expressing Synaptosomes
(A) Representative images of cultured SIRPαKO or WT microglia engulfing pHrodo-conjugated synaptosomes (top: engulfed pHrodo, bottom: Iba-1 and pHrodo merged image). Scale bars, 15 μm. (B) SIRPαKO microglia engulf significantly more synaptosomes than WT microglia, and WT microglia engulf significantly more CD47KO synaptosomes than WT synaptosomes. Feeding CD47KO synaptosomes to SIRPαKO microglia does not have an additive effect, n = 5 experiments. ∗∗∗p < 0.0004, one-way ANOVA with WT, WT versus SIRPαKO, CD47 WT; ∗∗∗p < 0.0004, with WT, WT versus SIRPα WT, CD47KO, and WT, WT versus SIRPαKO, CD47KO; ∗∗p < 0.007 via Tukey’s multiple comparison test. All error bars represent SEM. (C) Representative images of cultured WT microglia (labeled with CX3CR1) engulfing a 1:1 mixed population of WT:CD47KO synaptosomes conjugated with either pHrodo red or pHrodo green. Note the increased amount of CD47KO synaptosomes engulfed relative to WT synaptosomes regardless of the pHrodo color used. (D) Graph depicting the fraction of synaptosomes engulfed for every combination of pHrodo color and genotype. CD47KO synaptosomes conjugated with either pHrodo green or pHrodo red show a significantly higher fraction engulfment than WT synaptosomes of the same color, n = 8 independent experiments. ∗∗∗p < 0.0004, two-way ANOVA shows that genotype is a significant source of variation with WT pHrodo green versus CD47KO pHrodo green; ∗∗p < 0.001, with WT pHrodo red versus CD47KO pHrodo red; ∗∗p < 0.004 via Tukey’s multiple comparison test. For (A) and (B), the genotype of the microglia is listed first and the genotype of synaptosomes is written or underlined in red.
Figure 7.
Figure 7.. CD47 preferentially colocalizes with more active inputs.
A, Schematic demonstrating the experimental paradigm. B, Representative Imaris rendering of an 100X SIM image of the dLGN ipsilateral territory. RGC inputs to this region of the dLGN have been labeled by intraocular injection of CTB-594 (red) and CTB-647 (blue), and IHC for CD47 is shown in green. (ii and iii) Imaris and Matlab renderings of CD47 puncta colocalized with CTB-594 and CTB-647, respectively. Insets show enlarged examples of colocalized puncta. Note that, in this field of view, fewer CTB-647-positive inputs (those from the TTX-injected eye) than CTB-594-positive inputs (those from the saline-injected eye) colocalize with CD47. Scale bars = 1 μm. C, Quantification of the percent of inputs colocalized with CD47 demonstrates that CD47 colocalizes more with saline-treated inputs (more active) than TTX-treated inputs (less active), n = 7 mice. *p<0.05, paired t-test. D, Quantification of the percent of axonal material that colocalizes with CD47 in the optic tract. TTX-treatment does not affect CD47 localization to axons, n = 5 mice. NS, paired t-test.
Figure 8
Figure 8. CD47 Is Required for Activity-Dependent Microglial Engulfment of Weaker RGC Inputs
(A) Schematic demonstrating the experimental paradigm. (B and C) Representative three-dimensional reconstructions of P5 WT (B) and CD47KO (C) microglia (green) with internalized CTB-labeled RGC inputs (red and blue) from either the TTX-treated or the saline-treated eye. In the WT microglial cell, there are more engulfed inputs from the TTX-treated eye, but in the CD47KO microglial cell, a similar amount of engulfed material from both eyes is present. Grid line increments = 5 μm. (D) Graph showing that microglia in the dLGN of WT mice engulfed more CTB-labeled material (volume engulfed CTB/volume of the cell) from the TTX-treated eye than the saline-treated eye, n = 9. ∗p < 0.02, paired t test. (E) Graph showing that microglia in the dLGN of CD47KO mice engulfed a similar amount of CTB-labeled material from the TTX-treated eye as they did from the saline-treated eye, n = 6. NS, paired t test.

Comment in

References

    1. Adams S, van der Laan LJW, Vernon-Wilson E, Renardel de Lavalette C, Döpp EA, Dijkstra CD, Simmons DL, and van den Berg TK (1998). Signal-Regulatory Protein Is Selectively Expressed by Myeloid and Neuronal Cells. The Journal of Immunology 161, 1853–1859. - PubMed
    1. Barria A, and Malinow R (2002). Subunit-specific NMDA receptor trafficking to synapses. Neuron 35, 345–353. - PubMed
    1. Bjartmar L, Huberman AD, Ullian EM, Renteria RC, Liu X, Xu W, Prezioso J, Susman MW, Stellwagen D, Stokes CC, et al. (2006). Neuronal pentraxins mediate synaptic refinement in the developing visual system. J Neurosci 26, 6269–6281. - PMC - PubMed
    1. Bohlen C, Bennett C, Tucker AF, Collins HY, Mullinyawe SB, Barres BA, (2017) Diverse requirements for microglial survival, specification, and function revealed by defined-medium sultures. Neuron 94, 759–773 - PMC - PubMed
    1. Butts DA, Kanold PO, and Shatz CJ (2007). A Burst-Based “Hebbian” Learning Rule at Retinogeniculate Synapses Links Retinal Waves to Activity-Dependent Refinement. PLoS biology 5, e61. - PMC - PubMed

Publication types