. 2018 Oct 10;100(1):135-149.e7.
doi: 10.1016/j.neuron.2018.09.016.

Subtype Diversification and Synaptic Specificity of Stem Cell-Derived Spinal Interneurons

Affiliations

Subtype Diversification and Synaptic Specificity of Stem Cell-Derived Spinal Interneurons

Phuong T Hoang et al. Neuron. .

Abstract

Neuronal diversification is a fundamental step in the construction of functional neural circuits, but how neurons generated from single progenitor domains acquire diverse subtype identities remains poorly understood. Here we developed an embryonic stem cell (ESC)-based system to model subtype diversification of V1 interneurons, a class of spinal neurons comprising four clades collectively containing dozens of molecularly distinct neuronal subtypes. We demonstrate that V1 subtype diversity can be modified by extrinsic signals. Inhibition of Notch and activation of retinoid signaling results in a switch to MafA clade identity and enriches differentiation of Renshaw cells, a specialized MafA subtype that mediates recurrent inhibition of spinal motor neurons. We show that Renshaw cells are intrinsically programmed to migrate to species-specific laminae upon transplantation and to form subtype-specific synapses with motor neurons. Our results demonstrate that stem cell-derived neuronal subtypes can be used to investigate mechanisms underlying neuronal subtype specification and circuit assembly.

Keywords: Renshaw cell; V1 interneuron; differentiation; embryonic stem cells; in vitro; motor neuron; neurons; spinal cord; subtype; synaptic specificity.


Figures

Figure 1.
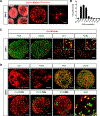
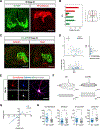
Figure 1.. Directed Differentiation of V1 Interneurons from Mouse ESCs.
(A) En1-lineage cells identified by En1-tdTomato reporter expression. Scale bars, 100, 50, and 20 μm. (B) Quantification of En1-lineage cells differentiated with 1 μM RA and different concentrations of SAG. Values are shown as mean ± SEM. (C) Expression of the ventral progenitor markers Pax6 and Nkx6.2 and the early postmitotic V1 IN markers En1 and Foxd3 in day 5 EBs. Scale bars, 50 μm (insets, 20 μm). (D) En1-lineagecells downregulate En1 and Foxd3 and upregulate late postmitotic V1 IN genes by day 8. En1-lineage cells express NeuN but not other ventral spinal neuron markers. Scale bars, 50 μm.
Figure 2.
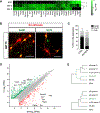
Figure 2.. Molecular Signature of En1-Line-age Cells In Vitro.
(A) RNA-seq expression analysis of ESCs and FACS-purified day 5 or day 8 En1-lineage cells (log2 transcripts per million [log2TPM]). (B) Cultured En1-lineage cells express the inhibitory markers Gad67 and GlyT2. Scale bars, 20 μm. (C) Gad67 and GlyT2 expression in cells cultured on laminin and fibronectin versus an astrocyte monolayer (mean ± SEM, ANOVA, *p < 0.05). (D) Comparison of gene expression of ESC-derived V1 and dI4 INs on day 8 (log2TPM). (E) Clustering ofprimaryVI INs (E12.5, P0, and P5) with day 5 (top) and day 8 (bottom) ES V1 INs, based on genes differentially expressed in E12.5 spinal V1 INs compared with dI4 INs (log2fold change cutoff 1.5 and adjusted p value [p-adj] < 0.01).
Figure 3.
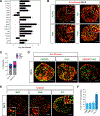
Figure 3.. Subtype Diversity of ESC-Derived V1 Interneurons.
(A) Differential expression of 19 TFs defining V1IN subtypes in day 8 ES-V1 INs relative to ES-dI4 INs (log2 fold change [log2FC], mean ± SEM). (B) Day 8 ES-V1 INs express clade-specific TFs. Scale bars, 50 μm (insets, 20 μm). (C) Quantification of V1 INs expressing the clade-specific TFs in P0 spinal and in vitro-derived V1 INs (mean ± SEM). (D) Non-overlapping subsets of ES-V1 Ins express Cb and Foxp2. Scale bars, 50 μm. (E) Day 8 Cb-positive cells express MafA, MafB, and OC2. Scale bars, 50 μm (insets, 20 μm). (F) Quantification of Cb-positive ES-V1 INs expressing MafA, MafB, OC2, or one of the three TFs (mean ± SEM).
Figure 4.
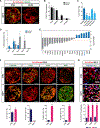
Figure 4.. Retinoid and Notch Signaling Control V1 Interneuron Clade Identity.
(A) Cb-expressing day 8 ES-V1 INs under control conditions and following RA removal on day 5. Scale bars, 50 μm. (B) Quantification of Foxp2-, Cb-, and MafA-expressing cells following RA removal on day 5 (mean ± SEM; Student’s t test; **p < 0.01, ***p < 0.001). (C) Quantification of Cb-positive ES-V1 INs under conditions where RA is removed on day 5 and cells are mixed with cervical MNs, Hoxc8-induced brachial MNs, or brachial MNs cultured in the absence of vitamin A (mean ± SEM; Student’s t test; *p < 0.05, **p < 0.01, ***p < 0.001). (D) Birthdating of Cb-and Foxp2-expressing ES-V1 INs by BrdU pulse labeling (mean ± SEM). (E) Differential expression of TFs associated with RC (blue bars) and non-RC identity (gray bars) in day 8 V1 INs following DAPT treatment on day 4. Dashed lines represent 1.5 log2FC cutoff for significance (mean ± SEM). (F) Immunostaining and quantification of day 8 EBs treated with DAPT on day 4 (mean ± SEM; Student’s t test; *p < 0.05, ***p < 0.001). Scale bars, 50 μm. (G) Expression of MafA, MafB, or OC2 in Cb-positive ES-V1 INs on day 8 following DAPT treatment on day 4 (mean ± SEM; Student’s t test; ***p < 0.001). Scale bars, 20 μm.
Figure 5.
Figure 5.. Functional Characterization of ESC-Derived Renshaw Cells.
(A) Day 5 En1-GFP and day 6 Ptf1a-tdTomato EBs co-grafted into Hamburger-Hamilton stage 16 (HH16) chick embryonic spinal cord and examined at HH30 (n ≥ 4 each). Scale bars, 100 μm. (B) Quantification of cell migration into distinct regions of the spinal cord divided into 6 equivalent dorsoventral bins (mean ± SEM). (C) Immunostaining of transplanted V1 INs for Cb and Foxp2. Scale bars, 100 μm. (D) Distribution of Cb-and Foxp2-expressing transplated cells along the medio-lateral and dorso-ventral axes. (E) Post hoc immunostaining of Neurobiotin-filled En1-lineage cell for subtype identification. Renshaw cells are En1-tdTomato cells co-expressing Cb and OC2. Scale bar, 20 μm. (F) Superimposed membrane responses (top traces) following current injection (bottom traces) in RC and non-RC V1 INs in vitro. (G) Current-to-voltage relationships for RCs versus non-RCs. Based on the slope of the linear current-to-voltage relationship, RCs have increased input resistance compared with other V1 IN subtypes (421.7 megaohms [MΩ] ± 30.1 versus 264.0 MΩ ± 16.1) (mean ± SEM). (H) Passive membrane properties of recorded ES-RC and non-RC V1 INs (see also Figure S5C) (mean ± SEM; Student’s t test; *p < 0.05, ***p < 0.001).
Figure 6.
Figure 6.. Monosynaptic Rabies Virus Tracing Reveals Motor Neuron Connectivity of ES-V1 Interneurons.
(A) Schematic of monosynaptic rabies virus tracing. (B) RABV tracing with GFP-expressing ES-MNs (green) and ES-V1 INs (red), including SADDG-GFP-expressing V1 INs connected to MNs (yellow). (C) Immunostaining for Cb and Foxp2 reveals the subtype identity of premotor V1 INs. Scale bars, 50 μm. (D) The calculated connectivity index (C.I.) reveals V1 subtype-specific MN connectivity. The red dotted line marks a C.I. of1, or 50% likelihood. Mean ± SEM; ANOVA; *p < 0.05, **p < 0.01.
Figure 7.
Figure 7.. Optogenetically Activated Motor Neurons Preferentially Innervate Renshaw Cells.
(A) Schematic depicting potential MN cholinergic inputs onto RC and non-RC V1 INs. (B) Day 5 En1-GFP EBs grafted into HH16chick spinal cord and examined 7 days later (HH36) (n = 4). LMCm, lateral motor column, medial; LMCl, lateral motor column, lateral; MMC, medial motor column. Scale bars, 100 μM (inset, 50 μM). (C) Transplanted Cb-expressing En1-GFP cells receive abundant VAChT contacts on their somata and proximal processes, whereas En1-GFP-only cells are devoid of VAChT inputs. Scale bar, 20 μm. (D) FACS-purified ES-V1 INs and ES-MNs co-cultured for 22 days and immunostained for Cb, OC2, and VAChT. Scale bar, 20 μm. (E) ES-V1 IN subtype-specific recruitment of VAChT-immunoreactive inputs (mean ± SEM; Student’s t test, ***p < 0.001). (F) Schematic of optogenetics-mediated whole-cell patch-clamp recordings. (G) Photostimulation of MNs (green line, 25 ms) produces single action potentials (APs) (top), which elicit APs in RCs, as revealed by current-clamp recordings (center). RC responses are abolished using a combination of the cholinergic blockers mecamylamine (50 μM) and atropine (5 μM) (bottom). The asterisk denotes latency of RC response. (H) The latency from the MN AP to the onset of the RC response was ~4 ms following MN stimulation at 0.1 Hz (mean ± SEM). (I) Response onset variability, or jitter, of the ES-RC response over multiple trials at 0.1 Hz (see also Figure S7E). (J) At 0.1-and 1-Hz stimulation frequencies, the variability of the RC response was minimal. (K) ES-RCs are significantly more likely to depolarize in response to MN photoactivation compared with non-RC V1 INs (mean ± SEM; Student’s t test, ***p < 0.001).

Comment in

Similar articles

Cited by

References

    1. Abbondanzo SJ, Gadi I, and Stewart CL (1993). Derivation of embryonic stem cell lines. Methods Enzymol. 225, 803–823. - PubMed
    1. Albuquerque C, Joseph DJ, Choudhury P, and MacDermott AB (2009). Dissection, plating, and maintenance of cortical astrocyte cultures. Cold Spring Harb. Protoc. 2009, pdb.prot5273. - PubMed
    1. Alvarez FJ, and Fyffe RE (2007). The continuing case for the Renshaw cell. J. Physiol. 584, 31–45. - PMC - PubMed
    1. Alvarez FJ, Benito-Gonzalez A, and Siembab VC (2013). Principles of interneuron development learned from Renshaw cells and the motoneuron recurrent inhibitory circuit. Ann. N Y Acad. Sci. 1279, 22–31. - PMC - PubMed
    1. Balciunas D, Wangensteen KJ, Wilber A, Bell J, Geurts A, Sivasubbu S, Wang X, Hackett PB, Largaespada DA, McIvor RS, and Ekker SC (2006). Harnessing a high cargo-capacity transposon for genetic applications in vertebrates. PLoS Genet. 2, e169. - PMC - PubMed

Publication types