

Electrokinetic infusions into hydrogels and brain tissue: Control of direction and magnitude of solute delivery
- PMID: 30308210
- PMCID: PMC6258323
- DOI: 10.1016/j.jneumeth.2018.10.005
Electrokinetic infusions into hydrogels and brain tissue: Control of direction and magnitude of solute delivery
Abstract
Background: Delivering solutes to a particular region of the brain is currently achieved by iontophoresis for very small volumes and by diffusion from a microdialysis probe for larger volumes. There is a need to deliver solutes to particular areas with more control than is possible with existing methods.
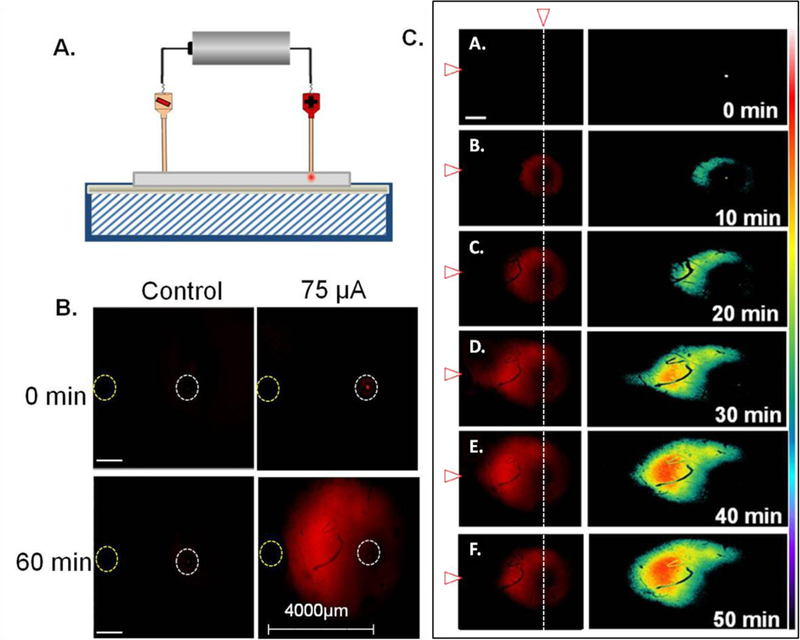
New method: Electrokinetic infusions of solutes were performed into hydrogels and organotypic hippocampal slice cultures. Application of an electrical current creates electroosmotic flow and electrophoresis of a dicationic fluorescent solute through organotypic hippocampal tissue cultures or larger hydrogels. Transport was recorded with fluorescence microscopy imaging in real-time.
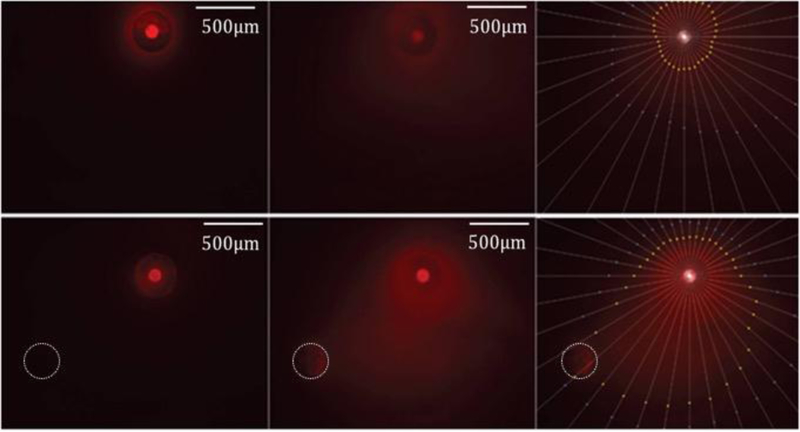
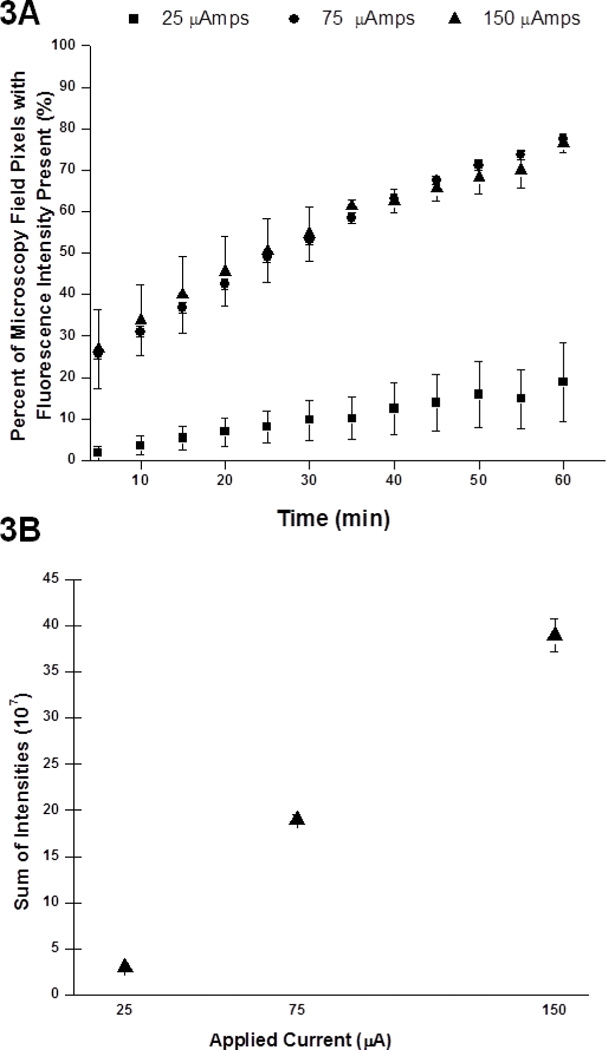
Results: Electrokinetic transport in brain tissue slice cultures and hydrogels occurs along an electrical current path and allows for anisotropic delivery over distances from several hundred micrometers to millimeters. Directional transport may be controlled by altering the current path. The applied electrical current linearly affects the measured solute fluorescence in our model system following infusions.
Comparison with existing methods: Localized drug delivery involves iontophoresis, with diffusion primarily occurring beyond infusion capillaries under current protocols. Pressure-driven infusions for intraparenchymal targets have also been conducted. Superfusion across a tissue surface provides modest penetration, however is unable to impact deeper targets. In general, control over intraparenchymal drug delivery has been difficult to achieve. Electrokinetic transport provides an alternative to deliver solutes along an electrical current path in tissue.
Conclusions: Electrokinetic transport may be applied to living systems for molecular transport. It may be used to improve upon the control of solute delivery over that of pressure-driven transport.
Keywords: Drug delivery; Electrokinetic transport; Electroosmosis; Iontophoresis.
Copyright © 2018 Elsevier B.V. All rights reserved.
Conflict of interest statement
CONFLICT OF INTEREST
Declarations of interest: none.
Figures
Similar articles
-
Electrokinetic convection-enhanced delivery for infusion into the brain from a hydrogel reservoir.Commun Biol. 2024 Jul 17;7(1):869. doi: 10.1038/s42003-024-06404-1. Commun Biol. 2024. PMID: 39020197 Free PMC article.
-
Electrokinetic Convection-Enhanced Delivery of Solutes to the Brain.ACS Chem Neurosci. 2020 Jul 15;11(14):2085-2093. doi: 10.1021/acschemneuro.0c00037. Epub 2020 Jul 6. ACS Chem Neurosci. 2020. PMID: 32559365 Free PMC article.
-
Iontophoresis from a micropipet into a porous medium depends on the ζ-potential of the medium.Anal Chem. 2012 Mar 6;84(5):2179-87. doi: 10.1021/ac202434c. Epub 2012 Feb 17. Anal Chem. 2012. PMID: 22264102 Free PMC article.
-
Targeted drug delivery to the skin and deeper tissues: role of physiology, solute structure and disease.Clin Exp Pharmacol Physiol. 1997 Nov;24(11):874-9. doi: 10.1111/j.1440-1681.1997.tb02708.x. Clin Exp Pharmacol Physiol. 1997. PMID: 9363373 Review.
-
The role of electroosmotic flow in transdermal iontophoresis.Adv Drug Deliv Rev. 2001 Mar 1;46(1-3):281-305. doi: 10.1016/s0169-409x(00)00138-1. Adv Drug Deliv Rev. 2001. PMID: 11259844 Review.
Cited by
-
Influence of Anisotropic White Matter on Electroosmotic Flow Induced by Direct Current.Front Bioeng Biotechnol. 2021 Aug 13;9:689020. doi: 10.3389/fbioe.2021.689020. eCollection 2021. Front Bioeng Biotechnol. 2021. PMID: 34485253 Free PMC article.
-
Electrokinetic convection-enhanced delivery for infusion into the brain from a hydrogel reservoir.Commun Biol. 2024 Jul 17;7(1):869. doi: 10.1038/s42003-024-06404-1. Commun Biol. 2024. PMID: 39020197 Free PMC article.
-
Electrokinetic Convection-Enhanced Delivery of Solutes to the Brain.ACS Chem Neurosci. 2020 Jul 15;11(14):2085-2093. doi: 10.1021/acschemneuro.0c00037. Epub 2020 Jul 6. ACS Chem Neurosci. 2020. PMID: 32559365 Free PMC article.
-
Electroosmotic Perfusion, External Microdialysis: Simulation and Experiment.ACS Chem Neurosci. 2023 Jul 19;14(14):2499-2508. doi: 10.1021/acschemneuro.3c00057. Epub 2023 Jun 28. ACS Chem Neurosci. 2023. PMID: 37379416 Free PMC article.
References
-
- Stone TW, ed. Microiontophoresis and Pressure Ejection. Vol. 8 1985, Wiley: Chichester, U.K.
-
- Nicholson C, Phillips JM, and Gardner-Medwin AR, Diffusion from an iontophoretic point source in the brain: role of tortuosity and volume fraction. Brain Res, 1979. 169(3): p. 580–4. - PubMed
-
- Norman RS, Diffusional spread of iontophoretically injected ions. J Theor Biol, 1975. 52(1): p. 159–62. - PubMed
Publication types
MeSH terms
Substances
Grants and funding
LinkOut - more resources
Full Text Sources
