. 2018 Oct 10;10(10):375.
doi: 10.3390/cancers10100375.

Energy Stress-Mediated Cytotoxicity in Tuberous Sclerosis Complex 2-Deficient Cells with Nelfinavir and Mefloquine Treatment

Affiliations

Energy Stress-Mediated Cytotoxicity in Tuberous Sclerosis Complex 2-Deficient Cells with Nelfinavir and Mefloquine Treatment

Henry D McCann et al. Cancers (Basel). .

Abstract

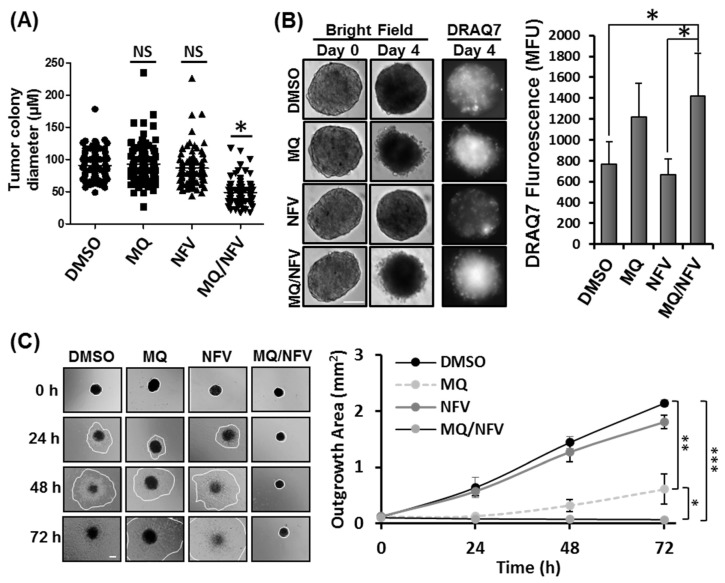
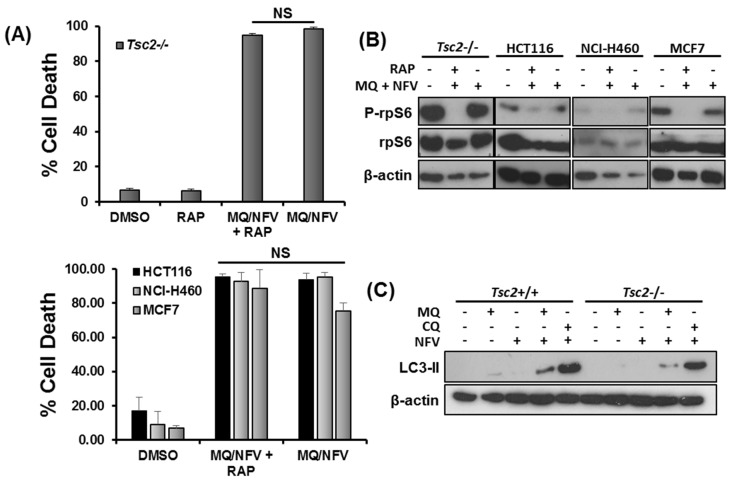
To find new anti-cancer drug therapies, we wanted to exploit homeostatic vulnerabilities within Tuberous Sclerosis Complex 2 (TSC2)-deficient cells with mechanistic target of rapamycin complex 1 (mTORC1) hyperactivity. We show that nelfinavir and mefloquine synergize to selectively evoke a cytotoxic response in TSC2-deficient cell lines with mTORC1 hyperactivity. We optimize the concentrations of nelfinavir and mefloquine to a clinically viable range that kill cells that lack TSC2, while wild-type cells tolerate treatment. This new clinically viable drug combination causes a significant level of cell death in TSC2-deficient tumor spheroids. Furthermore, no cell recovery was apparent after drug withdrawal, revealing potent cytotoxicity. Transcriptional profiling by RNA sequencing of drug treated TSC2-deficient cells compared to wild-type cells suggested the cytotoxic mechanism of action, involving initial ER stress and an imbalance in energy homeostatic pathways. Further characterization revealed that supplementation with methyl pyruvate alleviated energy stress and reduced the cytotoxic effect, implicating energy deprivation as the trigger of cell death. This work underpins a critical vulnerability with cancer cells with aberrant signaling through the TSC2-mTORC1 pathway that lack flexibility in homeostatic pathways, which could be exploited with combined nelfinavir and mefloquine treatment.

Keywords: ER stress; TSC; cancer therapy; energy homeostasis; mTOR; mefloquine; nelfinavir.


Conflict of interest statement

The authors declare no conflict of interest. RE is non-executive director of Biostatus Ltd., the vendor of DRAQ7.The funders had no role in the design of the study; in the collection, analyses, or interpretation of data; in the writing of the manuscript, and in the decision to publish the results.

Figures

Figure 1
Figure 1
Mefloquine and nelfinavir synergize to kill Tsc2−/− Mouse embryonic fibroblasts (MEFs), ELT3-T3 and sporadic cancer cells. Dose response curves were performed in Tsc2+/+ and Tsc2−/− MEFs using flow cytometry to measure cell death following treatment with (A) nelfinavir (NFV); (B) mefloquine (MQ) and (C) combined mefloquine with a fixed concentration of 10 µM nelfinavir (MQ/NFV); (D) Tsc2+/+ and Tsc2−/− MEFs; (E) ELT3-T3 and ELT3-V3; (F) MCF7, HCT116 and NCI-H460 were treated with either DMSO, etoposide (ETO), 10 µM mefloquine (MQ), 10 µM nelfinavir (NFV) or mefloquine combined with nelfinavir (MQ/NFV) for 48 h. Cells were then tested by flow cytometry and cells were separated into viable and non-viable cell populations via DRAQ7 staining. Statistical significance is shown with combination treated Tsc2−/− MEFs or the ELT3-V3 cells to their wild-type controls, and comparing single drug treatment of mefloquine and combination with the MCF7, HCT116 and NCI-H460.
Figure 2
Figure 2
Mefloquine and nelfinavir prevents colony formation and spheroid growth. (A) Colony formation was tested in Tsc2−/− MEFs seeded on soft agar that were treated for 14 days with Dimethyl Sulfoxide (DMSO), 10 µM mefloquine (MQ), 10 µM nelfinavir (NFV) or in combination. Tumor diameters were measured using Image J; scale bar is 200 μm. Significance was observed when comparing combined nelfinavir and mefloquine treatment to DMSO vehicle control. (B) Tsc2−/− MEF spheroids were treated under the same conditions as (A) for 96 h. DRAQ7 was supplemented for the final 36 h to monitor cell death before images were taken and DRAQ7 fluorescence quantified. (C) Spheroids treated in (B) were re-plated onto standard tissue culture plates and grown in drug-free media. Images were taken every 24 h and the area of outgrowth calculated using Image J, scale bar is 200 μm and outgrowth area is graphed.
Figure 3
Figure 3
Mefloquine and nelfinavir drug combination causes increased ER stress in Tsc2−/− MEFs. (A) Tsc2+/+ and Tsc2−/− MEFs were treated with either DMSO, 1 µM thapsigargin (TPG), 10 µM mefloquine (MQ), 10 µM nelfinavir (NFV), or mefloquine and nelfinavir combination for 6 h, where indicated. Total protein levels of TSC2, IRE1α, ATF4, CHOP, GADD34, S6K1 and β-actin and S6K1 phosphorylated at Thr389 were detected by Western blot. (B) Xbp1 mRNA splicing was determined from the same treatments as described in (A). PCR products were resolved on agarose gels (unspliced = 480 bp upper band, spliced = 454 bp lower band). (CE) Tsc2+/+ and Tsc2−/− MEFs were treated with either DMSO or mefloquine and nelfinavir combination (MQ/NFV) for 6 h before being processed for RNA sequencing. A heat map for a panel of ER stress-linked genes is shown (C) and are graphed in (D). (E) Differences of mRNA expression between Tsc2+/+ and Tsc2−/− MEFs treated with mefloquine and nelfinavir is shown as a volcano plot and highlights ER stress genes. (F) Tsc2+/+ and Tsc2−/− MEFs were treated with DMSO or mefloquine (MQ) and nelfinavir (NFV) combination for 6 h and 48 h. Total protein levels of ATF4, IRE-1α, GADD34, CHOP and β-actin were determined by Western blot.
Figure 4
Figure 4
Mefloquine and nelfinavir drug cytotoxicity is not associated with mTORC1 hyperactivity and causes minimal autophagy inhibition. (A) Tsc2−/− MEFs, NCI-H460, MCF7 and HCT116 cells were pre-treated with 50 nM rapamycin (RAP) for 1 h, where indicated, before being treated with 10 μM nelfinavir (NFV) and 10 µM mefloquine (MQ) for 48 h. Cells were stained with DRAQ7 and % cell death determined using flow cytometry. (B) Western blotting was carried out to determine rp-S6 phosphorylation at Ser235/236 in the cells treated in (A) after 48 h of treatment. (C) Tsc2+/+ and Tsc2−/− cells were treated with DMSO, 10 µM mefloquine (MQ), 20 µM chloroquine (CQ), 10 µM mefloquine or 20 µM chloroquine combined with 10 µM nelfinavir for 3 h. Accumulation of lipidated LC3-II were analyzed by Western blot. Total protein levels of β-actin were used as a loading control.
Figure 5
Figure 5
Mefloquine and nelfinavir combined drug treatment induces cytotoxicity via energy stress in Tsc2−/− MEFs. (A) The RNA sequencing data used for Figure 3C−E was assessed for gene-expression of genes involved in energy homeostasis. A heatmap for a panel of energy stress-linked genes is shown. Differences of mRNA expression between Tsc2+/+ and Tsc2−/− MEFs treated with mefloquine and nelfinavir is shown as a volcano plot (B) and graphed (C). (D) Tsc2−/− cells were treated with DMSO, 10 μM mefloquine and 10 μM nelfinavir combination (MQ/NFV) or mefloquine/nelfinavir combination with the addition of 8 mM methyl pyruvate (MQ/NFV/MP) for 48 h. Cells were then stained with DRAQ7 and % cell death determined by flow cytometry. (E) Tsc2−/− were treated with either DMSO or 10 μM mefloquine and 10 μM nelfinavir combination in the presence or absence of 8 mM methyl pyruvate for 24 h and total and phosphorylated ACC and AMPK was determined by western blot. (F) Tsc2+/+ and Tsc2−/− cells were treated with either DMSO or 10 μM mefloquine and 10 μM nelfinavir combination in the presence or absence of 8 mM methyl pyruvate for 6 and 24 h, where indicated. Total protein levels of ACC, CHOP GADD34 and ATF4 as well as phosphorylated ACC were detected by Western blot.

Similar articles

Cited by

References

    1. Tee A.R. The Target of Rapamycin and Mechanisms of Cell Growth. Int. J. Mol. Sci. 2018;19:E880. doi: 10.3390/ijms19030880. - DOI - PMC - PubMed
    1. Rad E., Murray J.T., Tee A.R. Oncogenic Signalling through Mechanistic Target of Rapamycin (mTOR): A Driver of Metabolic Transformation and Cancer Progression. Cancers. 2018;10:E5. doi: 10.3390/cancers10010005. - DOI - PMC - PubMed
    1. Tee A.R., Fingar D.C., Manning B.D., Kwiatkowski D.J., Cantley L.C., Blenis J. Tuberous sclerosis complex-1 and -2 gene products function together to inhibit mammalian target of rapamycin (mTOR)-mediated downstream signaling. Proc. Natl. Acad. Sci. USA. 2002;99:13571–13576. doi: 10.1073/pnas.202476899. - DOI - PMC - PubMed
    1. Krymskaya V.P., Goncharova E.A. PI3K/mTORC1 activation in hamartoma syndromes: Therapeutic prospects. Cell Cycle. 2009;8:403–413. doi: 10.4161/cc.8.3.7555. - DOI - PMC - PubMed
    1. Schmid K., Bago-Horvath Z., Berger W., Haitel A., Cejka D., Werzowa J., Filipits M., Herberger B., Hayden H., Sieghart W. Dual inhibition of EGFR and mTOR pathways in small cell lung cancer. Br. J. Cancer. 2010;103:622–628. doi: 10.1038/sj.bjc.6605761. - DOI - PMC - PubMed

LinkOut - more resources