

Estimation of Driver's Danger Level when Accessing the Center Console for Safe Driving
- PMID: 30309040
- PMCID: PMC6210281
- DOI: 10.3390/s18103392
Estimation of Driver's Danger Level when Accessing the Center Console for Safe Driving
Abstract
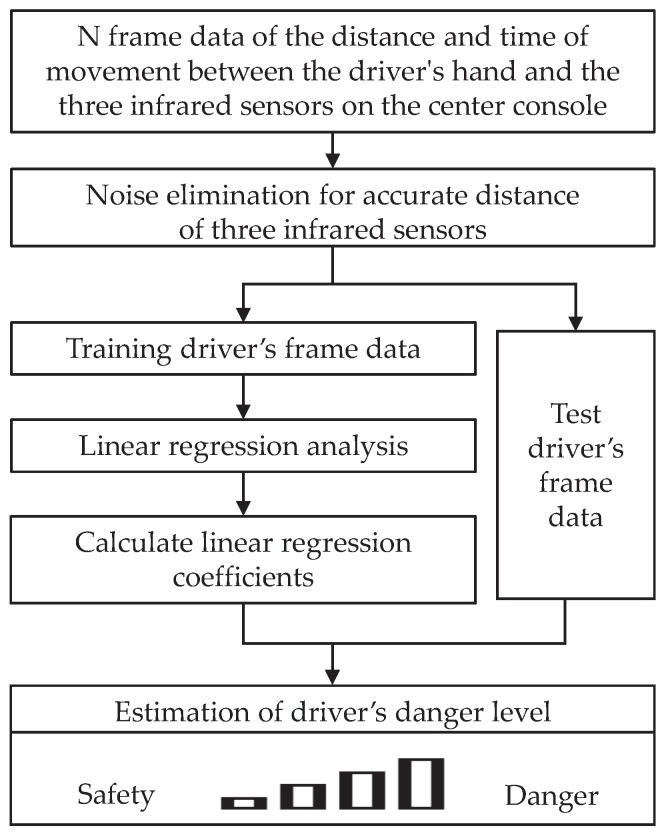
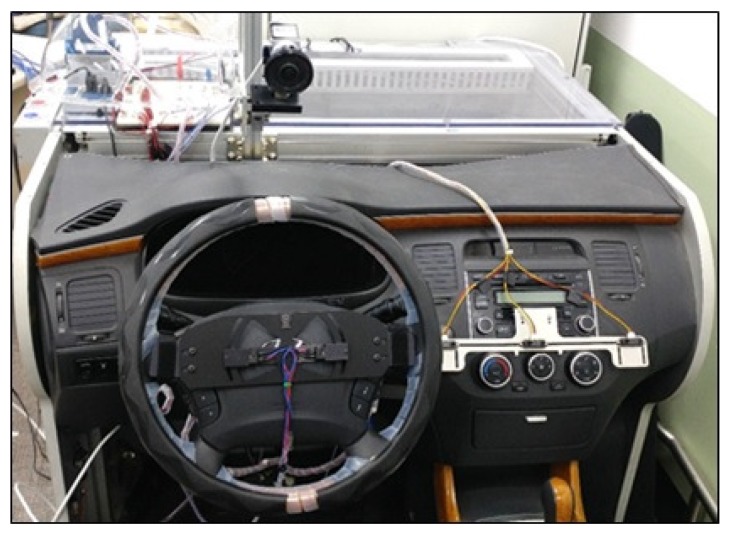
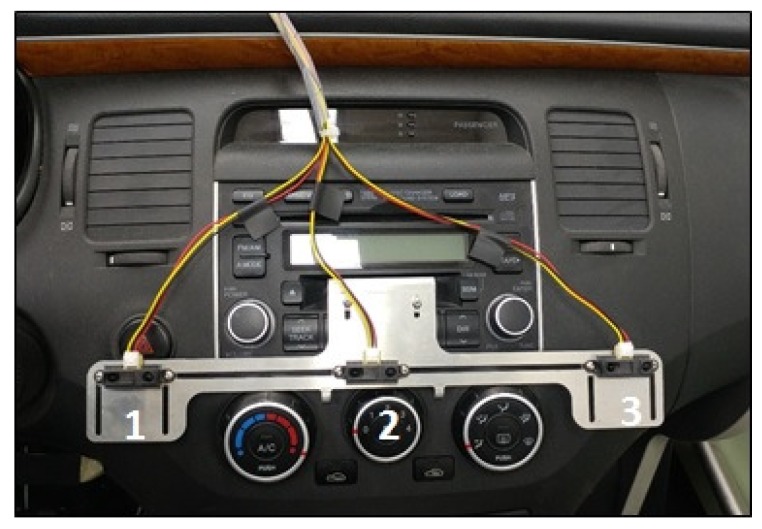
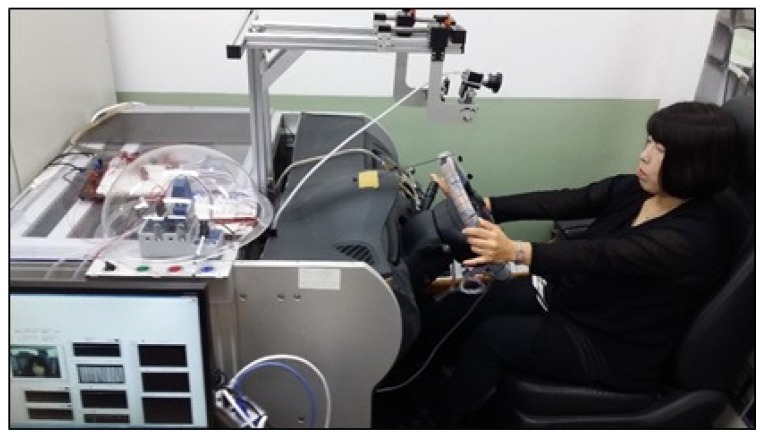
This paper proposes a system for estimating the level of danger when a driver accesses the center console of a vehicle while driving. The proposed system uses a driver monitoring platform to measure the distance between the driver's hand and the center console during driving, as well as the time taken for the driver to access the center console. Three infrared sensors on the center console are used to detect the movement of the driver's hand. These sensors are installed in three locations: the air conditioner or heater (temperature control) button, wind direction control button, and wind intensity control button. A driver's danger level is estimated to be based on a linear regression analysis of the distance and time of movement between the driver's hand and the center console, as measured in the proposed scenarios. In the experimental results of the proposed scenarios, the root mean square error of driver H using distance and time of movement between the driver's hand and the center console is 0.0043, which indicates the best estimation of a driver's danger level.
Keywords: advanced drivers assistance system (ADAS); driver’s danger level; infrared sensor; linear regression analysis.
Conflict of interest statement
The authors declare no conflict of interest.
Figures
Similar articles
-
In a heart beat: Using driver's physiological changes to determine the quality of a takeover in highly automated vehicles.Accid Anal Prev. 2019 Oct;131:180-190. doi: 10.1016/j.aap.2019.06.011. Epub 2019 Jul 11. Accid Anal Prev. 2019. PMID: 31302486
-
Analysis of effects of driver's evasive action time on rear-end collision risk using a driving simulator.J Safety Res. 2021 Sep;78:242-250. doi: 10.1016/j.jsr.2021.06.001. Epub 2021 Jun 15. J Safety Res. 2021. PMID: 34399920
-
Prediction of Driver's Intention of Lane Change by Augmenting Sensor Information Using Machine Learning Techniques.Sensors (Basel). 2017 Jun 10;17(6):1350. doi: 10.3390/s17061350. Sensors (Basel). 2017. PMID: 28604582 Free PMC article.
-
Gaze and Eye Tracking: Techniques and Applications in ADAS.Sensors (Basel). 2019 Dec 14;19(24):5540. doi: 10.3390/s19245540. Sensors (Basel). 2019. PMID: 31847432 Free PMC article. Review.
-
Trends and Future Prospects of the Drowsiness Detection and Estimation Technology.Sensors (Basel). 2021 Nov 27;21(23):7921. doi: 10.3390/s21237921. Sensors (Basel). 2021. PMID: 34883924 Free PMC article. Review.
Cited by
-
A BCI Based Alerting System for Attention Recovery of UAV Operators.Sensors (Basel). 2021 Apr 2;21(7):2447. doi: 10.3390/s21072447. Sensors (Basel). 2021. PMID: 33918116 Free PMC article.
References
-
- Brookhuis K.-A., De Waard D., Janssen W.-H. Behavioural impacts of Advanced Driver Assistance Systems-an overview. Eur. J. Transp. Infrastruct. Res. 2001;1:245–253.
-
- Piao J., McDonald M. Advanced Driver Assistance Systems from Autonomous to Cooperative Approach. Taylor Franc. Gr. Transp. Rev. 2008;28:659–684. doi: 10.1080/01441640801987825. - DOI
MeSH terms
Grants and funding
LinkOut - more resources
Full Text Sources
