

Genetic diversity and population structure analyses of Plectranthus edulis (Vatke) Agnew collections from diverse agro-ecologies in Ethiopia using newly developed EST-SSRs marker system
- PMID: 30309314
- PMCID: PMC6182789
- DOI: 10.1186/s12863-018-0682-z
Genetic diversity and population structure analyses of Plectranthus edulis (Vatke) Agnew collections from diverse agro-ecologies in Ethiopia using newly developed EST-SSRs marker system
Abstract
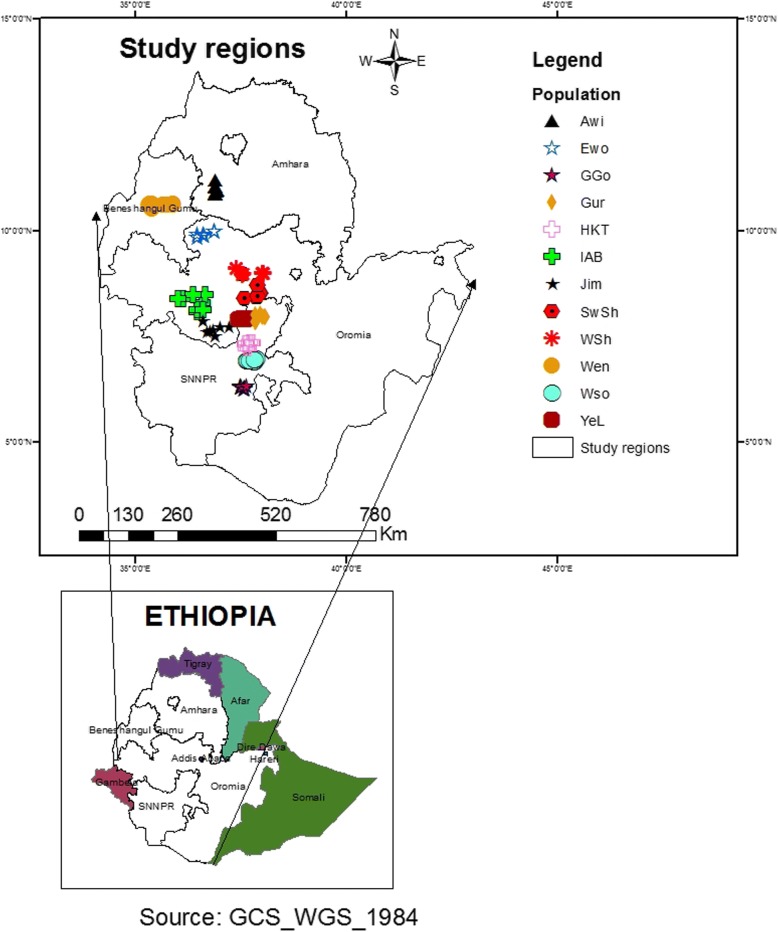
Background: Plectranthus edulis (Vatke) Agnew (locally known as Ethiopian dinich or Ethiopian potato) is one of the most economically important edible tuber crops indigenous to Ethiopia. Evaluating the extent of genetic diversity within and among populations is one of the first and most important steps in breeding and conservation measures. Hence, this study was aimed at evaluating the genetic diversity and population structure of this crop using collections from diverse agro-ecologies in Ethiopia.
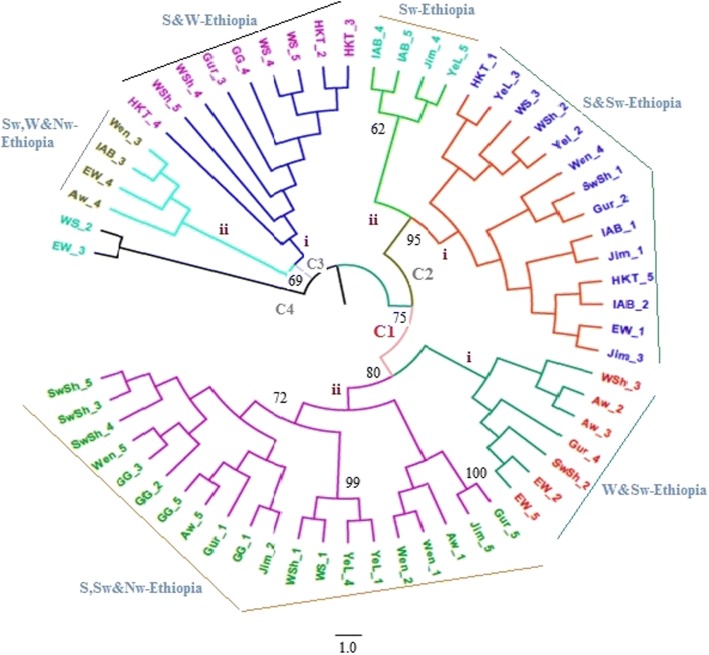
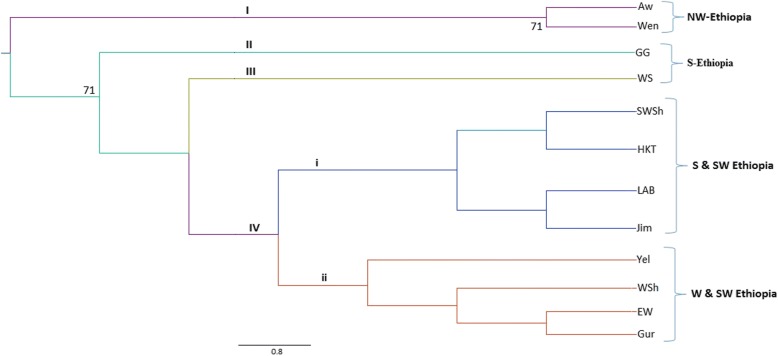
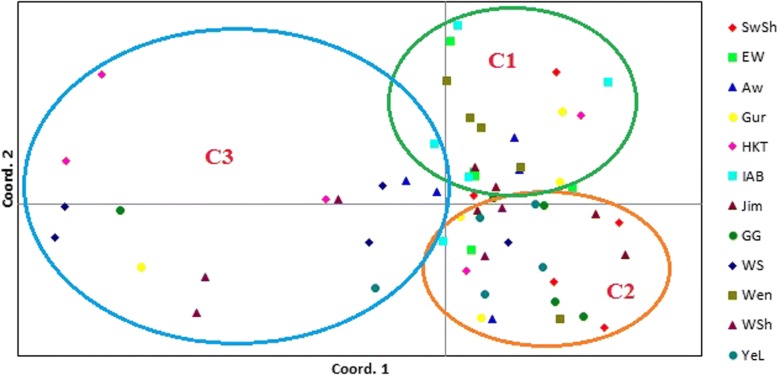
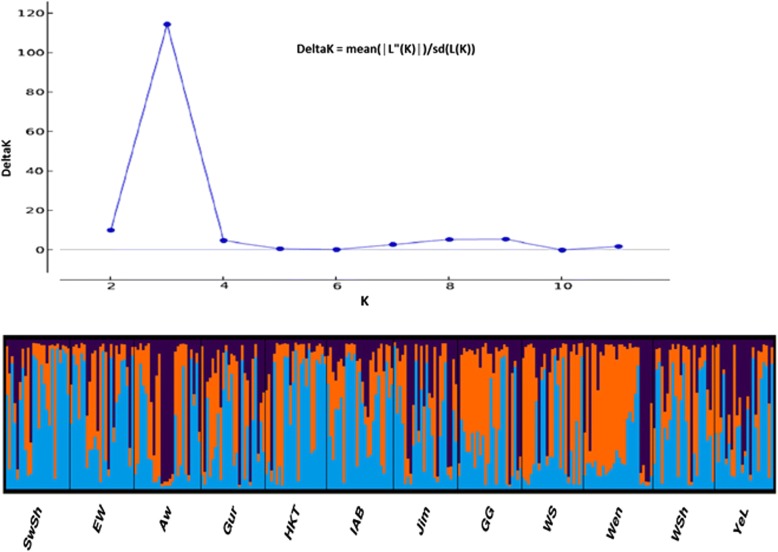
Results: Twenty polymorphic expressed sequence tag based simple sequence repeat (EST-SSRs) markers were developed for P. edulis based on EST sequences of P. barbatus deposited in the GenBank. These markers were used for genetic diversity analyses of 287 individual plants representing 12 populations, and a total of 128 alleles were identified across the entire loci and populations. Different parameters were used to estimate the genetic diversity within populations; and gene diversity index (GD) ranged from 0.31 to 0.39 with overall mean of 0.35. Hierarchical analysis of molecular variance (AMOVA) showed significant but low population differentiation with only 3% of the total variation accounted for variation among populations. Likewise, cluster and STRUCTURE analyses did not group the populations into sharply distinct clusters, which could be attributed to historical and contemporary gene flow and the reproductive biology of the crop.
Conclusions: These newly developed EST-SSR markers are highly polymorphic within P. edulis and hence are valuable genetic tools that can be used to evaluate the extent of genetic diversity and population structure of not only P. edulis but also various other species within the Lamiaceae family. Among the 12 populations studied, populations collected from Wenbera, Awi and Wolaita showed a higher genetic diversity as compared to other populations, and hence these areas can be considered as hot spots for in-situ conservation as well as for identification of genotypes that can be used in breeding programs.
Keywords: Ethiopian dinich; Expressed sequence tags; Genetic diversity; Plectranthus edulis; Population structure; Simple sequence repeats.
Conflict of interest statement
Ethics approval and consent to participate
Not applicable
Consent for publication
Not applicable
Competing interests
The authors declare that they have no competing interests.
Publisher’s Note
Springer Nature remains neutral with regard to jurisdictional claims in published maps and institutional affiliations.
Figures
References
-
- Vavilov NI. The origin, variation, immunity, and breeding of cultivated plants. Cambridge: Cambridge University Press; 1951. pp. 1–387.
-
- Harlan J. Ethiopia: a centre of diversity. Econo Bot. 1996;23:124–132.
-
- Westphal E. Agricultural systems in Ethiopia. Wageningen: Centre for Agricultural Publishing and Documentation; 1975. pp. 1–299.
-
- Zohary D. Centers of diversity and centers of origin. In: Frankle OH, Bennett E, editors. Genetic resources of plants- their exploration and conservation. Oxford: Blackwell; 1970. pp. 33–42.
-
- Mekbib Y, Deressa T. Exploration and collection of root and tuber crops in east Wollega and Ilu Ababora zones: rescuing declining genetic resources. Indian J Trad Know. 2016;15:86–92.
Publication types
MeSH terms
Substances
LinkOut - more resources
Full Text Sources
Research Materials
