. 2018 Oct 11;16(1):113.
doi: 10.1186/s12915-018-0580-x.

Identification of cell types in a mouse brain single-cell atlas using low sampling coverage

Affiliations

Identification of cell types in a mouse brain single-cell atlas using low sampling coverage

Aparna Bhaduri et al. BMC Biol. .

Abstract

Background: High throughput methods for profiling the transcriptomes of single cells have recently emerged as transformative approaches for large-scale population surveys of cellular diversity in heterogeneous primary tissues. However, the efficient generation of such atlases will depend on sufficient sampling of diverse cell types while remaining cost-effective to enable a comprehensive examination of organs, developmental stages, and individuals.

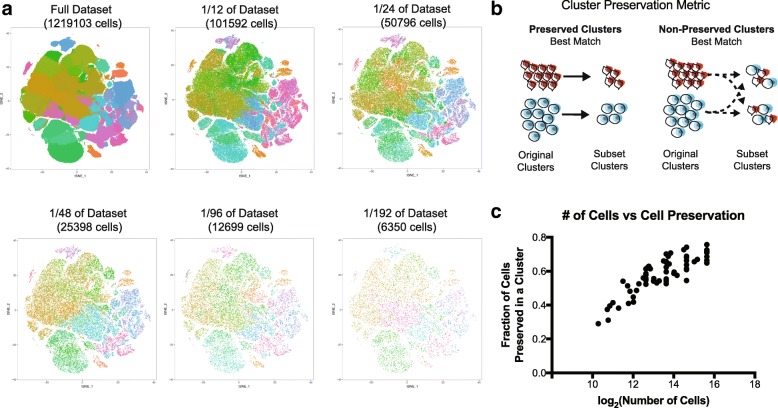
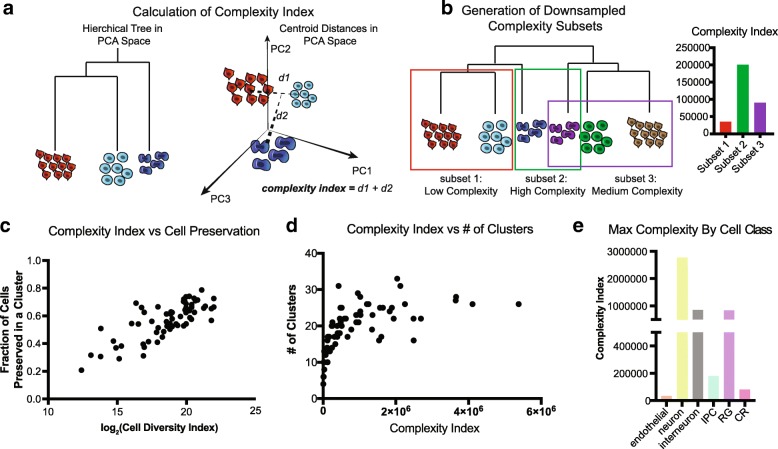
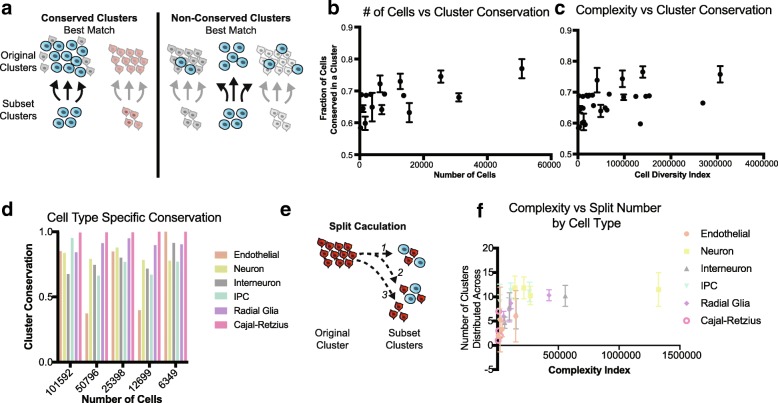
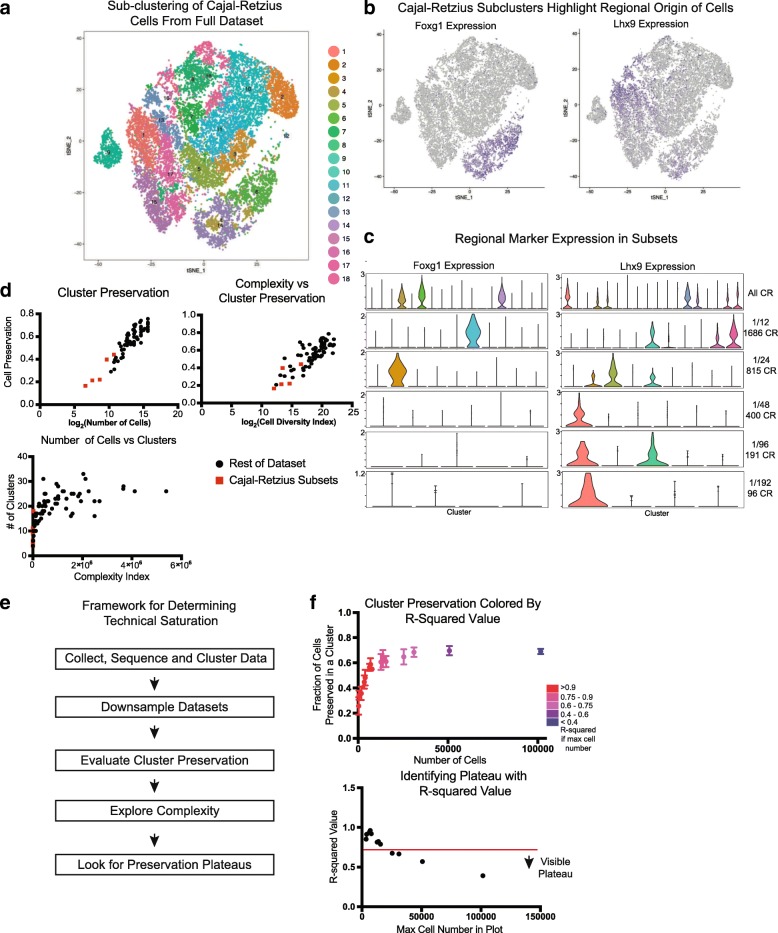
Results: To examine the relationship between sampled cell numbers and transcriptional heterogeneity in the context of unbiased cell type classification, we explored the population structure of a publicly available 1.3 million cell dataset from E18.5 mouse brain and validated our findings in published data from adult mice. We propose a computational framework for inferring the saturation point of cluster discovery in a single-cell mRNA-seq experiment, centered around cluster preservation in downsampled datasets. In addition, we introduce a "complexity index," which characterizes the heterogeneity of cells in a given dataset. Using Cajal-Retzius cells as an example of a limited complexity dataset, we explored whether the detected biological distinctions relate to technical clustering. Surprisingly, we found that clustering distinctions carrying biologically interpretable meaning are achieved with far fewer cells than the originally sampled, though technical saturation of rare populations such as Cajal-Retzius cells is not achieved. We additionally validated these findings with a recently published atlas of cell types across mouse organs and again find using subsampling that a much smaller number of cells recapitulates the cluster distinctions of the complete dataset.

Conclusions: Together, these findings suggest that most of the biologically interpretable cell types from the 1.3 million cell database can be recapitulated by analyzing 50,000 randomly selected cells, indicating that instead of profiling few individuals at high "cellular coverage," cell atlas studies may instead benefit from profiling more individuals, or many time points at lower cellular coverage and then further enriching for populations of interest. This strategy is ideal for scenarios where cost and time are limited, though extremely rare populations of interest (< 1%) may be identifiable only with much higher cell numbers.

Keywords: Bioinformatics; Cell atlas studies; Downsampling; Single-cell analysis.


Conflict of interest statement

Ethics approval and consent to participate

Not applicable

Consent for publication

Not applicable

Competing interests

The authors declare that they have no competing interests.

Publisher’s Note

Springer Nature remains neutral with regard to jurisdictional claims in published maps and institutional affiliations.

Figures

Fig. 1
Fig. 1
Downsampling of cell number preserves major cell type distinctions. a t-SNE plots of the full dataset and five smaller downsampled subsets. Each dataset is shown in the t-SNE space of the full dataset. Clustering was performed independently in every subset. b Cluster preservation is a key metric to evaluate similarities and differences between clusters from different analyses, measuring preservation as a fraction of the original cluster that remains in analyzed subsets. The diagram depicts a simplified cluster preservation calculation (see also the “Methods” section). c Cluster preservation represents the best instance of the fraction of a cluster that is represented during downsampling. Nine original subsets are represented and a total of 56 datapoints are represented; the cell number is shown on a log2 (number of cells) score to improve ease of graph interpretation
Fig. 2
Fig. 2
Downsampling of cell complexity preserves major cell type distinctions. a Cell complexity is calculated in the PCA space of the largest reference cell set analyzed. A hierarchical tree of clusters is calculated for each subset in the PCA space, and the total distance between the branches defines the cell complexity (see also the “Methods” section). b Cell complexity downsampling was performed by selecting branches of a larger tree with varied cell numbers and distances between groups. c Plot of complexity versus cell preservation. Each dot represents a point from 9 original subsets and a total of 56 datasets are analyzed. Log2 (cell diversity index) is used to easily interpret the dots at lower cell diversity numbers. d Number of clusters derived from subset analyses as a function of cell complexity. The graph begins to plateau at a cell complexity of ~ 100,000, suggesting there is a maximal number of clusters that can be derived from a sample even as cell number and complexity increases. e Complexity calculated by cell class annotations show neurons are the most complex of the cell types retrieved
Fig. 3
Fig. 3
Cluster conservation from downsampled datasets. a Cluster conservation is an alternative metric to evaluate similarities and differences between clusters from different analyses, measuring conservation as a fraction of the subset cluster that originates from the same cluster. The diagram depicts a simplified cluster conservation calculation (see also Methods). b Cluster conservation as a function of cell number. Points are averaged within a sample from 56 downsampled subsets. c Cluster conservation as a function of complexity index. Points are averaged within a sample from 56 downsampled subsets. d When grouping clusters by cell type, cluster conservation is nearly perfect for most cell types. e The split of single cluster can be measured by counting the number of clusters that share ≥ 1 cell with either the original or subset cluster, as depicted in the diagram. f Cluster split number of subset clusters as a function of complexity index divided by cell type. Again, a plateau can be seen regardless of cell type around ~ 100,000. More complex cell types are split more, but complexity rather than cell type appears to indicate the number of splits that may occur
Fig. 4
Fig. 4
Downsampling of Cajal-Retzius cells. a t-SNE plot depicting the iterative clustering result of all 20,550 Cajal-Retzius (CR) cells from the full dataset. b Regional origin is a well-studied classifier of CR subtypes, and two of these markers feature prominently in the iteratively clustered dataset: Foxg1 is enriched in three clusters while Lhx9 is enriched in seven clusters. c Violin plots of regional markers in the full datasets and CR subsets of downsampled datasets indicate that these markers are enriched in one more clusters up until 1/24 of the dataset is sampled, after which Foxg1 enrichment is diluted across multiple clusters. Lhx9 enrichment is conserved to even the smallest downsampled subset. One subset for each downsampling is used. d Enrichment metrics of CR cells in the context of previously shown metrics indicate that informatically, saturation of this cell type has not yet been achieved. e Framework to evaluate if technical saturation has been achieved. f Examination of R2 values when incrementally decreasing the number of maximum cells used in the analysis shows that plateau emerges around an R2 value of 0.6

References

    1. Ecker JR, Geschwind DH, Kriegstein AR, Ngai J, Osten P, Polioudakis D, et al. The BRAIN Initiative Cell Census Consortium: lessons learned toward generating a comprehensive brain cell atlas. Neuron. 2017;96(3):542–557. doi: 10.1016/j.neuron.2017.10.007. - DOI - PMC - PubMed
    1. Rozenblatt-Rosen O, Stubbington MJT, Regev A, Teichmann SA. The human cell atlas: from vision to reality. Nature. 2017;550(7677):451–453. doi: 10.1038/550451a. - DOI - PubMed
    1. Macosko EZ, Basu A, Satija R, Nemesh J, Shekhar K, Goldman M, et al. Highly parallel genome-wide expression profiling of individual cells using nanoliter droplets. Cell. 2015;161(5):1202–1214. doi: 10.1016/j.cell.2015.05.002. - DOI - PMC - PubMed
    1. Klein AM, Mazutis L, Akartuna I, Tallapragada N, Veres A, Li V, et al. Droplet barcoding for single-cell transcriptomics applied to embryonic stem cells. Cell. 2015;161(5):1187–1201. doi: 10.1016/j.cell.2015.04.044. - DOI - PMC - PubMed
    1. Han X, Wang R, Zhou Y, Fei L, Sun H, Lai S, et al. Mapping the mouse cell atlas by Microwell-seq. Cell. 2018;173(5):1307. doi: 10.1016/j.cell.2018.05.012. - DOI - PubMed

Publication types