Case Reports
. 2019 Mar;104(3):609-621.
doi: 10.3324/haematol.2018.194233. Epub 2018 Oct 11.

Selective loss of function variants in IL6ST cause Hyper-IgE syndrome with distinct impairments of T-cell phenotype and function

Affiliations
Case Reports

Selective loss of function variants in IL6ST cause Hyper-IgE syndrome with distinct impairments of T-cell phenotype and function

Tala Shahin et al. Haematologica. 2019 Mar.

Abstract

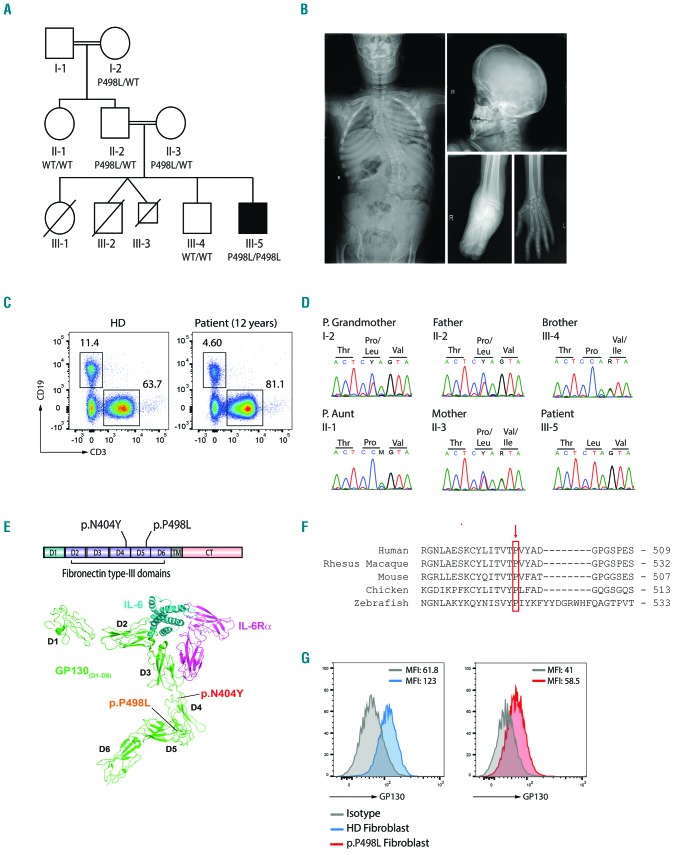
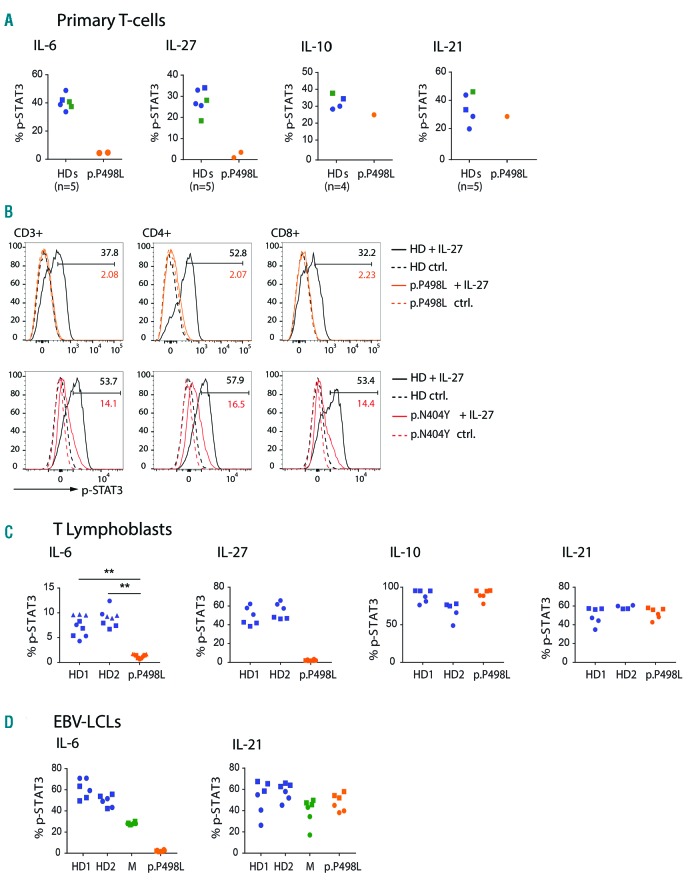
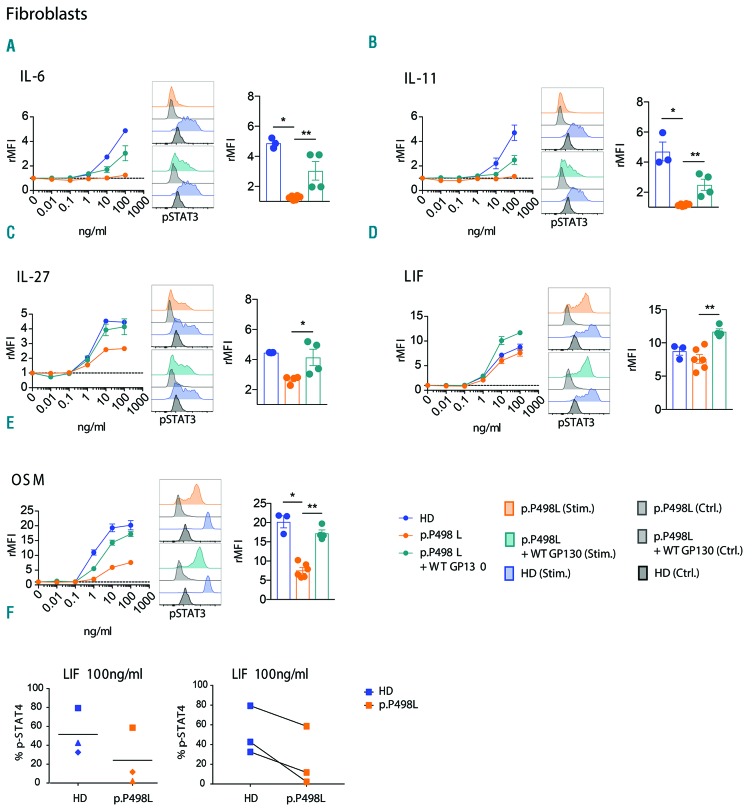
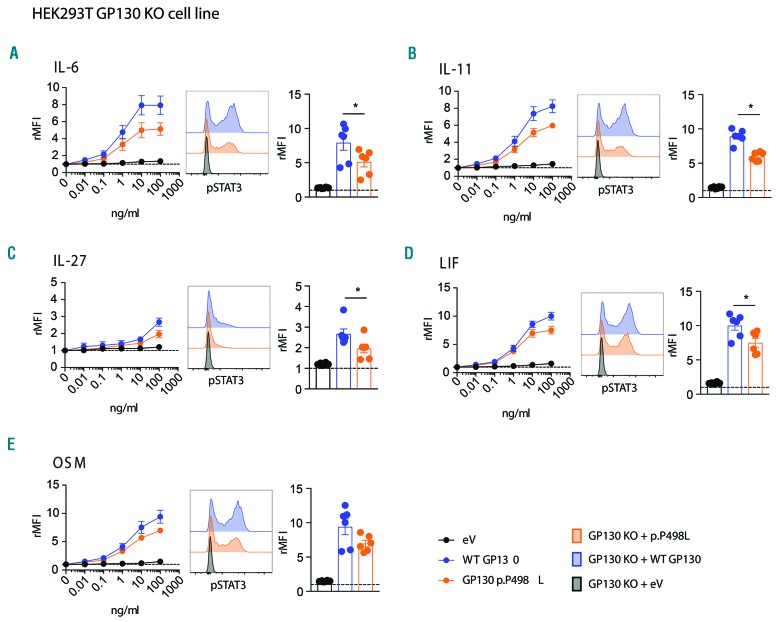
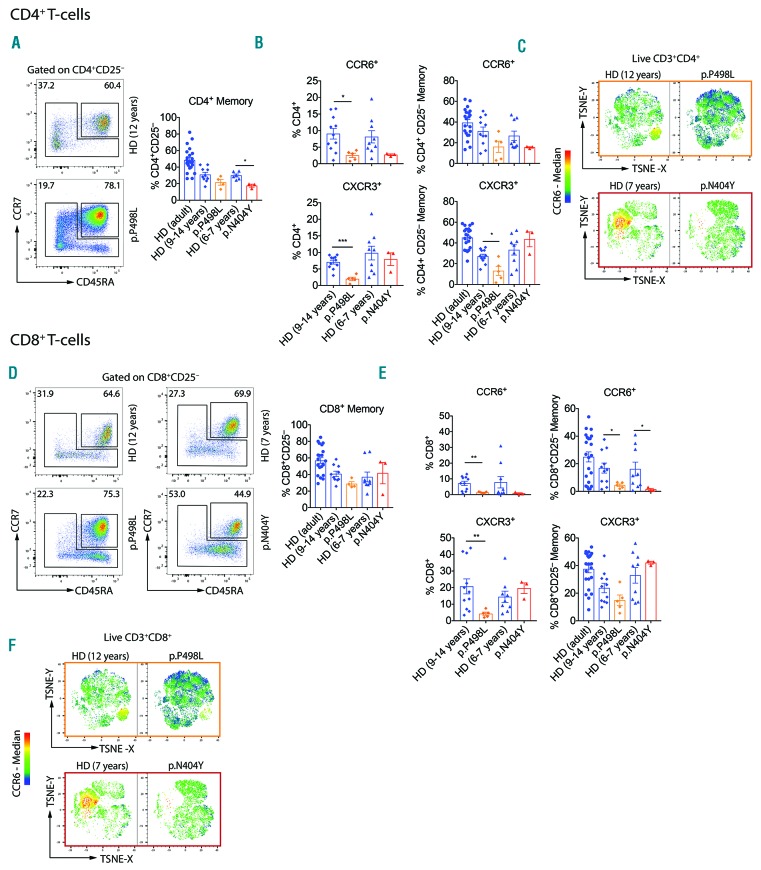
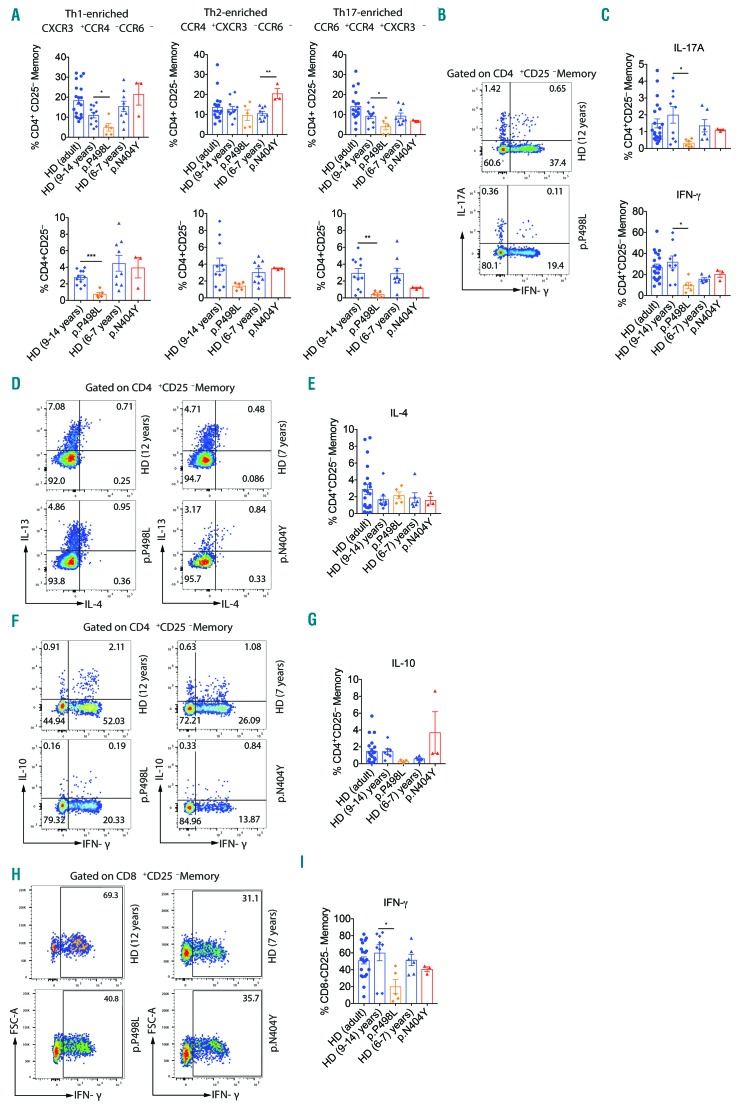
Hyper-IgE syndromes comprise a group of inborn errors of immunity. STAT3-deficient hyper-IgE syndrome is characterized by elevated serum IgE levels, recurrent infections and eczema, and characteristic skeletal anomalies. A loss-of-function biallelic mutation in IL6ST encoding the GP130 receptor subunit (p.N404Y) has very recently been identified in a singleton patient (herein referred to as PN404Y) as a novel etiology of hyper-IgE syndrome. Here, we studied a patient with hyper-IgE syndrome caused by a novel homozygous mutation in IL6ST (p.P498L; patient herein referred to as PP498L) leading to abrogated GP130 signaling after stimulation with IL-6 and IL-27 in peripheral blood mononuclear cells as well as IL-6 and IL-11 in fibroblasts. Extending the initial identification of selective GP130 deficiency, we aimed to dissect the effects of aberrant cytokine signaling on T-helper cell differentiation in both patients. Our results reveal the importance of IL-6 signaling for the development of CCR6-expressing memory CD4+ T cells (including T-helper 17-enriched subsets) and non-conventional CD8+T cells which were reduced in both patients. Downstream functional analysis of the GP130 mutants (p.N404Y and p.P498L) have shown differences in response to IL-27, with the p.P498L mutation having a more severe effect that is reflected by reduced T-helper 1 cells in this patient (PP498L) only. Collectively, our data suggest that characteristic features of GP130-deficient hyper-IgE syndrome phenotype are IL-6 and IL-11 dominated, and indicate selective roles of aberrant IL-6 and IL-27 signaling on the differentiation of T-cell subsets.


Figures

Figure 1.
Figure 1.
Identification of a novel IL6ST variant in PP498L. (A) Pedigree of PP498L showing consanguinity in the family. PP498L has 3 deceased siblings, a sister, and twin brothers [one who died in utero (III-3)], and a brother who has congenital blindness of unknown etiology but is unremarkable for his immune system. PP498L is homozygous for IL6ST c.1493C>T (p.P498L/p.P498L). (B) X-ray images of PP498L showing scoliosis (left), scaphocephaly (top right), edema in the right ankle (bottom center), and flexion contractures of the small joints in the hand (bottom right). (C) Flow cytometry plot illustrating a reduction in CD19+ B cells and normal CD3+ T cells in PBMCs of PP498L at the of age 12.4 years. (D) Sanger sequencing of the identified IL6ST variant (c.1493C>T) in PP498L and family members. (E) Linear representation of GP130 and crystal structure of the GP130-IL6-IL6Rα complex (adapted and modified) outlining the protein domains and the two mutations found in PP498L and the previously described patient (PN404Y ; p.N404Y). D: domains; TM: transmembrane domain; CT: cytoplasmic tail. (F) Conservation of the amino acid proline at position 498 across species including some adjacent amino acids. (G) Flow cytometry analysis of GP130 expression in fibroblasts of PP498L compared to that of a healthy donor. Average of mean fluorescence intensity (MFI) from 2–3 technical replicates is shown on the top right area of the graphs.
Figure 2.
Figure 2.
Functional assessment of GP130P498L variant in primary cells. (A) Assessment of GP130 function by flow cytometry measurement of percentage of p-STAT3 positive cells after stimulation of primary T cells with IL-6 (100 ng/mL), IL-27 (100 ng/mL), IL-10 (50 ng/mL) or IL-21 (100 ng/mL) in PP498L (orange), mother of PP498L (green), and 4 healthy donors (HD: blue; age-matched HDs are represented by circles and adult HDs by squares). (B) Overlayed histograms showing shifts in p-STAT3 signal upon IL-27 stimulation (solid line) and baseline (dotted lines) in CD3+, CD4+ and CD8+ T cells of both PP498L (orange) and PN404Y (red) compared to a HD (black). Values represent percentage of p-STAT3 positive cells. (C and D) Percentage p-STAT3 assessed in (C) T lymphoblasts from PP498L and 2 HDs and in (D) Epstein-Barr virus-transformed lymphoblastoid cell lines (EBV-LCLs) from PP498L, mother of PP498L and 2 HDs after stimulation with IL-6 (100 ng/mL), IL-10 (50 ng/mL), IL-21 (100 ng/mL), or IL-27 (100 ng/mL). Data shown are from 2–3 independent experiments (shown by different data point shapes) with 2–3 replicates each. Statistical analysis on IL-6 stimulation of T lymphoblasts (3 independent experiments) was performed using an unpaired two-tailed Student t-test on the means of the technical replicates. **P<0.01, n=3.
Figure 3.
Figure 3.
Functional assessment of GP130P498L variant in fibroblasts. (A–E) Dose-escalation curves showing relative mean fluorescence intensity (rMFI) of p-STAT3 after stimulation of PP498L and healthy donor (HD) fibroblasts as well as PP498L fibroblasts transduced with wild-type (WT) GP130 with (A) IL-6, (B) IL-11, (C) IL-27, (D) LIF, (E) OSM, following overnight starvation in serum-free media. Bar graphs (right) showing rMFI of fibroblasts upon stimulation with the highest concentration of the corresponding cytokine: 3 (HD), 6 (p.P498L) and 4 (p.P498L + WT GP130) replicates of 3 independent experiments; Mann-Whitney-test; *P<0.05, **P<0.01. (F) Percentage of p-STAT4 assessed in PP498L and HD-derived fibroblasts after stimulation with LIF (100 ng/mL) following a 3-hour starvation in serum-free media. Three independent experiments were performed; the shapes of the symbols represent the individual experiments.
Figure 4.
Figure 4.
Functional assessment of GP130P498L variant in GP130-KO HEK293 cell line. (A-E) Relative mean fluorescence intensity (rMFI) of p-STAT3 in GP130 CRISPR-knockout HEK293 cells that were transfected with a plasmid coding for the GP130P498L (GP130 KO + p.P498L), wild-type GP130 (GP130 KO + WT GP130) or transfected with the empty plasmid (GP130 KO + eV), after stimulation with (A) IL-6, (B) IL-11, (C) IL-27, (D) LIF, (E) OSM. From left to right: dose-escalation curves, stacked histograms displaying shifts in p-STAT3 signals, and bar graphs showing rMFI of fibroblasts upon stimulation with the highest concentration of the corresponding cytokine. (6 replicates of 3 independent experiments are shown; Wilcoxon matched-pairs signed rank test; *P<0.05.)
Figure 5.
Figure 5.
Phenotypic characterization of CD4+ and CD8+ T-cell compartments. (A and D) Representative dot-plot and bar graph summary showing percentages of (A) CD4+ and (D) CD8+ naïve (CD45RA+CCR7+) and memory [CD45RACCR7+/− including CD45RA+CCR7 terminally differentiated effector memory (TEMRA)] cells shown as frequency of live CD3+CD4+CD25 or CD3+CD8+CD25 T cells, respectively. (B and E) Bar graph summary showing CXCR3+ and CCR6+ frequencies of live (B) CD3+CD4+ and (E) CD3+CD8+ cells, and as frequencies of live (B) CD3+CD4+CD25 and (E) CD3+CD8+CD25 memory T cells. (C and F) t-Distributed Stochastic Neighbor Embedding (TSNE)-based analysis was performed on the following parameters: CD45RA, CD25, CD127, CCR4, CCR6, CCR7, CCR9, CCR10, CXCR3, CXCR5 and CRTh2. Overlaid heatmap statistics indicate median CCR6 expression in (C) live CD3+CD4+CD8 and (F) CD3+CD8+CD4 T cells. Bar graph summaries: mean+Standard Deviation: healthy donor (HD) (adult): n=19, HD age-matched controls (9–14 years): n=10–11, HD age-matched controls (6–7 years): n=6–9, PP498L: n=5 independent replicates from peripheral blood mononuclear cells (PBMCs) isolated at 3 distinct time points, seven and four months apart, PN404Y: n=3 replicates from 2 independent experiments and PBMCs taken two months apart. Mann-Whitney test, *P<0.05; **P<0.01; ***P<0.001; ****P<0.0001. Some HD control data shown have been published previously.
Figure 6.
Figure 6.
Functional characterization of CD4+ and CD8+ T cells with transcription factor expression analysis. (A) Flow cytometry analysis of frequencies of Th-cell subtype-enriched compartments based on chemokine receptor expression as percent of live CD3+CD4+CD25 T cells or CD3+CD4+CD25 memory T cells: CXCR3+CCR4CCR6 (Th1-enriched), CCR4+CXCR3CCR6 (Th2-enriched) and CCR6+CCR4+CXCR3 (Th17-enriched). (B and C) Dot-plot presentation (B) and summary (C) of intracellular cytokine staining (ICCS) for IFN-γ and IL-17A shown as percent of live CD3+CD4+CD25 memory T cells from PP498L. (D and E) Dot-plot presentation (D) and summary (E) of ICCS for IL-4 and/or IL-13 shown as percent of live CD3+CD4+CD25 memory T cells from PP498L and PN404Y. (F and G) Dot-plot presentation (F) and summary(G) of ICCS for IFN-γ and/or IL-10 shown as percent of live CD3+CD4+CD25 memory T cells from PP498L and PN404Y (H and I) Dot-plot presentation (H) and summary (I) of ICCS for IFN-γ shown as percent of live CD3+CD8+CD25 memory T cells from PP498L and PN404Y. Bar graph summaries: mean+Standard Deviation (SD): healthy donor (HD) (adult): n=19, HD age-matched controls (9–14 years): n=7–11, HD age-matched controls (6–7 years): n=6–9, PP498L: n=5 independent replicates from peripheral blood mononuclear cells (PBMCs) isolated at 3 distinct time points, seven and four months apart, PN404Y: n=3 replicates from 2 independent experiments and PBMCs taken five months apart. Mann-Whitney test; *P<0.05; **P<0.01; ***P<0.001; ****P<0.0001. Some HD control data shown have been published previously.

References

    1. Grimbacher B, Holland SM, Gallin JI, et al. Hyper-IgE Syndrome with Recurrent Infections — An Autosomal Dominant Multisystem Disorder. N Engl J Med. 1999; 340(9):692–702. - PubMed
    1. Grimbacher B, Holland SM, Puck JM. Hyper-IgE syndromes. Immunol Rev. 2005; 203(1):244–250. - PubMed
    1. Holland SM, DeLeo FR, Elloumi HZ, et al. STAT3 Mutations in the Hyper-IgE Syndrome. N Engl J Med. 2007;357(16): 1608–1619. - PubMed
    1. Minegishi Y, Saito M, Tsuchiya S, et al. Dominant-negative mutations in the DNA-binding domain of STAT3 cause hyper-IgE syndrome. Nature. 2007;448(7157):1058–1062. - PubMed
    1. Schwerd T, Twigg SRF, Aschenbrenner D, et al. A biallelic mutation in IL6ST encoding the GP130 co-receptor causes immunodeficiency and craniosynostosis. J Exp Med. 2017;214(9):2547–2562. - PMC - PubMed

Publication types

MeSH terms