. 2018 Oct 12;362(6411):eaau6348.
doi: 10.1126/science.aau6348.

Thyroid hormone signaling specifies cone subtypes in human retinal organoids

Affiliations

Thyroid hormone signaling specifies cone subtypes in human retinal organoids

Kiara C Eldred et al. Science. .

Abstract

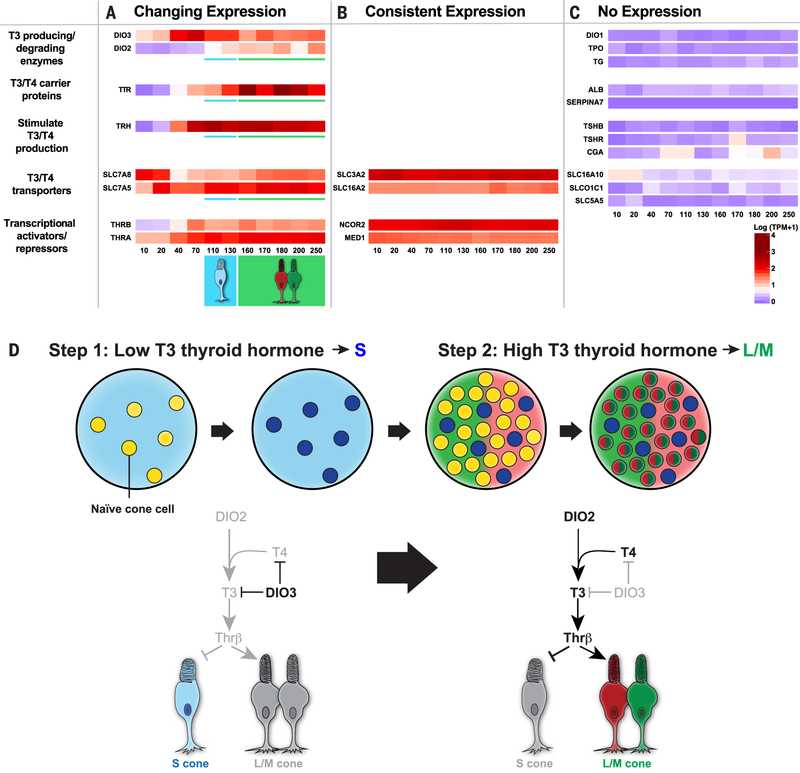
The mechanisms underlying specification of neuronal subtypes within the human nervous system are largely unknown. The blue (S), green (M), and red (L) cones of the retina enable high-acuity daytime and color vision. To determine the mechanism that controls S versus L/M fates, we studied the differentiation of human retinal organoids. Organoids and retinas have similar distributions, expression profiles, and morphologies of cone subtypes. S cones are specified first, followed by L/M cones, and thyroid hormone signaling controls this temporal switch. Dynamic expression of thyroid hormone-degrading and -activating proteins within the retina ensures low signaling early to specify S cones and high signaling late to produce L/M cones. This work establishes organoids as a model for determining mechanisms of human development with promising utility for therapeutics and vision repair.


Figures

Fig. 1.
Fig. 1.. S and L/M cone generation in human retinal organoids.
(A) Decision between S and L/M cone subtype fate. (B and C) S-opsin (blue) and L/M-opsin (green). (B) Human adult retina age 53. (C)iPSC-derived organoid, day 200 of differentiation. (D to K) Bright-field images of organoids derived from iPSCs. (D) Undifferentiated iPSCs. (E) Day 1, aggregation. (F) Day 4, formation of neuronal vesicles. (G) Day 8, differentiation of retinal vesicles. (H) Day 12, manual isolation of retinal organoid. (I) Day 43, arrow indicates developing retinal tissue, and arrowhead indicates developing retinal pigment epithelium. (J) Day 199, arrow indicates outer segments. (K) Day 330, arrow indicates outer segments.
Fig. 2.
Fig. 2.. Human cone subtype specification is recapitulated in organoids.
(A to K) S-opsin (blue) and L/M-opsin (green) were examined in human iPSC-derived organoids [(A), (C) to (E), and (G) to (M)] and human retinas [(B), (D), (F), and (H)]. [(A) to (C) and (E) to (G)] Arrows indicate outer segments, solid arrowheads indicate inner segments, and open arrowheads indicate nuclei. [(A) and (E)] CRX (a general marker of photoreceptors) is expressed in S cones and L/M cones. [(B) to (D)] S cones display short outer segments and thin inner segments in both human retinas and organoids. [(F) to (H)] L/M cones display long outer segments and wide inner segments in both human retinas and organoids. [(D) and (H)] Quantification of outer segment lengths and inner segment widths (adult retina, L/M, n = 13 cones, S, n = 10 cones; organoid, L/M, n = 35 cones, S, n = 42 cones). [(I) to (N)] S cones are generated before L/M cones in organoids. (L) Ratio of S:L/M cones during organoid development. (M) Density of S and L/M cones during organoid development. (N) S-opsin expression precedes L/M-opsin expression in human iPSC-derived organoids. CRX expression starts before opsin expression. TPM, transcripts per kilobase million.
Fig. 3.
Fig. 3.. Thyroid hormone signaling is necessary and sufficient for the temporal switch between S and L/M fate specification.
(A to K) S-opsin (blue) and L/M-opsin (green) were examined in human ESC-derived organoids. (A) Wild-type (WT). (B) Thrβ2 early termination mutant (Thrβ2 KO). (C) Quantification of (A) and (B) (WT, n = 3 organoids; Thrβ2 KO, n = 3 organoids). (D) WT. (E) Thrβ KO. (F) WT treated with 20 nM T3 (WT + T3). (G) Thrβ KO treated with 20 nM T3 (Thrβ KO + T3). (H) Quantification of (D) to (G) (WT, n = 9 organoids; Thrβ KO, n = 3 organoids; WT + T3, n = 6 organoids; Thrβ KO + T3, n = 3 organoids. Tukey’s multiple comparisons test: WT versus Thrβ KO, P < 0.0001; WT versus WT + T3, P < 0.01; WT + T3 versus Thrβ KO + T3, P < 0.0001). (I) Length of outer segments. WT, L/M n = 66 cells; WT, S n = 66 cells; Thrβ KO, n = 50 cells (Tukey’s multiple comparisons test, WT L/M versus WT S, P < 0.0001; WT L/M versus Thrβ KO, P < 0.0001; WT S versus Thrβ KO, not significantly different). (J) Width of inner segments. WT, L/M n = 78 cells; WT, S n = 78 cells; Thrβ KO, n = 118 cells (Tukey’s multiple comparisons test, WT L/M versus WT S, P < 0.0001; WT L/M versus Thrβ KO, P < 0.0001; WT S versus Thrβ KO, not significantly different). (K) T3 acts through Thrβ to increase total cone number. Quantification of density of S and L/M cones; WT, n = 6 organoids; Thrβ KO, n = 3 organoids; WT + T3, n = 3 organoids; Thrβ KO + T3, n = 3 organoids (Tukey’s multiple comparisons test between total cone numbers, WT versus Thrβ KO, not significantly different; WT versus WT + T3, P < 0.01; WT + T3 versus Thrβ KO + T3, P < 0.0001).
Fig. 4.
Fig. 4.. Dynamic expression of thyroid hormone signaling regulators during development.
(A to C) Heat maps of log(TPM + 1) values for genes with (A) changing expression, (B) consistent expression, and (C) no expression. Numbers at the bottom of heat maps indicate organoid age in days. (D) Model of the temporal mechanism of cone subtype specification in humans. For simplicity, only the roles of DIO3 and DIO2 are illustrated. In step 1, expression of DIO3 degrades T3 and T4, leading to S cone specification. In step 2, expression of DIO2 converts T4 to T3 to signal Thrβ to repress S and induce L/M cone fate.

Similar articles

Cited by

References

    1. Viets K, Eldred K, Johnston RJ Jr., Mechanisms of photoreceptor patterning in vertebrates and invertebrates. Trends Genet 32, 638–659 (2016). doi: 10.1016/j.tig.2016.07.004; pmid: - DOI - PMC - PubMed
    1. Nathans J, Thomas D, Hogness DS, Molecular genetics of human color vision: The genes encoding blue, green, and red pigments. Science 232, 193–202 (1986). doi: 10.1126/science.2937147; pmid: - DOI - PubMed
    1. Vollrath D, Nathans J, Davis RW, Tandem array of human visual pigment genes at Xq28. Science 240, 1669–1672 (1988). doi: 10.1126/science.2837827; pmid: - DOI - PubMed
    1. Wang Y et al., A locus control region adjacent to the human red and green visual pigment genes. Neuron 9, 429–440 (1992). doi: 10.1016/0896-6273(92)90181-0; pmid: - DOI - PubMed
    1. Smallwood PM, Wang Y, Nathans J, Role of a locus control region in the mutually exclusive expression of human red and green cone pigment genes. Proc. Natl. Acad. Sci. U.S.A 99, 1008–1011 (2002). doi: 10.1073/pnas.022629799; pmid: - DOI - PMC - PubMed

Publication types

Substances