. 2018 Oct 30;115(44):E10333-E10341.
doi: 10.1073/pnas.1802934115. Epub 2018 Oct 11.

Ultrafast epithelial contractions provide insights into contraction speed limits and tissue integrity

Affiliations

Ultrafast epithelial contractions provide insights into contraction speed limits and tissue integrity

Shahaf Armon et al. Proc Natl Acad Sci U S A. .

Abstract

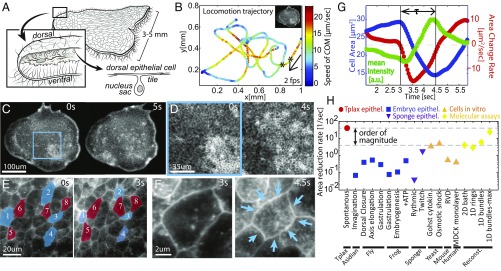
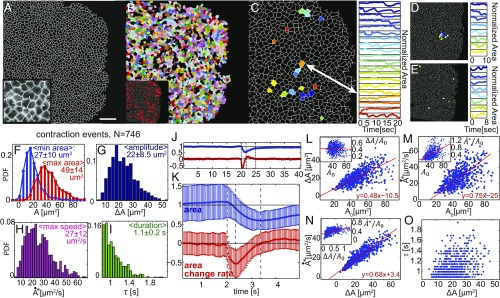
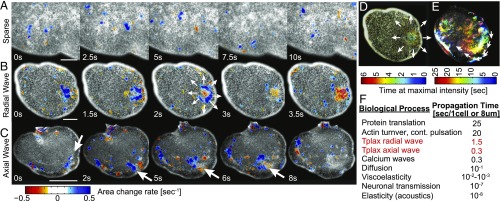
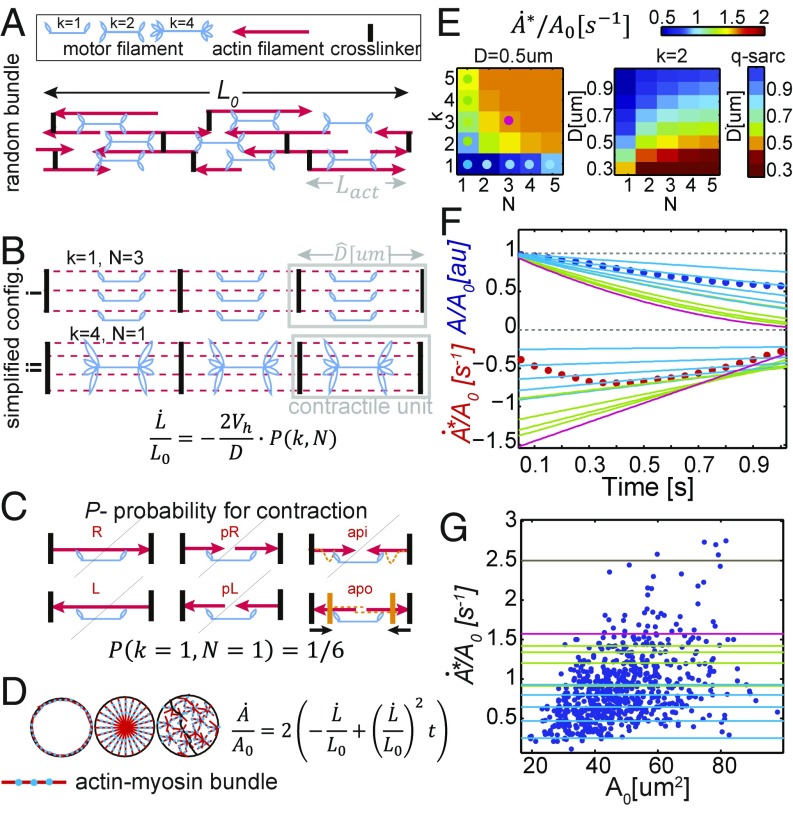
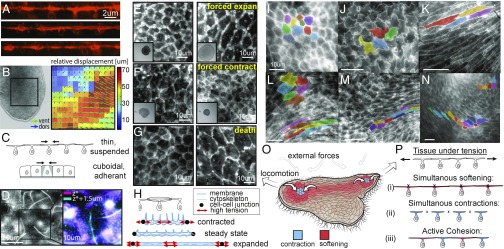
By definition of multicellularity, all animals need to keep their cells attached and intact, despite internal and external forces. Cohesion between epithelial cells provides this key feature. To better understand fundamental limits of this cohesion, we study the epithelium mechanics of an ultrathin (∼25 μm) primitive marine animal Trichoplax adhaerens, composed essentially of two flat epithelial layers. With no known extracellular matrix and no nerves or muscles, T. adhaerens has been claimed to be the "simplest known living animal," yet is still capable of coordinated locomotion and behavior. Here we report the discovery of the fastest epithelial cellular contractions known in any metazoan, to be found in T. adhaerens dorsal epithelium (50% shrinkage of apical cell area within one second, at least an order of magnitude faster than other known examples). Live imaging reveals emergent contractile patterns that are mostly sporadic single-cell events, but also include propagating contraction waves across the tissue. We show that cell contraction speed can be explained by current models of nonmuscle actin-myosin bundles without load, while the tissue architecture and unique mechanical properties are softening the tissue, minimizing the load on a contracting cell. We propose a hypothesis, in which the physiological role of the contraction dynamics is to resist external stresses while avoiding tissue rupture ("active cohesion"), a concept that can be further applied to engineering of active materials.

Keywords: biomechanics; cell contractility; epithelium; metazoan evolution; tissue integrity.


Conflict of interest statement

The authors declare no conflict of interest.

Figures

Fig. 1.
Fig. 1.
Contraction dynamics in T. adhaerens dorsal epithelium (TADE) at all scales. (A) T. adhaerens consists mostly of two flat cell layers of dorsal and ventral epithelia. The dorsal cell tiles are flat with junctions to neighboring cells (SI Appendix, Supplementary Text 1). (B) An example trajectory of an animal’s center of mass, registered while it is freely crawling in 2D and physically tracked for 10 min. The imaging, tracking, and plotting rate is 2 fps. Color represents momentary velocity in the horizontal plane. Inset depicts the relative organism size. The segment between the two asterisks corresponds to the images in C. (CF) Live imaging of TADE across different length scales, from all cells to a single cell. CMO is used as a live membrane stain. (C and D) Snapshots from a low magnification movie (Movie S4): Cells with smaller sizes are seen brighter due to an increased fluorescent signal. Spatiotemporal patterns are seen in time scales of a few seconds. (E) Snapshots from a high magnification movie (Movie S5): Contraction events are mostly asynchronous, though correlated to neighboring expansions, as the tissue is always kept intact. Cells labeled blue were contracting and those labeled red were expanding in the shown time interval. (F) A single-cell contraction (Movie S5, Top Right). (G) Dynamical measures of the single contraction event in F, after computational segmentation of the cell’s apical area. The overall area reduction in this event is 50% from initial area, and the contraction duration, τ, is 1.5 s. The average pixel intensity increases proportionally to the area reduction. (H) Comparative chart of data from literature reporting epithelium contraction speeds across the animal kingdom and other relevant contraction speeds (citations and comments in SI Appendix, Supplementary Text 2).
Fig. 2.
Fig. 2.
Individual contraction statistics. (A) A single frame from a 1-min-long movie of a live animal. Computational segmentation finds roughly 2,000 dorsal epithelial cells in a frame (Movie S6). (Scale bar: 50 μm.) (Inset) Zoom-in shows quality of segmentation on top of the original image. (B) Postsegmentation, individual cells are marked (color) if they have been tracked for more than 2 s. (Inset) Labeled red are all cells that were identified to be contracting sometime during the 1-min movie. (Magnification: A, Inset, 2×; B, Inset is same FOV as B.) (C) Twenty cells that were tracked for the longest durations and their apical area dynamics with time. Color represents cell identity both in the locations map and in the area profiles plot. Area is normalized to be a fraction from maximal area. (D) Eight neighboring cells and their normalized area dynamics. Color represents cell identity. (E) Eight cells that were undergoing contraction at the same time and their following dynamics. (D and E, Left are the same FOV as C.) (FI) Statistical distributions of the 746 contraction events found in all cell trajectories: initial and final areas (A), contraction amplitude (ΔA=AmaxAmin), peak speed (A˙*), and event duration (τ). (J) Aligning all contraction events in time, and normalizing to initial area, we plot the average dynamics of a cell area [(A(t)/A0)], in blue and area change rate (A(t)A(t1))/A(t), in red. (K) Zoomed-in view of J. Error bars are the variance within the different events in a given time point. (LO) Correlation plots depict that contraction amplitude and speed are positively correlated to initial cell size and to each other, while duration of the contraction event is independent. Each data point shown is a single contraction event.
Fig. 3.
Fig. 3.
Contractility patterns. (AC) Examples of common contractile patterns seen in TADE (Movies S2–S4). The raw image is underlying a color representation of the divergence field calculated using PIV. Blue range represents negative divergence (i.e., contraction); red range is positive divergence (expansion). Low values of both contraction and expansion are excluded, for clarity. Since contractions are faster than expansions, red spots are less common. White arrows mark a propagation of a contraction wave. (A) Sparse contractions of mostly individual cells. (Scale bar: 40 μm.) (B) A radially propagating contraction wave that starts at the bulk of the tissue and propagates in all directions. (Scale bar: 100 μm.) (C) A uniaxially propagating contraction wave that initially follows the animal rim and then disperses into the bulk. (Scale bar: 200 μm.) (D and E) The same events as in B and C presented in a color-time technique, similar to maximal intensity projection (Methods). (D and E, Upper show same FOV as B.) (F) Characteristic time scales for different cell–cell signaling mechanisms. Citations and comments are provided in SI Appendix, Supplementary Text 2.
Fig. 4.
Fig. 4.
TADE ultrafast contraction speed can be explained by nm-myosin II actuation on random actin bundles under minimal load. (A) A randomly polarized actomyosin bundle. Red arrows represent actin filaments. Arrow points at barbed end. (B) Simplified configurations of random bundles, using the bundle-averaged parameters: D, distance between crosslinkers, N, number of actins connected in parallel, and k, number of connected motor head pairs in a single motor filament. Under our assumptions, such bundles will yield constant shrinking speed L˙ as in the underlying equation. (C) Visualization of all microstates possible for a motor filament in a random bundle with k = N = 1. The microstates are named after the connected actin polarization: left, right, parallel-left, parallel-right, antiparallel-in, and antiparallel-out. According to the buckling model, only one of these states will yield contraction, hence the probability for this unit to contract (denoted by P) is 1/6 (yellow lines represent the state after motor actuation). (D) Assuming circular cells, all 1D bundle geometries (depicted in dashed red/blue lines) with no load will yield the same area contraction speed A˙(t) as in the underlying equation. (E) Phase diagrams of the peak area reduction speed (A˙*) as a function of k, N, and D, assuming the buckling model and the quasisarcomeric model. Colored dots represent parameter sets that we use in the following panels. (F and G) Experimental results (circles) compared with our model predictions for nm-myosin II (lines). Line color represents the bundle parameters, as depicted in dots on E. (F) Area and area change rate as a function of time. Circles are the average data from Fig. 2K. Using a very feasible parameter set (magenta), the model predicts higher speeds than our measurements. (G) Normalized peak contraction speed as a function of initial cell area. Circles are data from Fig. 2M, Inset. The black line is the fundamental limit of speed in our model (P = 1, D = length of myosin II motor). The vast majority of the events (n = 741) can be explained by the model in the shown parameter regime.
Fig. 5.
Fig. 5.
TADE unique and active mechanical properties. (A) Live cross-sections (XZ plane) of TADE, reconstructed from confocal Z stacks. Membranes are labeled with CMO. The cells unique T shape is seen, as well as membrane tubes on the apical surface. (B, Left) A snapshot from a movie that shows the animal’s dorsal and ventral epithelia moving independently (Movie S8). (B, Right) Optical plane separation analysis shows relative displacement between epithelia reaching 70 μm (∼10 cells) in 1 s. (C) A sketch comparing a single contraction in a thin, suspended tissue and in a cuboidal, adherent one (see model in SI Appendix, Supplementary Text 5). (D) A top view of live TADE stained with CMO shows membrane tubes. (Right) Zoom-in on a single cell, and stacking of the cell borders plane (magenta) and the excursing tubes plane (cyan). (EG) TADE capability of extreme variation in cell size: (E) Applying compression in the Z direction on the animal results in 200–350% expansion in dorsal cell size before the first visible tear. (Inset) Whole animal view, FOV: 1.5 mm. (F) Treatment with ionomycin causes immediate contraction of all dorsal cells to ∼50% within a few seconds (Movie S9). (Inset) Whole animal view, FOV: 1.5 mm. (G) An animal left to die in the imaging chamber expanded its dorsal cell area by 400–700%. (H) Our hypothetical free body diagrams of a dorsal cell during contraction, expansion, and steady states. Red arrows mark regions of high tension and potential rupture (either membrane, cytoskeleton, or cell junctions). (IN) Examples of variable TADE shapes in vivo: polygonal (I), wobbly (J), striated (K), elliptic/amorphic (L, Top Left). These shapes are commonly found in close proximity in space and change rapidly in time (LN, Movie S10), implying local variability of stiffness. (O) A sketch of the animal from a top view, during locomotion. Color represents our hypothetical view of cells increasing (blue) or decreasing (red) their stiffness, and hence their shape, according to different patterns of external stress. (P) Schematics of possible scenarios in cellular sheets under tension: (i) Cell expansion due to softening may lead to cell rupture. (ii) Simultaneous contractions under the external constraint may lead to junctions’ detachment. (iii) The active cohesion hypothesis suggests active protection against the two rupture modes by asynchronous contractions and expansions, activated according to distinct, local mechanical cues.

References

    1. Martin AC, Kaschube M, Wieschaus EF. Pulsed contractions of an actin-myosin network drive apical constriction. Nature. 2009;457:495–499. - PMC - PubMed
    1. Solon J, Kaya-Copur A, Colombelli J, Brunner D. Pulsed forces timed by a ratchet-like mechanism drive directed tissue movement during dorsal closure. Cell. 2009;137:1331–1342. - PubMed
    1. Maître J-L, Niwayama R, Turlier H, Nédélec F, Hiiragi T. Pulsatile cell-autonomous contractility drives compaction in the mouse embryo. Nat Cell Biol. 2015;17:849–855. - PubMed
    1. Wozniak MA, Chen CS. Mechanotransduction in development: A growing role for contractility. Nat Rev Mol Cell Biol. 2009;10:34–43. - PMC - PubMed
    1. Paré AC, et al. A positional toll receptor code directs convergent extension in Drosophila. Nature. 2014;515:523–527. - PMC - PubMed