. 2018 Dec;178(4):1657-1678.
doi: 10.1104/pp.18.01053. Epub 2018 Oct 11.

K+ Efflux Antiporters 4, 5, and 6 Mediate pH and K+ Homeostasis in Endomembrane Compartments

Affiliations

K+ Efflux Antiporters 4, 5, and 6 Mediate pH and K+ Homeostasis in Endomembrane Compartments

Xiaojie Zhu et al. Plant Physiol. 2018 Dec.

Abstract

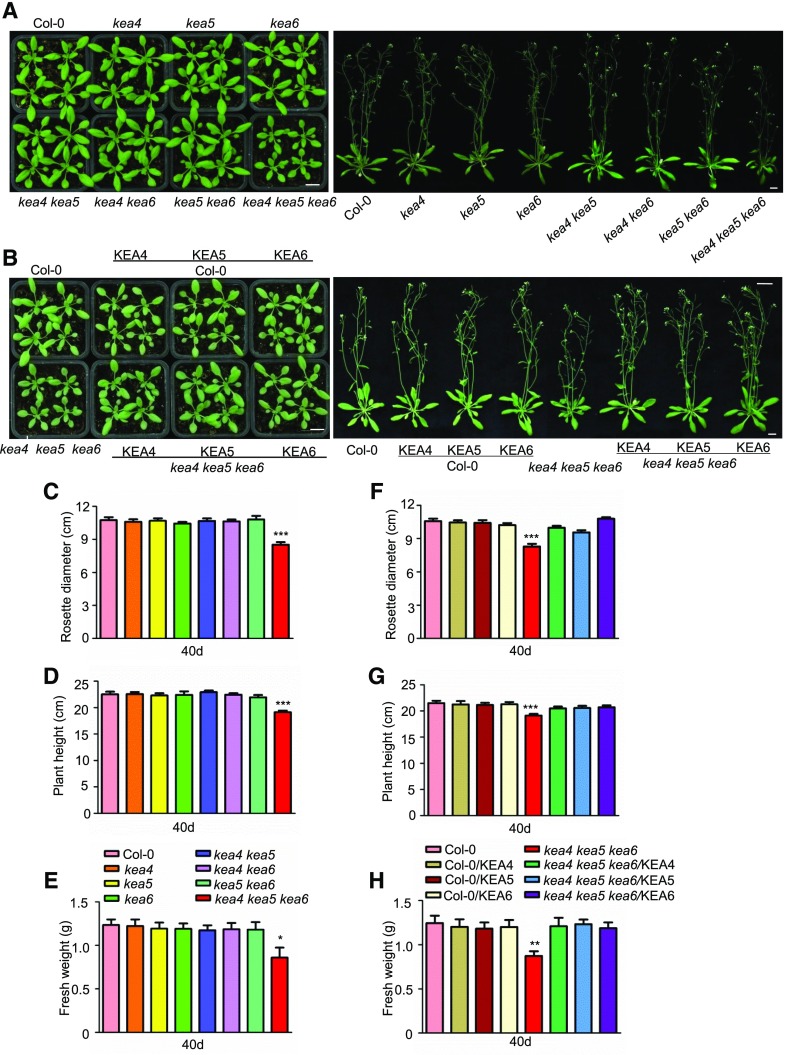
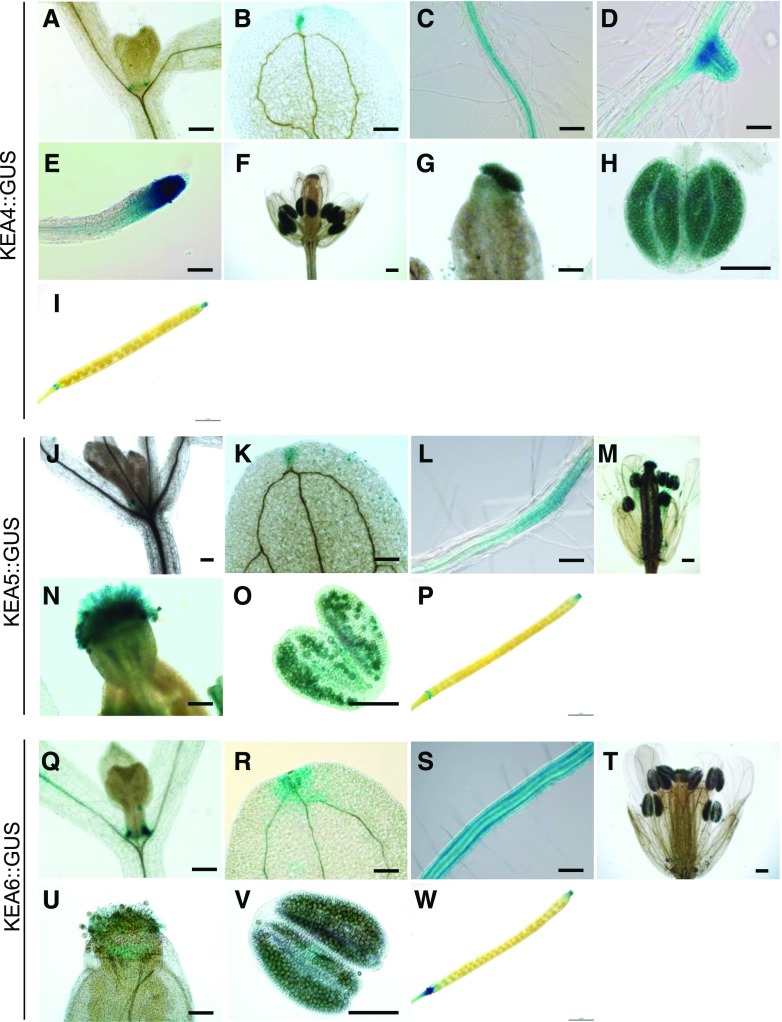
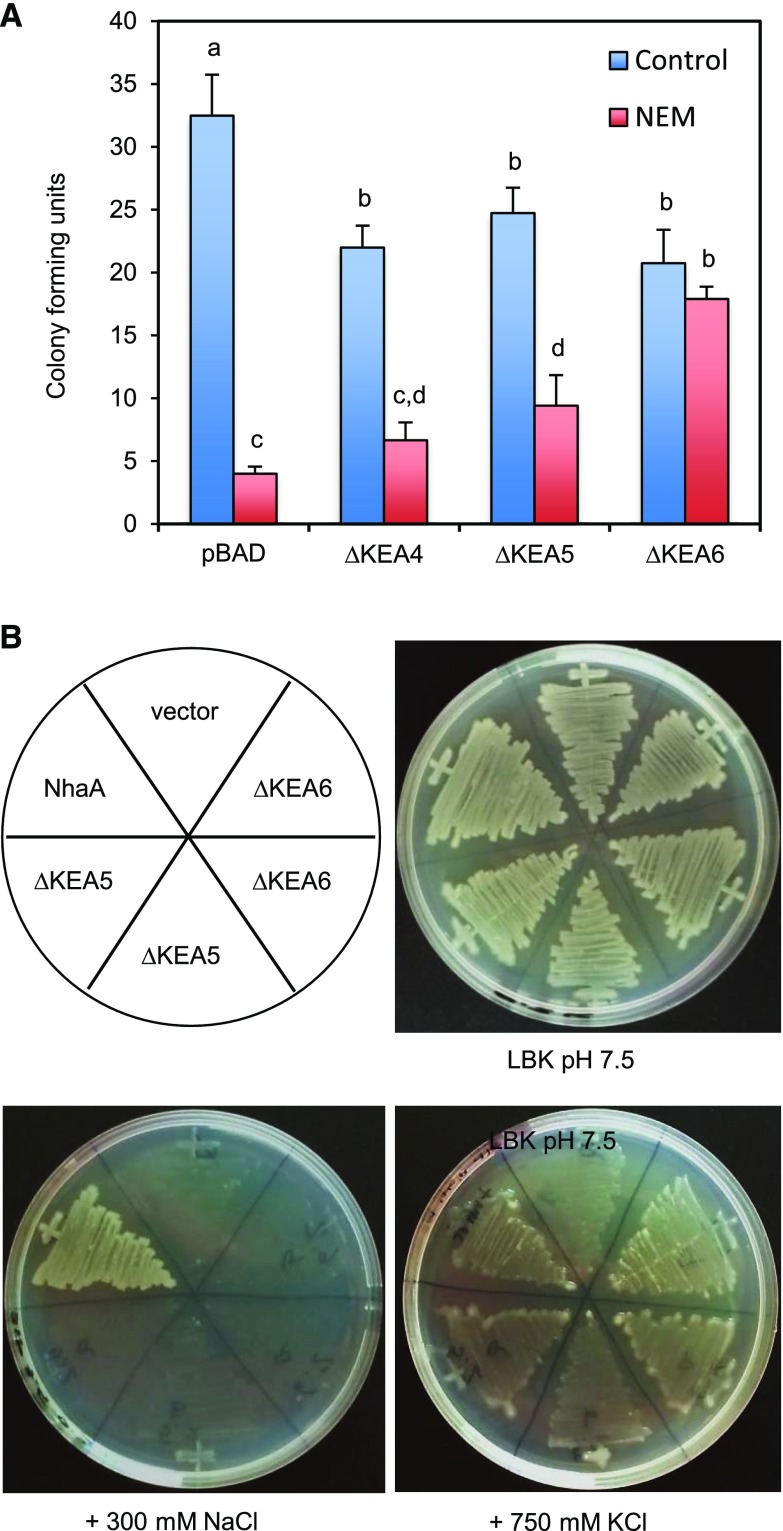
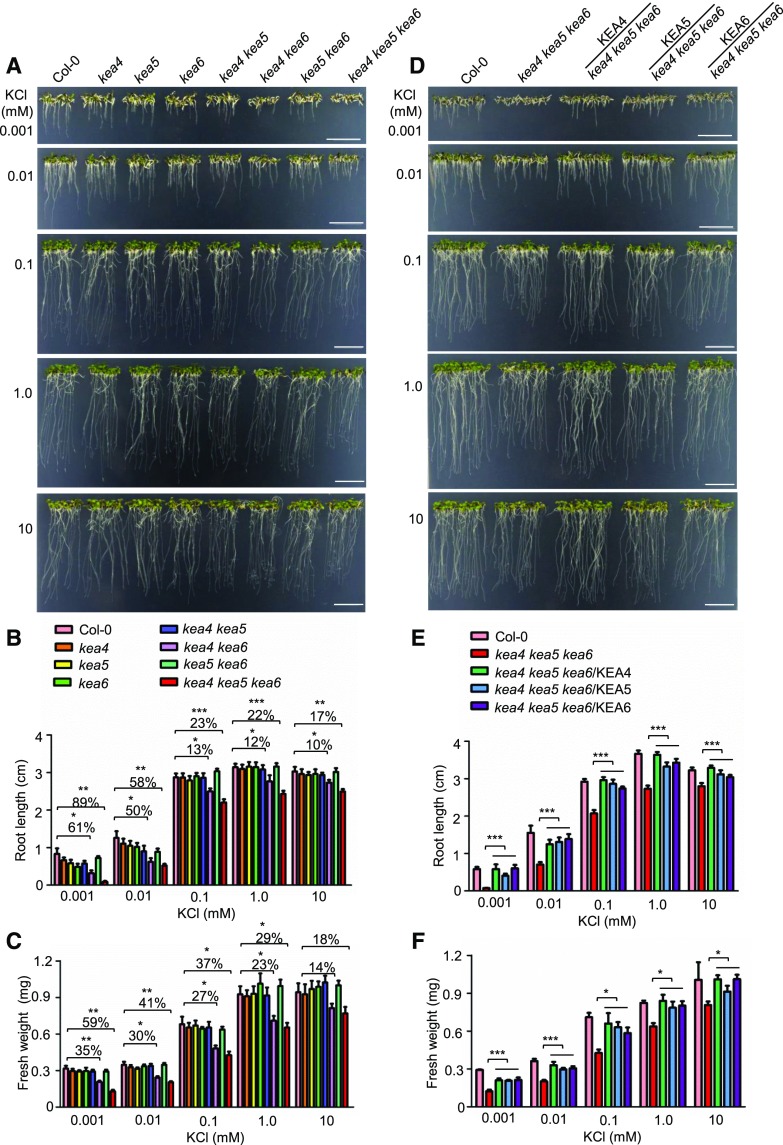
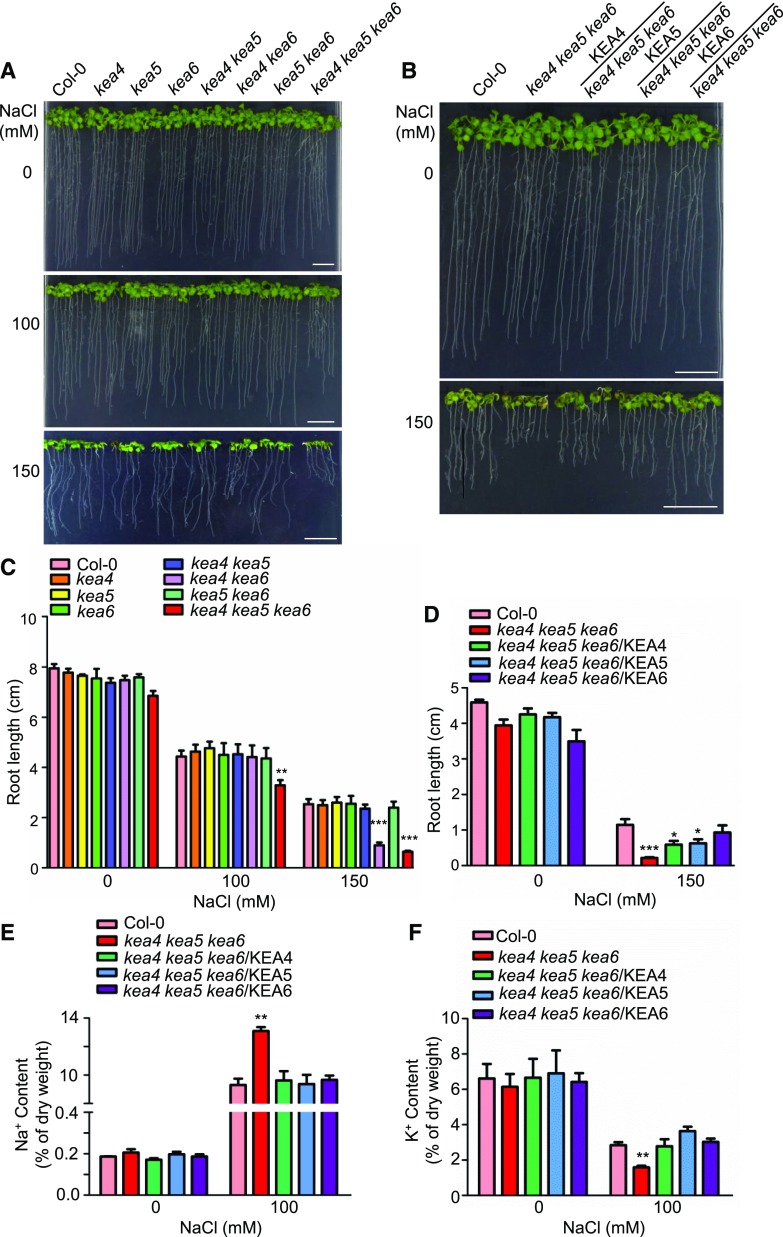
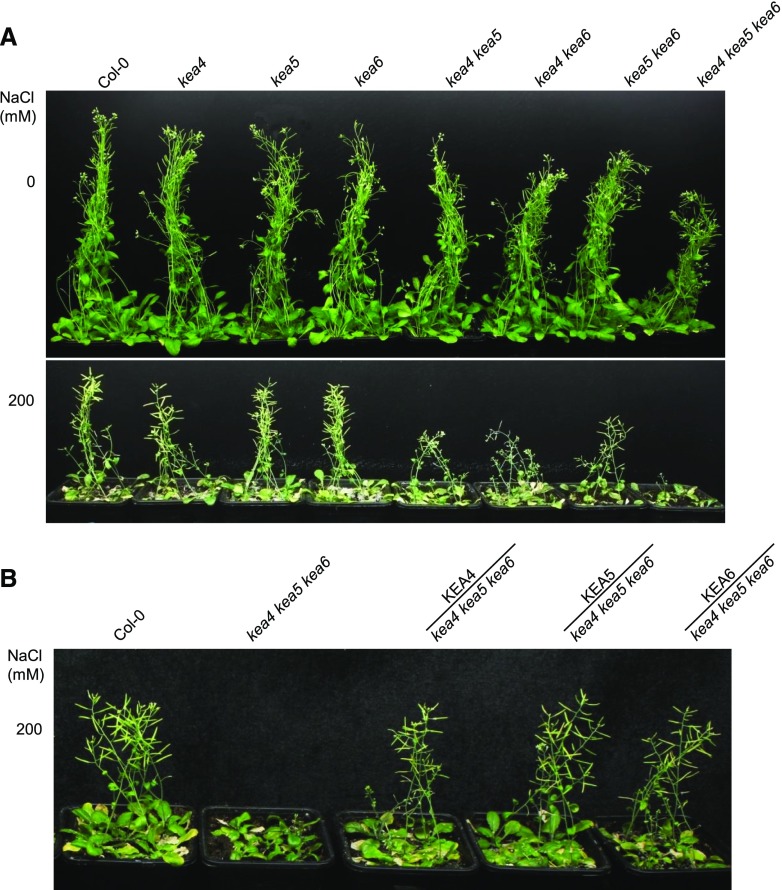
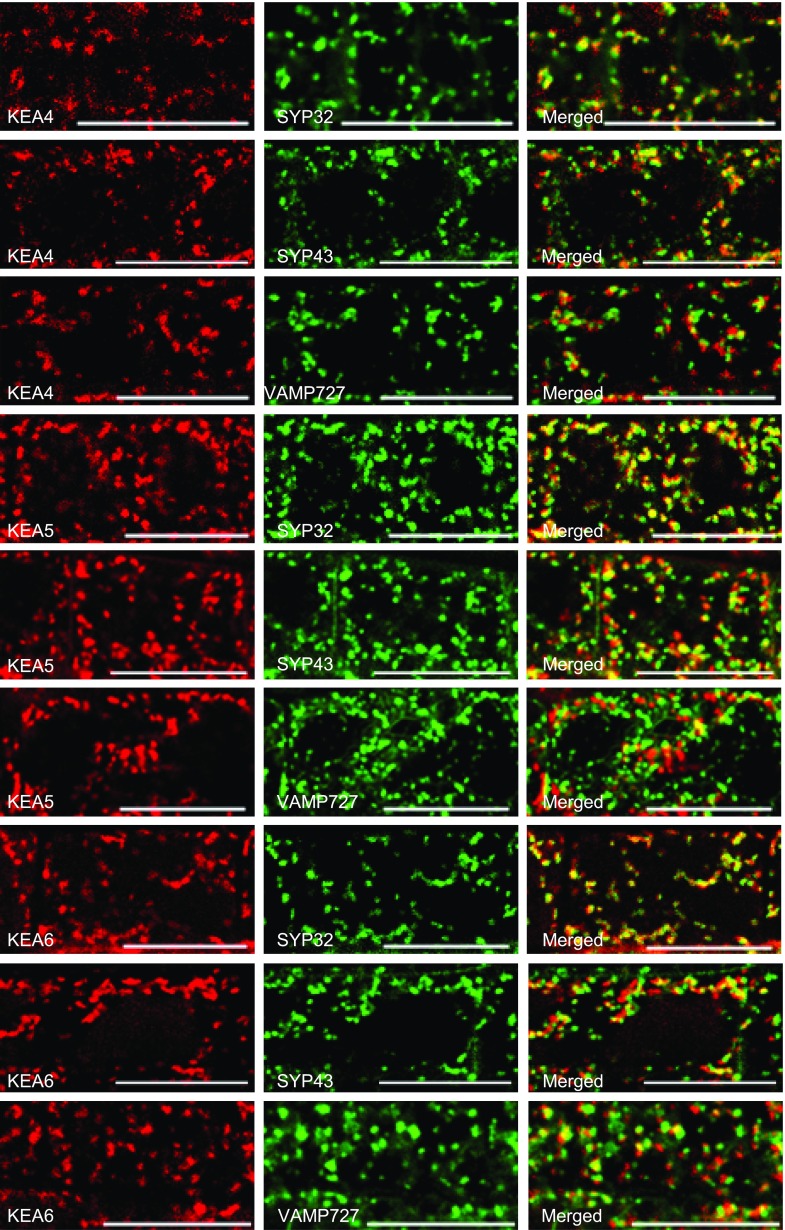
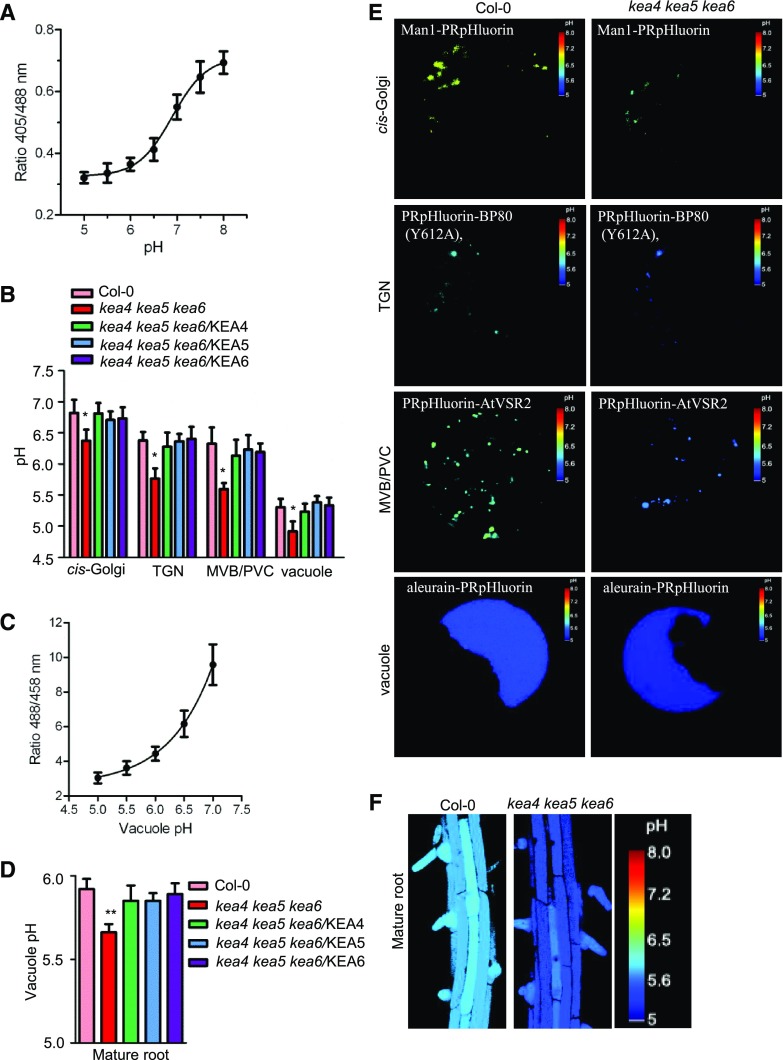
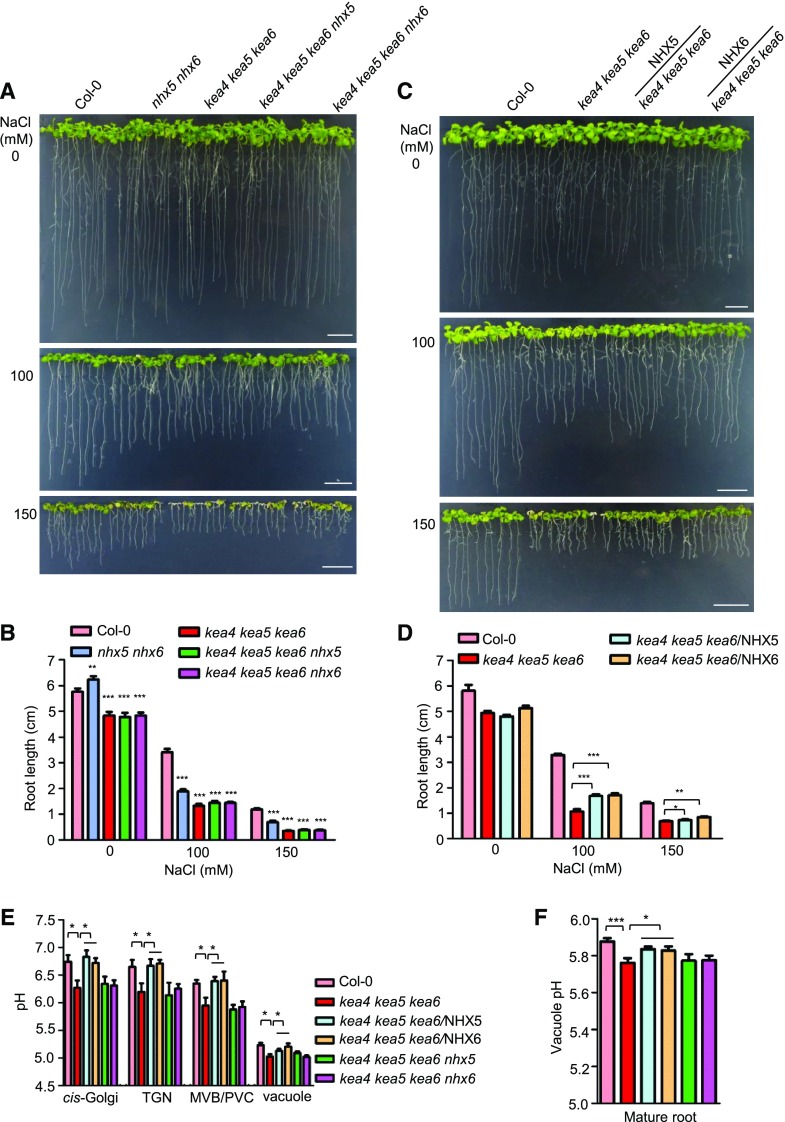
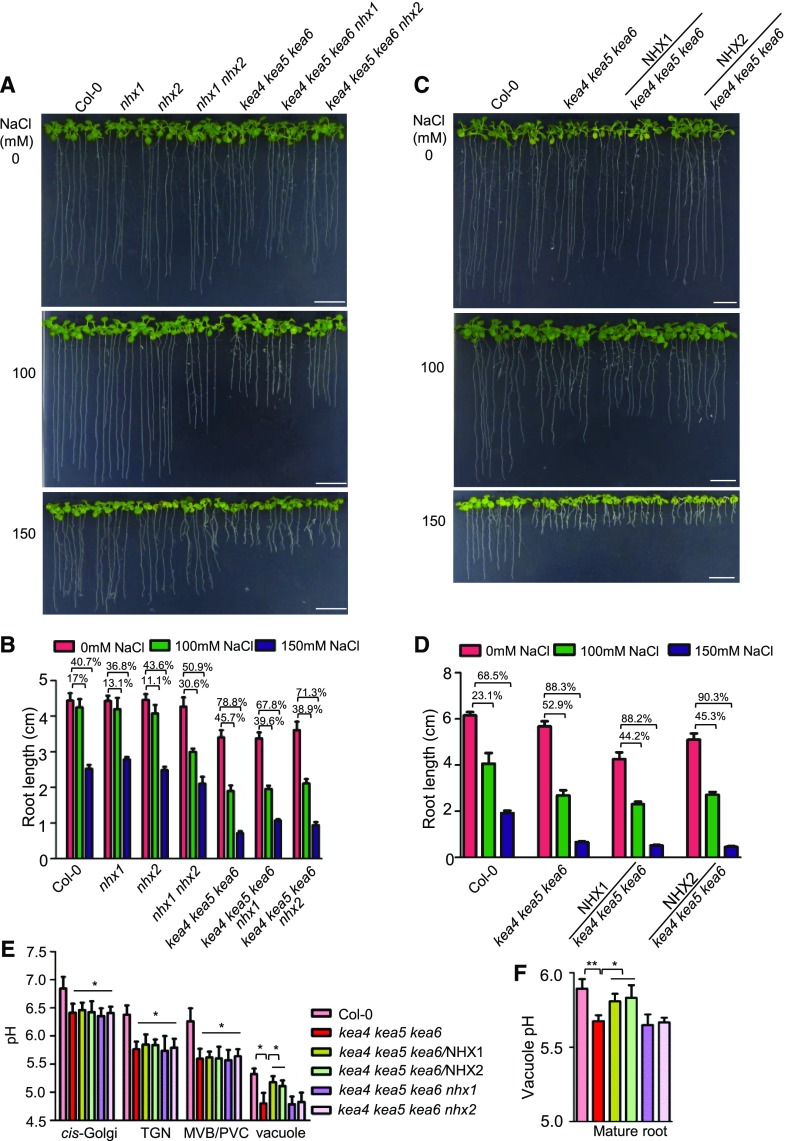
KEA4, KEA5, and KEA6 are members of the Arabidopsis (Arabidopsis thaliana) K+ efflux antiporter (KEA) family that share high sequence similarity but whose function remains unknown. Here, we show their gene expression pattern, subcellular localization, and physiological function in Arabidopsis. KEA4, KEA5, and KEA6 had similar tissue expression patterns, and the three KEA proteins localized to the Golgi, the trans-Golgi network, and the prevacuolar compartment/multivesicular bodies, suggesting overlapping roles of these proteins in the endomembrane system. Phenotypic analyses of single, double, and triple mutants confirmed functional redundancy. The triple mutant kea4 kea5 kea6 had small rosettes, short seedlings, and was sensitive to low K+ availability and to the sodicity imposed by high salinity. Also, the kea4 kea5 kea6 mutant plants had a reduced luminal pH in the Golgi, trans-Golgi network, prevacuolar compartment, and vacuole, in accordance with the K/H exchange activity of KEA proteins. Genetic analysis indicated that KEA4, KEA5, and KEA6 as well as endosomal Na+/H+exchanger5 (NHX5) and NHX6 acted coordinately to facilitate endosomal pH homeostasis and salt tolerance. Neither cancelling nor overexpressing the vacuolar antiporters NHX1 and NHX2 in the kea4 kea5 kea6 mutant background altered the salt-sensitive phenotype. The NHX1 and NHX2 proteins in the kea4 kea5 kea6 mutant background could not suppress the acidity of the endomembrane system but brought the vacuolar pH close to wild-type values. Together, these data signify that KEA4, KEA5, and KEA6 are endosomal K+ transporters functioning in maintaining pH and ion homeostasis in the endomembrane network.


Figures

Figure 1.
Figure 1.
The kea4 kea5 kea6 mutant is defective in growth. A and B, Seedling growth. A, Mutants. B, Overexpression lines. Photographs were taken at 21 d (left) and 40 d (right). Bars = 1 cm. C to E, Rosette diameters (C), plant heights (D), and fresh weight (E) of mutants measured at 40 d (mean ± se; n = 15 plants). F to H, Rosette diameters (F), plant heights (G), and fresh weight (H) of the overexpression lines measured at 40 d (mean ± se; n = 15 plants). In C to F, statistics by Student’s t test are shown: *, P < 0.05; **, P < 0.01; and ***, P < 0.001.
Figure 2.
Figure 2.
GUS staining assay of KEA4, KEA5, and KEA6 expression in Arabidopsis. A to I, GUS staining of ProKEA4::GUS plants. A, True leaf. B, Cotyledon. C, Root vasculature. D, Secondary root. E, Root tip. F, Flower. G, Stigma. H, Anther. I, Silique. Bars = 0.2 mm (A, B, and F), 100 μm (C–E and G), 150 μm (H), and 2 mm (I). J to P, GUS staining of ProKEA5::GUS plants. J, True leaf. K, Cotyledon. L, Root vasculature. M, Flower. N, Stigma. O, Anther. P, Silique. Bars = 0.2 mm (J, K, and M), 100 μm (L and N), 150 μm (O), and 2 mm (P). Q to W, GUS staining of ProKEA6::GUS plants. Q, True leaf. R, Cotyledon. S, Root vasculature. T, Flower. U, Stigma. V, Anther. W, Silique. Bars = 0.2 mm (Q, R, and T), 100 μm (S and U), 150 μm (V), and 2 mm (W).
Figure 3.
Figure 3.
KEA5 and KEA6 mediate H+-linked K+ transport in bacteria. N-terminal truncations of KEA4, KEA5, and KEA6 were expressed in E. coli strains lacking K+ and Na+ transporters. A, Survival of MJF276 cells with mutated K+/H+ exchangers KefB and KefC after treatment with NEM. Shown are the colony-forming units with and without NEM treatment after appropriate serial dilutions. Data represent means and se of two biological and four technical replicates. Lettering indicates significantly different means (P < 0.05) by the one-way ANOVA test. B, EP432 cells lacking the Na+/H+ exchangers NhaA and NhaB were streaked on agar plates with LKB medium at pH 7.5 with and without supplemental NaCl and KCl as indicated. Two independent ∆KEA5 and ∆KEA6 transformants are shown. The E. coli NhaA and empty vector were used as positive and negative controls.
Figure 4.
Figure 4.
Mutant kea4 kea5 kea6 is sensitive to low-K+ treatment. A and D, Growth of the mutants and overexpression lines at low K+. A, The mutants. D, The overexpression lines. Seedlings were grown on modified MS medium containing different levels of K+ (0.001–10 mm KCl). For the solidification of MS medium, 1% ultra-pure agarose was used (Pandey et al., 2007). Photographs were taken at 7 d under low-K+ treatment. Bars = 1 cm. B and E, Root length for the seedlings from A and D, respectively (mean ± se; n = 10 seedlings). C and F, Fresh weight for the seedlings from A and D, respectively (mean ± se; n = 30 seedlings). In B, C, E, and F, statistics by Student’s t test are shown: *, P < 0.05; **, P < 0.01; and ***, P < 0.001.
Figure 5.
Figure 5.
The kea4 kea5 kea6 mutant is sensitive to salt stress. A and B, Growth of the mutants and overexpression lines under NaCl treatment. A, The mutants. B, The overexpression lines. Four-day-old seedlings grown on 1/2 MS medium were transferred to 1/2 MS medium containing 0, 100, and 150 mm NaCl. Photographs were taken at 10 d under salt stress. Bars = 1 cm. C, Root length for seedlings from A (mean ± se; n = 8 seedlings). D, Root length for seedlings from B (mean ± se; n = 8 seedlings). E, Na+ content assay (mean ± se; n = 3 times). F, K+ content assay (mean ± se; n = 3 times). In C to F, statistics by Student’s t test are shown: *, P < 0.05; **, P < 0.01; and ***, P < 0.001.
Figure 6.
Figure 6.
Seedling growth is suppressed in the kea4 kea5 kea6 mutant under salt stress. Growth of the mutants and overexpression lines in soil under salt stress is shown. A, The mutants. B, The overexpression lines. After growing for 2 weeks, the seedlings were treated with 0 or 200 mm NaCl every 3 d. Photographs were taken after the seedlings were treated with NaCl for 4 weeks.
Figure 7.
Figure 7.
Subcellular localizations of KEA4, KEA5, and KEA6 in Arabidopsis. Coexpression of KEA4-RFP, KEA5-RFP, and KEA6-RFP with the endosomal markers in root cells is shown. Markers used were SYP32 (Golgi marker), SYP43 (TGN marker), and VAMP727 (PVC marker). Bars = 20 μm.
Figure 8.
Figure 8.
The kea4 kea5 kea6 mutant has a more acidic pH in the endomembrane compartments. A, In vivo calibration curve of the pH of the cytoplasm. pH was measured using Arabidopsis protoplasts transiently expressing the Golgi-specific Man1-PRpHluorin, TGN-specific PRpHluorin-BP80 (Y612A), PVC/MVB-specific PRpHluorin-AtVSR2, and vacuole-specific aleurain-PRpHluorin. The images were taken with a Leica TCS SP5 laser scanning confocal microscope. The calibration curve was achieved by equilibrating intracellular pH with 25 μm nigericin, 60 mm KCl, and 10 mm MES/HEPES Bis-Tris-propane, pH 5 to 8 (mean ± se; n ≥ 20 protoplasts). B, pH of the Golgi, TGN, PVC/MVB, and vacuole (mean ± se; n ≥ 20 protoplasts). Statistics by Student’s t test are shown: *, P < 0.05. C, In situ calibration curve of the pH of BCECF-AM dye-loaded roots. The calibration was performed by plotting the ratio of emission fluorescence (505–550 nm), obtained when dye-loaded roots were excited with 458 and 488 nm, against the pH of equilibration buffers as described in “Materials and Methods.” Fluorescence images were collected 15 min after roots were incubated in equilibration buffers (mean ± se; n = 10 roots). D, Vacuolar pH of the mature root measured by BCECF-AM (mean ± se; n = 10 roots). Statistics by Student’s t test are shown: **, P < 0.01. E, Representative pseudocolored images for the organellar pH assays. The organelle-specific pHlurions were described in A. F, Ratio images of epidermal cells of the mature root zone in Col-0 and the kea4 kea5 kea6 mutant.
Figure 9.
Figure 9.
Interactions between the endosomal KEA and NHX antiporters. A, The quadruple mutants kea4 kea5 kea6 nhx5 and kea4 kea5 kea6 nhx6 were grown on 1/2 MS medium for 4 d, and then seedlings were transferred to 1/2 MS medium containing 0, 100, or 150 mm NaCl. Photographs were taken at 10 d under salt stress. Bars = 1 cm. B, Root length for seedlings from A (mean ± se; n = 8 seedlings). C, The overexpression lines of kea4 kea5 kea6/NHX5 and kea4 kea5 kea6/NHX6 were grown on 1/2 MS medium for 4 d, and then seedlings were transferred to 1/2 MS medium containing 0, 100, or 150 mm NaCl. Photographs were taken at 10 d under salt stress. Bars = 1 cm. D, Root length for seedlings from C (mean ± se; n = 8 seedlings). E, The luminal pH of the Golgi, TGN, PVC/MVB, and vacuole in the quadruple mutants and overexpression lines was determined using organelle-specific pHluorin-based pH sensors (mean ± se; n ≥ 20 protoplasts). The method was the same as in Figure 8. F, Vacuolar pH of the mature root measured by BCECF-AM (mean ± se; n = 10 seedlings). The method was the same as in Figure 8. In B and D to F, statistics by Student’s t test are shown: *, P < 0.05; **, P < 0.01; and ***, P < 0.001.
Figure 10.
Figure 10.
Interactions between the endosomal and vacuolar antiporters. A, The quadruple mutants. The quadruple mutants kea4 kea5 kea6 nhx1 and kea4 kea5 kea6 nhx2 were grown on 1/2 MS medium for 4 d, then the seedlings were transferred to 1/2 MS medium containing 0, 100, and 150 mm NaCl. Photographs were taken at 10 d under salt stress. Bars = 1 cm. B, Inhibition of root growth for seedlings from A (mean ± se; n = 8 seedlings). C, Overexpression lines. The overexpression lines kea4 kea5 kea6/NHX1 and kea4 kea5 kea6/NHX2 were grown on 1/2 MS medium for 4 d, then the seedlings were transferred to 1/2 MS medium containing 0, 100, and 150 mm NaCl. Photographs were taken at 10 d under salt stress. Bars = 1 cm. D, Inhibition of root growth for seedlings from C (mean ± se; n = 8 seedlings). E, pH measurement. pH of the Golgi, TGN, PVC/MVB, and vacuole in quadruple mutants and overexpression lines was determined (mean ± se; n ≥ 20 protoplasts). The method was the same as in Figure 8. F, Vacuolar pH of the mature root measured by BCECF-AM (mean ± se; n = 10 seedlings). The method was the same as in Figure 8. In E and F, statistics by Student’s t test are shown: *, P < 0.05 and **, P < 0.01.

Similar articles

Cited by

References

    1. Andrés Z, Pérez-Hormaeche J, Leidi EO, Schlücking K, Steinhorst L, McLachlan DH, Schumacher K, Hetherington AM, Kudla J, Cubero B, et al. (2014) Control of vacuolar dynamics and regulation of stomatal aperture by tonoplast potassium uptake. Proc Natl Acad Sci USA 111: E1806–E1814 - PMC - PubMed
    1. Apse MP, Aharon GS, Snedden WA, Blumwald E (1999) Salt tolerance conferred by overexpression of a vacuolar Na+/H+ antiport in Arabidopsis. Science 285: 1256–1258 - PubMed
    1. Apse MP, Sottosanto JB, Blumwald E (2003) Vacuolar cation/H+ exchange, ion homeostasis, and leaf development are altered in a T-DNA insertional mutant of AtNHX1, the Arabidopsis vacuolar Na+/H+ antiporter. Plant J 36: 229–239 - PubMed
    1. Aranda-Sicilia MN, Cagnac O, Chanroj S, Sze H, Rodríguez-Rosales MP, Venema K (2012) Arabidopsis KEA2, a homolog of bacterial KefC, encodes a K+/H+ antiporter with a chloroplast transit peptide. Biochim Biophys Acta 1818: 2362–2371 - PubMed
    1. Aranda-Sicilia MN, Aboukila A, Armbruster U, Cagnac O, Schumann T, Kunz HH, Jahns P, Rodríguez-Rosales MP, Sze H, Venema K (2016) Envelope K+/H+ antiporters AtKEA1 and AtKEA2 function in plastid development. Plant Physiol 172: 441–449 - PMC - PubMed

Publication types

MeSH terms