. 2018 Oct 11;9(1):4218.
doi: 10.1038/s41467-018-06667-3.

Rifampicin can induce antibiotic tolerance in mycobacteria via paradoxical changes in rpoB transcription

Affiliations

Rifampicin can induce antibiotic tolerance in mycobacteria via paradoxical changes in rpoB transcription

Jun-Hao Zhu et al. Nat Commun. .

Abstract

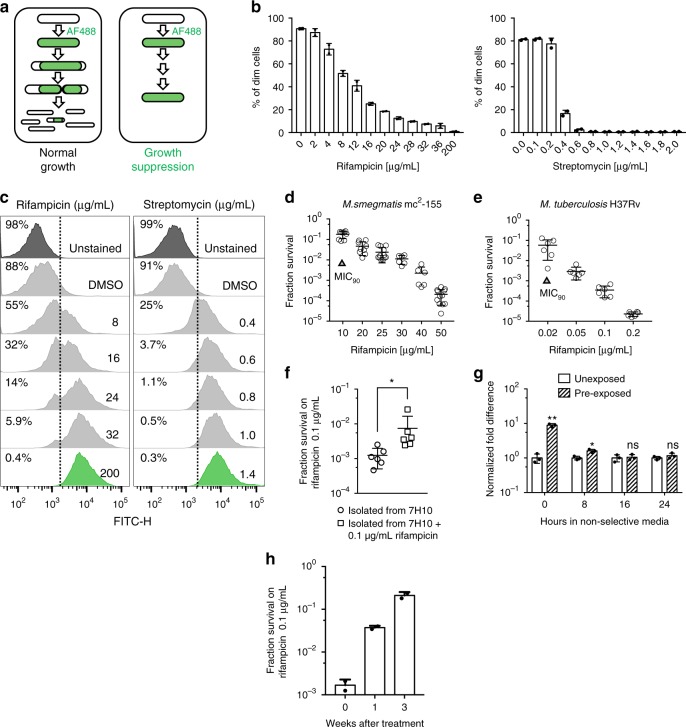
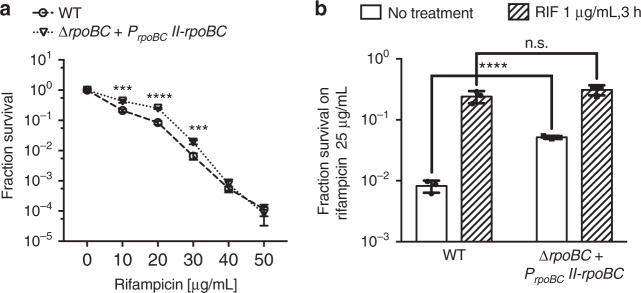
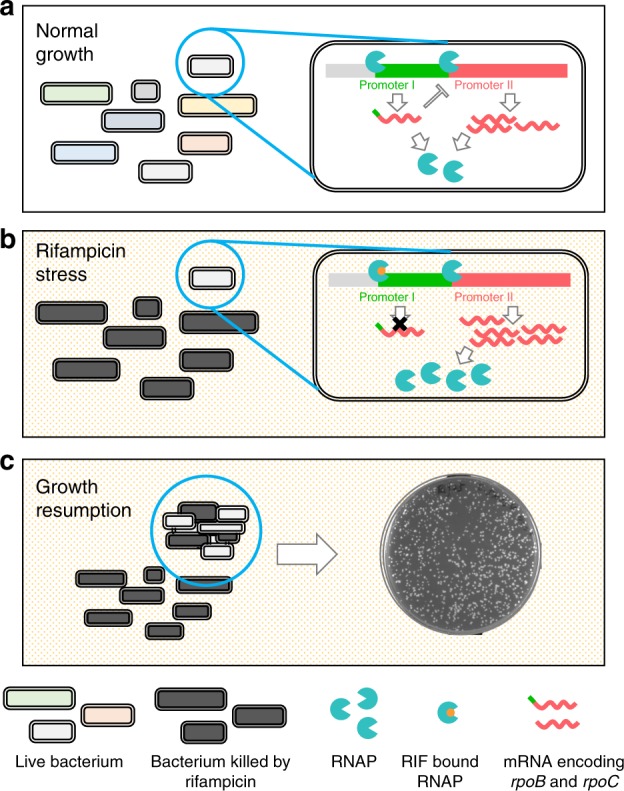
Metrics commonly used to describe antibiotic efficacy rely on measurements performed on bacterial populations. However, certain cells in a bacterial population can continue to grow and divide, even at antibiotic concentrations that kill the majority of cells, in a phenomenon known as antibiotic tolerance. Here, we describe a form of semi-heritable tolerance to the key anti-mycobacterial agent rifampicin, which is known to inhibit transcription by targeting the β subunit of the RNA polymerase (RpoB). We show that rifampicin exposure results in rpoB upregulation in a sub-population of cells, followed by growth. More specifically, rifampicin preferentially inhibits one of the two rpoB promoters (promoter I), allowing increased rpoB expression from a second promoter (promoter II), and thus triggering growth. Disruption of promoter architecture leads to differences in rifampicin susceptibility of the population, confirming the contribution of rifampicin-induced rpoB expression to tolerance.


Conflict of interest statement

The authors declare no competing interests.

Figures

Fig. 1
Fig. 1
Rifampicin-tolerant mycobacteria grow in bulk-lethal concentrations of antibiotic in a concentration-dependent manner. a Schematic outlining the basis for the fluorescence dilution assay: cells are stained with Alexa-fluor-488 (AF488), and as they grow and divide, the total fluorescence is diluted (left panel). If cells fail to grow—either due to death or a non-replicating physiological state, full fluorescence is retained (right panel). b Fluorescence dilution assay of M. smegmatis exposed to indicated concentrations of rifampicin (left) and streptomycin (right) and analyzed by flow cytometry (see Supplementary Fig. 2 for flow cytometry strategy for scoring dim cells). Bars represent duplicate experiments. c Sample flow cytometry histograms of fluorescence distributions of single M. smegmatis cells following 16-h exposure to rifampicin (left panel) or streptomycin (right panel) at indicated concentrations. M. smegmatis (d) or M. tuberculosis (e) were plated on rifampicin-agar at varying concentrations and the fractional survival (number of colonies on rifampicin-agar compared with non-selective medium) calculated. Results represent 7–12 biological replicates per concentration. f Plating rifampicin tolerance of M. tuberculosis-H37Rv from colonies picked from non-selective medium (7H10 plates) or previously plated on rifampicin-agar. The picked colonies were resuspended and plated on rifampicin-agar as in (e). g Three colonies of M. smegmatis that grew on non-selective medium (“unexposed”) or three that survived and grew on 25 µg ml–1 rifampicin-agar (“pre-exposed”) were picked and re-suspended in complete 7H9 medium for the indicated time without antibiotics and then plated onto 25 µg ml–1 rifampicin-agar or non-selective medium to calculate fractional survival. Results normalized to fractional survival of unexposed colonies at time = 0. *p < 0.05 and **p < 0.01 by Student’s t-test. h Plating rifampicin tolerance was determined from freshly isolated M. tuberculosis from sputum of a treatment naive patient immediately prior and following initiation of treatment with the standard regimen (see Methods). Results are representative of experiments performed for two distinct patients
Fig. 2
Fig. 2
Mycobacterium smegmatis exposed to rifampicin results in a distinct and specific rifampicin tolerance. a Gating strategy for sorting of M. smegmatis by fluorescence intensity following 18-h exposure to 10 µg ml–1 rifampicin in axenic culture. In all, 106 cells were sorted from each gate, and then 1000 bacteria from each sub-population plated onto drug-free agar medium. b Indicated sorted sub-populations from (a) and M. smegmatis exposed to 100 µg ml−1 rifampicin and drug-free medium were then plated on non-selective medium to calculate survival. Error bars represent standard deviation of two technical replicates. c M. smegmatis was exposed to sub-MIC concentrations of the indicated antibiotics or vehicle for 3 h, then washed, stained with AF488 and then inoculated into 7H9-rifampicin at the indicated concentrations. After 16-h incubation, fluorescence dilution was determined by flow cytometry as before. Error bars represent biological duplicates. *p < 0.05 by Student’s t-test
Fig. 3
Fig. 3
RSPR is semi-heritable and correlates with the accumulation of RpoB, the target of rifampicin. a Fluorescence microscopy of M. smegmatis rpoB-mEmerald after exposure to sub-MIC rifampicin or vehicle for 3 h showing accumulation of fluorescent signal after rifampicin. b Flow cytometric analysis of green fluorescence (representing RpoB-mEmerald) after 3-h exposure to sub-MIC (non-bulk lethal) concentrations of indicated antibiotics or vehicle. Data represent biological duplicates as measured by flow cytometry. *p < 0.05, **p < 0.01 and ***p < 0.001 by Student’s t-test. c Fluorescence microscopy of representative image series of a microcolony visualized in a microfluidic chamber following growth in 7H9 and then 7H9-rifampicin. d Change in cell length and fluorescent intensity (RpoB-mApple) of 150 cells following addition of 20 µg ml−1 rifampicin to the flow chamber. Cells were scored following 6 h of treatment. Red circles represent growers, gray circles cells that did not grow and the two cells that underwent lysis are represented by hollow circles. e Schematic of the construct for in trans overexpression of rpoB-rpoC using a tetracycline-inducible promoter. f Western blot for RpoB following induction of expression with anhydrotetracycline (ATc). g Fluorescence dilution assay in rifampicin at indicated concentrations for M. smegmatis overexpressing rpoB-rpoC from the construct in (e) or vector only control. h Categorization of 409 cells and the progeny of 66 dividing cells into the five RSPR response types (Supplementary Fig. 13) following treatment with 20 µg ml−1 (bulk-lethal concentration) rifampicin for 16 h
Fig. 4
Fig. 4
Rifampicin exposure upregulates rpoB by differential susceptibility of its two promoters to inhibition by rifampicin. a Sequence alignment of the conserved mycobacterial rpoB-rpoC operon for M. tuberculosis-H37Rv, M. marinum and M. smegmatis mc2-155. The operon is controlled by two promoters, the 5ʹ Promoter I and the 3ʹ Promoter II (−35 and −10 elements boxed), with a conserved inter-promoter region (shaded blue). The two transcription start sites (TSSI and TSSII) are also illustrated. b Representative fluorescence microscopy images of RpoB-mApple and mEmerald, driven by the rpoB-rpoC promoter (PrpoBC-mEmerald) before, immediately following and 6 h after exposure to rifampicin in the flow chamber. c Relative mRNA abundance (normalized to sigA mRNA) of Promoter I, Promoter I + II (Promoter II) and coding sequence (CDS) transcripts from rifampicin (1 µg ml−1—for 3 h) or vehicle-treated M. smegmatis—see Supplementary Fig. 17 for promoter-specific primers. Each bar represents four biological replicates. *p < 0.05, **p < 0.01, ****p < 0.0001 by Student’s t-test. d Mean fluorescent intensity (MFI) of mEmerald driven by 19 rpoB-rpoC promoter truncations (see Supplementary Fig. 17b) as measured by flow cytometry in response to sub-MIC rifampicin for 3 h or vehicle. e MFI of RpoBL511P-mEmerald in response to sub-MIC concentrations of rifampicin or vehicle for 3 h. Each bar represents biological duplicates. *p < 0.05 by Student’s t-test. f MFI of mEmerald expression driven by the two chimeric promoters—see Supplementary Fig. 20d, e ±50 ng ml−1 ATc for 6 h measured by flow cytometry in M. smegmatis strains expressing the promoter constructs. Each bar represents three biological replicates.
Fig. 5
Fig. 5
Disruption of the rpoB promoter architecture alters RSPR. a Fractional survival on 25 µg ml−1 rifampicin-agar of wild-type M. smegmatis or M. smegmatis with only Promoter II-driven rpoB-rpoC at the Giles chromosomal location. Data represent biological triplicates. ***p < 0.001 and ****p < 0.0001 by Student’s t-test. b Cultures of the two strains in (a) were pretreated with 7H9 ± 1 µg ml−1 rifampicin for 3 h and then plated on rifampicin-agar and fractional survival calculated. Data represent biological triplicates. ****p < 0.0001 by Student’s t-test, n.s. no significant difference by Student’s t-test
Fig. 6
Fig. 6
Working model of transcriptional regulation of rpoB-rpoC in mycobacteria and its role in rifampicin-specific phenotypic resistance. a Under normal growth conditions, maximal rpoB expression is suppressed by the interaction of the promoters in the rpoB-rpoC operon. Expression from Promoter I prevents maximal expression from the stronger Promoter II. b Upon encountering rifampicin, some cells are killed by the antibiotic. In surviving cells, expression from Promoter I is completely inhibited by minimal concentrations of rifampicin. This in turn relieves the inhibitory effect on expression from Promoter II, allowing maximal RpoB expression (in Msm, and possibly additional other mechanisms in BCG and Mtb), which then allows initiation of a specific adaptive transcriptional programme. c Increased expression of RNAP in response to rifampicin allows cells to survive moderate but otherwise lethal concentrations of rifampicin and after a delay, resume growth and division, with adaptive, semi-heritable hypertolerance to the drug in the face of ongoing exposure

References

    1. Lewis K. Persister cells. Annu. Rev. Microbiol. 2010;64:357–372. doi: 10.1146/annurev.micro.112408.134306. - DOI - PubMed
    1. Maisonneuve E, Gerdes K. Molecular mechanisms underlying bacterial persisters. Cell. 2014;157:539–548. doi: 10.1016/j.cell.2014.02.050. - DOI - PubMed
    1. Nathan C. Fresh approaches to anti-infective therapies. Sci. Transl. Med. 2012;4:140sr142. doi: 10.1126/scitranslmed.3003081. - DOI - PMC - PubMed
    1. Aldridge, B. B., Keren, I. & Fortune, S. M. The spectrum of drug susceptibility in Mycobacteria. Microbiol. Spectrum.10.1128/microbiolspec.MGM2-0031-2013 (2014). - PubMed
    1. Balaban NQ, Gerdes K, Lewis K, McKinney JD. A problem of persistence: still more questions than answers? Nat. Rev. Microbiol. 2013;11:587–591. doi: 10.1038/nrmicro3076. - DOI - PubMed

Publication types

MeSH terms