. 2018 Oct 11;9(1):4217.
doi: 10.1038/s41467-018-06738-5.

Mechanochemical feedback control of dynamin independent endocytosis modulates membrane tension in adherent cells

Affiliations

Mechanochemical feedback control of dynamin independent endocytosis modulates membrane tension in adherent cells

Joseph Jose Thottacherry et al. Nat Commun. .

Abstract

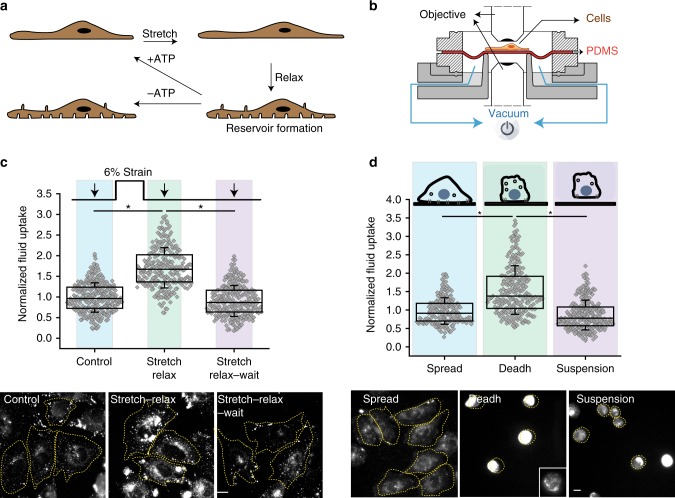
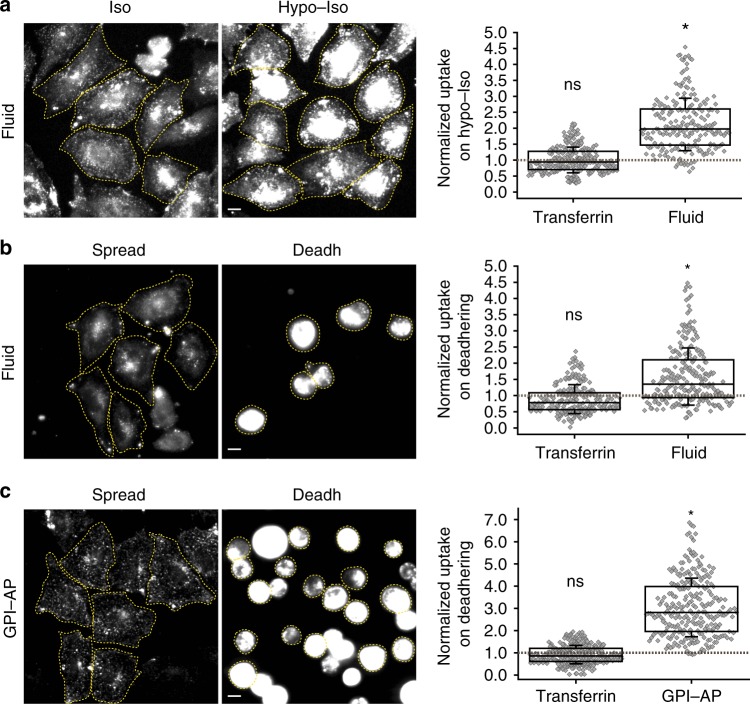
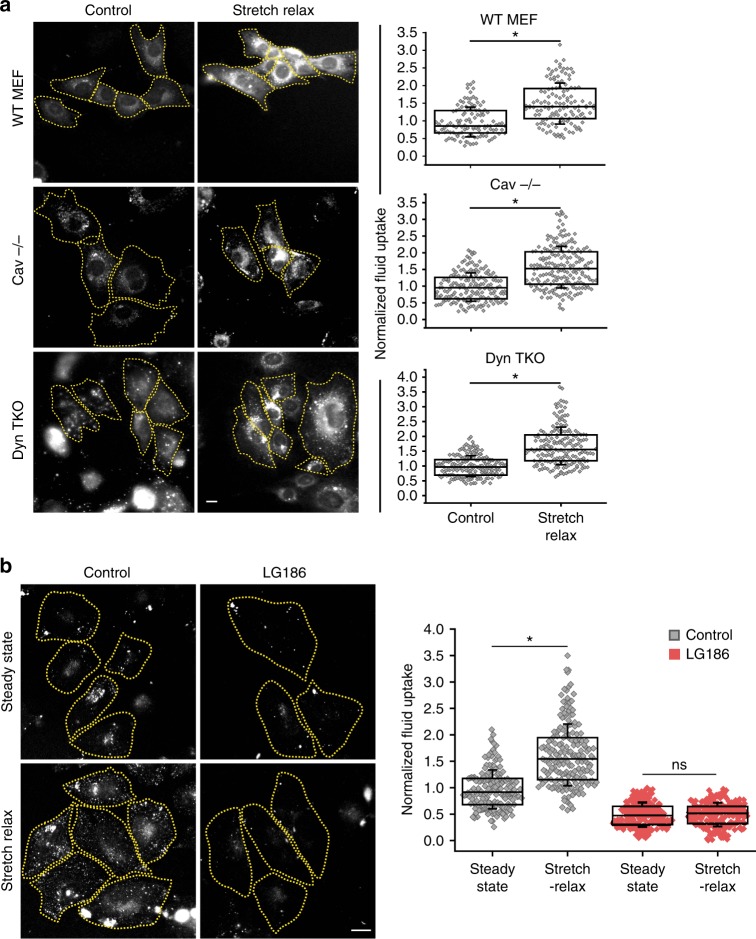
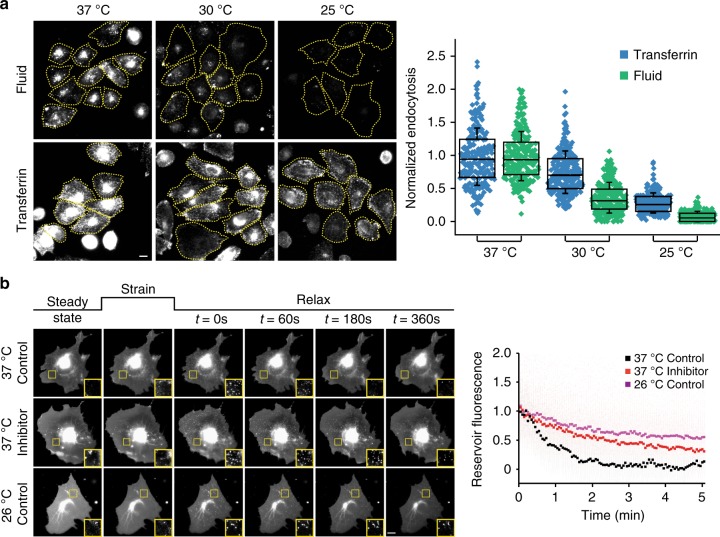
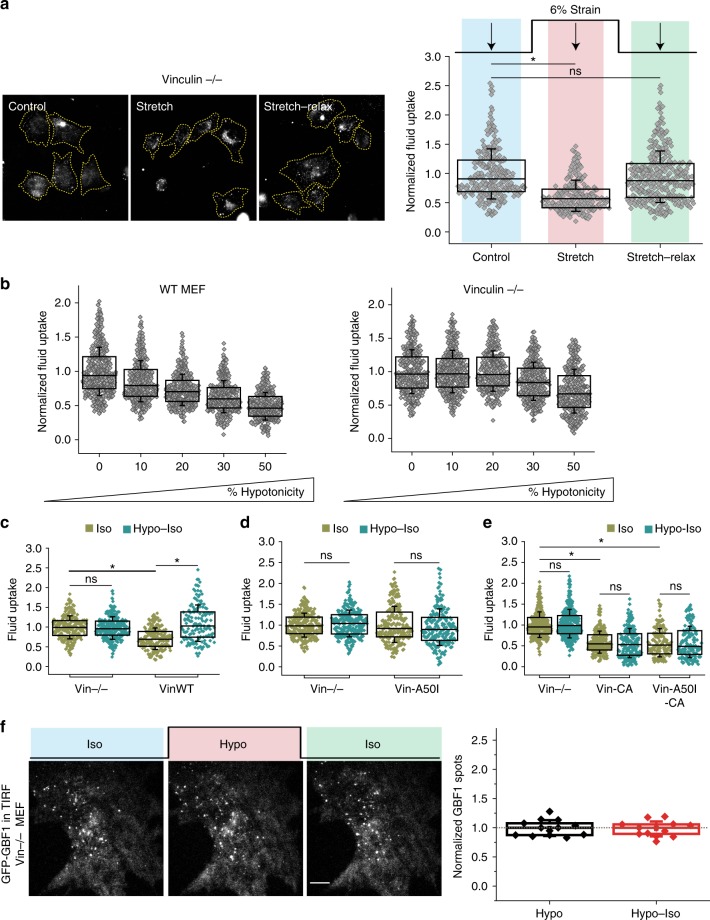
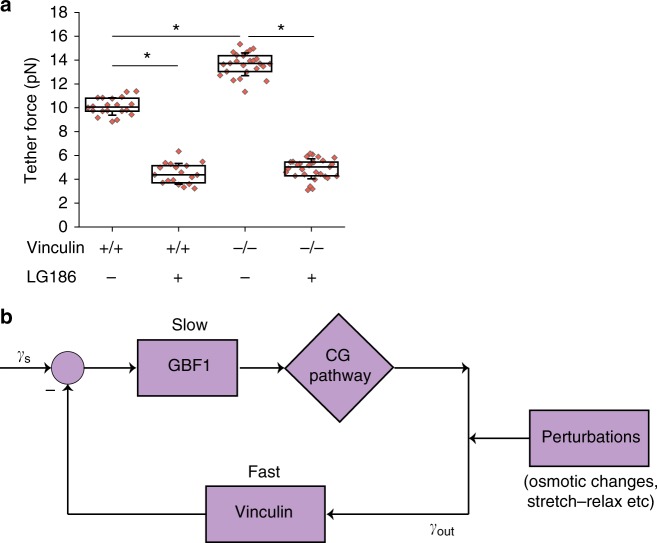
Plasma membrane tension regulates many key cellular processes. It is modulated by, and can modulate, membrane trafficking. However, the cellular pathway(s) involved in this interplay is poorly understood. Here we find that, among a number of endocytic processes operating simultaneously at the cell surface, a dynamin independent pathway, the CLIC/GEEC (CG) pathway, is rapidly and specifically upregulated upon a sudden reduction of tension. Moreover, inhibition (activation) of the CG pathway results in lower (higher) membrane tension. However, alteration in membrane tension does not directly modulate CG endocytosis. This requires vinculin, a mechano-transducer recruited to focal adhesion in adherent cells. Vinculin acts by controlling the levels of a key regulator of the CG pathway, GBF1, at the plasma membrane. Thus, the CG pathway directly regulates membrane tension and is in turn controlled via a mechano-chemical feedback inhibition, potentially leading to homeostatic regulation of membrane tension in adherent cells.


Conflict of interest statement

The authors declare no competing interests.

Figures

Fig. 1
Fig. 1
A fast transient endocytic response to decrease in membrane tension. a Cartoon showing membrane remodeling responses after mechanical strain. Cells after the stretch and relax protocol form invaginations termed ‘reservoirs’. These reservoirs are resorbed in a few minutes by an active process and requires ATP. b The illustration shows the longitudinal section of a vacuum-based equi-bi-axial stretching device. Cells plated on a PDMS sheet are stretched by the application of controlled vacuum below the circular PDMS sheet, which stretches it in a calibrated manner. Releasing the vacuum relaxes the strain on PDMS thus relaxing the cell. Cells plated on PDMS can be imaged in an upright or inverted microscope as required. c Fluid uptake (90 s) in CHO cells at steady state (steady state), immediately on relaxing the stretch (stretch–relax), or after a waiting time of 90 s on relaxing the stretch (stretch–relax–wait) (n = control (316), stretch–relax (257), stretch–relax–wait (277)). d Fluid uptake in CHO cells for 3 min in adhered cells (Spread), during de-adhering (Deadh), or immediately after cells are detached and in suspension (Suspension). Images and box plot show the extent of fluid-phase uptake under the indicated conditions (n = spread (196), deadh (241), suspension (274)). Box plot shows median, 25th and 75th percentile, and whiskers show the standard deviation. Individual data points are overlaid on box plot where each data point is the mean intensity per cell. The ‘n’ indicates total number of cells in each condition pooled from two different experiments with duplicates per experiment; *p < 0.001, ns not significant by Mann–Whitney U test. Scale bar, 10 µm
Fig. 2
Fig. 2
Endocytic pathways differ in their response to decrease in tension. a Fluid-phase and transferrin uptake in CHO cells under isotonic conditions (Iso) or immediately after shifting from the hypotonic to isotonic state (Hypo–Iso) by incubating cells with A647-Tf (Transferrin) or TMR-Dex (Fluid). Wide-field images (left) show the extent of endocytosed fluid-phase in isotonic or hypotonic-isotonic (Hypo–Iso) conditions. Box plot (right) show the extent of TMR-Dex and A647-Tf endocytosis in the Hypo–Iso condition normalized to those measured in the isotonic condition (gray dashed line) (n = transferrin (266), fluid (214)). b Fluid-phase and transferrin uptake in CHO cells using TMR-Dex (Fluid) and A647-Tf (Transferrin) for 3 min when the cells are adherent (Spread) or during de-adhering (Deadh). Wide-field images (left) show the extent of endocytosed fluid-phase in Spread and during de-adhering condition (Deadh). Box plot (right) shows the extent of TMR-Dex and A647-Tf endocytosis in the de-adhered condition normalized to that measured in the Spread condition (gray dashed line) (n = transferrin (246), fluid (244)). c GPI–AP and transferrin uptake in CHO cells using fluorescent folate to label GPI-anchored folate receptors (GPI–AP) and A647-Tf (Transferrin) in adherent cells (Spread) or during detachment (Deadh). Wide-field images (left) show the extent of endocytosed GPI-anchored folate receptor in Spread and during the de-adhering condition. Box plot (right) shows the extent of A647-Tf and folate receptor endocytosis in the de-adhered condition normalized to those measured in the Spread condition (gray dashed line) (n = transferrin (321), GPI–AP (261)). Box plot shows median, 25th and 75th percentile, and whiskers show the standard deviation. Individual data points are overlaid on box plot where each data point is the mean intensity per cell. The ‘n’ indicates total number of cells in each condition pooled from two different experiments with duplicates per experiment; *p < 0.001, ns not significant by Mann–Whitney U test. Scale bar, 10 µm
Fig. 3
Fig. 3
CG pathway is the primary pathway for fast endocytic response. a Fluid uptake in wild-type (WT MEF), caveolin-null (Cav−/−) or conditional Dynamin triple knockout MEFs (Dyn TKO) for 90 s using TMR-Dex at steady state (control) and immediately after relaxing the stretch (stretch–relax). Images (left) show representative cells used to generate the box plots (right) which provide a quantitative measure of the extent of endocytosis of TMR-Dex for the indicated treatments. The uptake on stretch–relax is normalized to the steady-state uptake in the respective cell lines (n = WT MEF–Control (117), Stretch–Relax (123); Cav−/−–Control (173), Stretch–Relax (187); Dyn TKO–Control (179), Stretch–Relax (177)). b Fluid uptake in CHO cells treated with DMSO (Control) or with LG186 (10 µg/ml) (to inhibit GBF1) for 30 min, either at steady state (steady state) or immediately after relaxing the stretch (stretch–relax). Images (left) show representative cells used to generate the box plot (right) which provide a quantitative measure of the extent of endocytosis of TMR-Dex for the indicated treatments, normalized to the control steady-state condition (n = Control–Steady state (170), Stretch–Relax (189); LG186–Steady state (248), Stretch–Relax (210)). Box plot shows median, 25th and 75th percentile, and whiskers show the standard deviation. Individual data points are overlaid on box plot where each data point is the mean intensity per cell. The ‘n’ indicates total number of cells in each condition pooled from two different experiments with duplicates per experiment; *p < 0.001, ns not significant by Mann–Whitney U test. Scale bar, 10 µm
Fig. 4
Fig. 4
Temperature dependence of CG pathway and reservoir resorption. a Fluid and transferrin uptake in CHO cells (pre-equilibrated at the indicated temperatures) using TMR-Dex (Fluid) and Tf-A647 (Transferrin) for 5 min at the respective temperatures. All values were normalized to the respective mean endocytosis at 37 °C. Representative images (left) of cells used to generate the box plot (right) were obtained from two different experiments with duplicates per experiment (total number of cells = Transferrin: 37 °C (252), 30 °C (269), 25 °C (252); Fluid: 37 °C (249), 30 °C (291), 25 °C (270)). Box plot shows median, 25th and 75th percentile, and whiskers show the standard deviation. Individual data points are overlaid on box plot where each data point is the mean intensity per cell. The ‘n’ indicates total number of cells in each condition pooled from two different experiments with duplicates per experiment. Scale bar, 10 µm. b The reservoir fluorescence intensity after stretch–relax of CHO cells transfected with a fluorescent membrane marker (pEYFP-mem) was quantified as a function of time at 37 °C in the absence (37 °C control) or presence of LG186 (37 °C inhibitor), or at room temperature (26 °C control). Each point represents mean reservoir intensity over time from more than 100 reservoirs from at least 10 cells. Scale bar, 10 µm
Fig. 5
Fig. 5
CG pathway regulates membrane tension. a Cartoon shows a membrane tether attached to a polystyrene bead trapped in an optical trap, used to measure tether forces. Displacement of the bead from the center of the trap (Δx) gives an estimate of the tether force (F) of the cell (see Methods). b Tether forces from CHO cells either treated with DMSO (CHO Control) or LG186 (CHO LG186) for 30 min. The box plot shows data points, with each point corresponding to a tether per cell with data combined (n = 16 (CHO control) and 19 (CHO LG186)) from two different experiments. c Fluid uptake in wild-type (WT) MEF or conditional Dynamin TKO cells either pre-treated with DMSO control or LG186. The box plot show fluid-phase uptake normalized to that observed in untreated WT MEF cells (n = WT–Control (148), LG186 (110); TKO–Control (155), LG186 (87)). d Tether forces in WT MEF or conditional Dynamin TKO cells either pre-treated with DMSO or LG186 (n = 25 (WT MEF), 19 (DYN TKO) and 22 DYN TKO LG186)). e Fluid uptake in CHO cells treated with DMSO (Control) or with BFA (20 µg/ml) alone or with LG186 for 30 min (n = Control (309), LG186 (319), BFA (290), BFA+LG186 (247)). f Fluid uptake in HeLa cells treated with BFA or DMSO control. The box plot shows the extent of fluid-phase uptake under the indicated conditions, normalized to that observed in control (n = Control (207), BFA (193)). g Box plot shows tether forces measured in CHO or HeLa cells treated with DMSO (Control) or with BFA for 45 min (n = 17 (CHO Control), 23 (CHO BFA),18 (HeLa Control), 19 (HeLa BFA)). Box plot shows median, 25th and 75th percentile, and whiskers show the standard deviation. Individual data points are overlaid on box plot where each data point is the mean intensity per cell (c, e, f) or tether force per cell (b, d, g). The ‘n’ indicates total number of cells in each condition pooled from two different experiments with duplicates per experiment; *p < 0.001, ns not significant by Mann–Whitney U test
Fig. 6
Fig. 6
Mechanical modulation of CG molecular machinery. a GBF1–GFP punctae in WT MEF cells by live TIRF microscopy on modulating osmolarity by changing the media from isotonic (Iso) to 40% hypotonic (Hypo) and back to isotonic (Iso). b Quantification of the number of punctae per cell in (a). The GBF1 spots upon hypotonic shock and subsequent shift to isotonic medium are normalized to original number of spots in the respective cell and plotted as a box plot. Each data point is a measurement from a single cell and box plot shows data of 12 cells from two independent experiments. Scale bar, 10 µm
Fig. 7
Fig. 7
Vinculin-dependent mechanoregulation of CG pathway. a Fluid uptake in vinculin-null cells either during a 6% stretch or on relaxing this strain (n = Control (281), Stretch (229), Stretch–Relax (347)). b Fluid uptake in WT and vinculin-null MEFs in increasing hypotonic medium as indicated (n = WT MEF: 0 (425), 10(391), 20 (416), 30 (368), 50 (346); Vinculin −/−: 0 (355), 10 (376), 20 (333), 30 (342), 50 (340)). c Fluid uptake in vinculin-null cells (Vin−/−) or Vin −/− transfected with Vinculin WT (VinWT) either in isotonic medium (Iso) or in isotonic medium after a hypotonic shock for 1 min (Hypo–Iso) (n = Vin−/−–Iso (256), Hypo–Iso (272); VinWT–Iso (188), Hypo–Iso (146)). d Fluid uptake in Vin −/− or Vin −/− transfected with vinculin with talin binding mutation (Vin-A50I) either in Iso or Hypo–Iso (n = Vin−/−–Iso (251), Hypo–Iso (264); Vin-A50I–Iso (219), Hypo_Iso (190)). e Fluid uptake in Vin −/−, Vin −/− transfected with constitutively active vinculin (Vin-CA) or constitutively active vinculin with talin binding mutation (Vin-A50I-CA) in Iso or Hypo–Iso (n = Vin −/−–Iso (327), Hypo–Iso (334); Vin-CA–Iso (238), Hypo–Iso (179); Vin-A50I-CA–Iso (139), Hypo–Iso (150)). Box plot shows median, 25th and 75th percentile, and whiskers show the standard deviation. Individual data points are overlaid on box plot where each data point is the mean intensity per cell. The ‘n’ indicates total number of cells in each condition pooled from two different experiments with duplicates per experiment; *p < 0.001, ns not significant by Mann–Whitney U test. f Vinculin-null cells transfected with GBF1–GFP and imaged live using TIRF microscopy on changing media from isotonic (Iso) to 40% hypotonic (Hypo) and back to isotonic (Iso). GBF1 organization at the plasma membrane during the osmotic shifts is shown in a representative cell (left panel). Number of punctae per cell during hypotonic and isotonic shifts is normalized to the initial number of spots (gray dotted line) and plotted as a box plot. Each data point is measurement from a single cell and box plot shows data of 13 cells from two independent experiments. Scale bar, 10 µm
Fig. 8
Fig. 8
Membrane tension and vinculin. a Tether forces in WT (Vin +/+) or vinculin-null MEFs (Vin −/−) treated with LG186 (to inhibit GBF1-mediated CG pathway) compared to the control treated cells (total number of cells = 20 (Vin +/+), 25 (Vin +/+ with LG186), 25 (Vin −/−) and 29 (Vin −/− with LG186)). Vinculin-null cells show a higher basal membrane tension compared to WT MEF, while inhibiting the CG pathway drastically reduced membrane tension in both cell lines. Box plot shows median, 25th and 75th percentile, and whiskers show the standard deviation. Individual data points are overlaid on box plot where each data point is the tether force per cell. The ‘n’ indicates total number of cells in each condition pooled from two different experiments; *p < 0.001 by Mann–Whitney U test. b Feedback inhibition description provides a model for robust feedback control of membrane tension that involves slow activation and fast inhibition. To provide robust feedback control, tension set point γs should be compared to the instantaneous tension γout and compensate for the difference. See supplementary information (Supplementary Note 1) for detailed description of the mechanochemical model

References

    1. Petridou NI, Spiró Z, Heisenberg CP. Multiscale force sensing in development. Nat. Cell Biol. 2017;19:581–588. doi: 10.1038/ncb3524. - DOI - PubMed
    1. Yim EK, Sheetz MP. Force-dependent cell signaling in stem cell differentiation. Stem Cell Res. Ther. 2012;3:41. doi: 10.1186/scrt132. - DOI - PMC - PubMed
    1. Wang N, Tytell JD, Ingber DE. Mechanotransduction at a distance: mechanically coupling the extracellular matrix with the nucleus. Nat. Rev. Mol. Cell Biol. 2009;10:75–82. doi: 10.1038/nrm2594. - DOI - PubMed
    1. Diz-Muñoz A, Fletcher DA, Weiner OD. Use the force: membrane tension as an organizer of cell shape and motility. Trends Cell Biol. 2013;23:47–53. doi: 10.1016/j.tcb.2012.09.006. - DOI - PMC - PubMed
    1. Seong J, Wang N, Wang Y. Mechanotransduction at focal adhesions: from physiology to cancer development. J. Cell. Mol. Med. 2013;17:597–604. doi: 10.1111/jcmm.12045. - DOI - PMC - PubMed

Publication types