. 2018 Oct 11;8(1):15175.
doi: 10.1038/s41598-018-33290-5.

Characterizing the protective effects of SHLP2, a mitochondrial-derived peptide, in macular degeneration

Affiliations

Characterizing the protective effects of SHLP2, a mitochondrial-derived peptide, in macular degeneration

Sonali Nashine et al. Sci Rep. .

Abstract

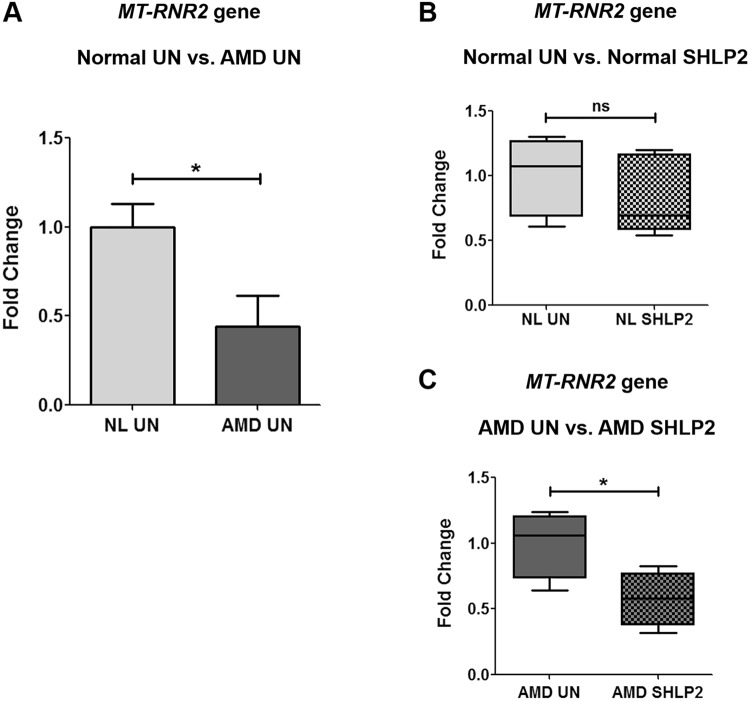
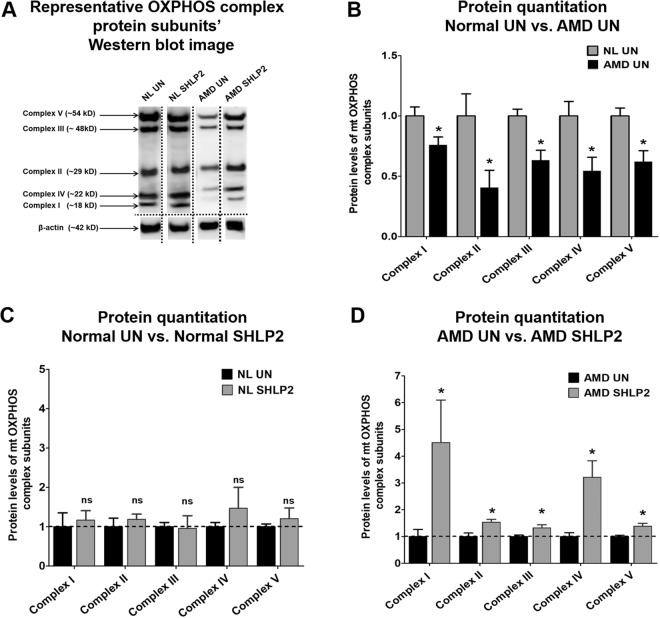
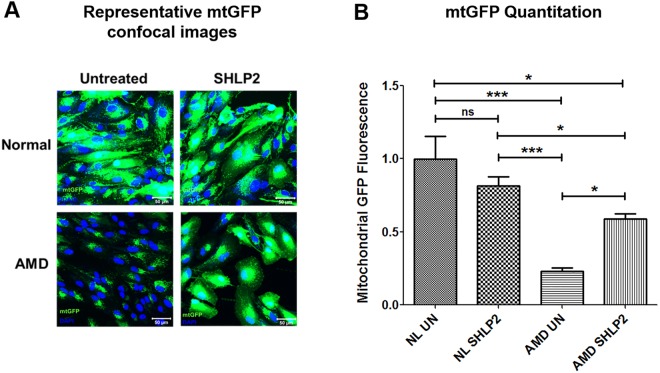
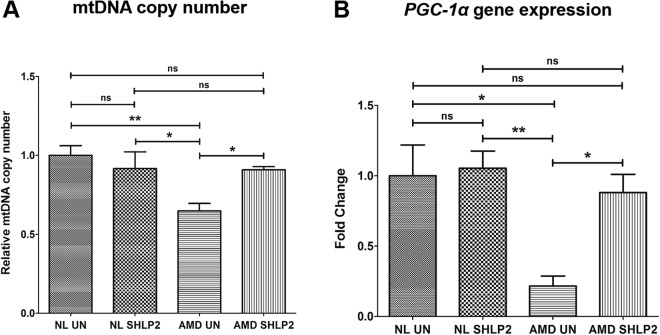
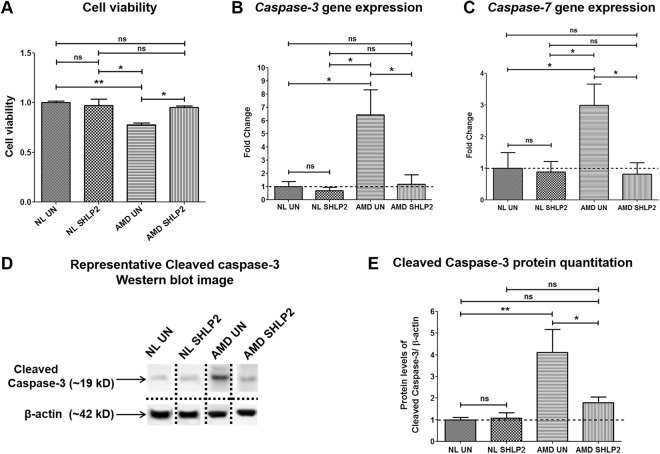
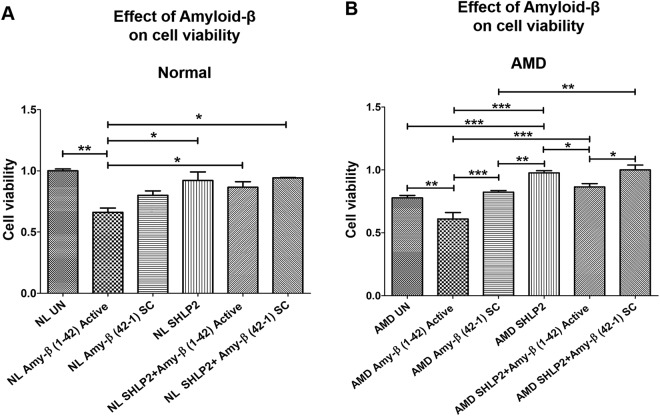
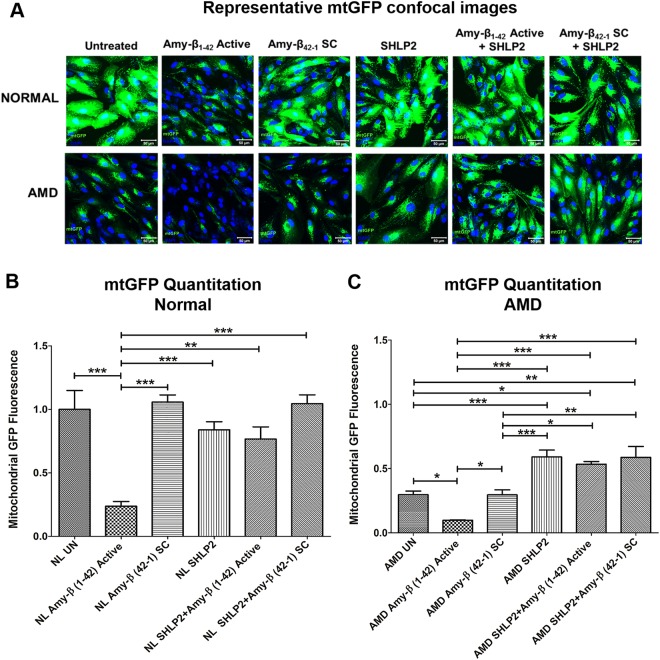
Mitochondrial-derived peptides (MDPs) are rapidly emerging therapeutic targets to combat development of neurodegenerative diseases. SHLP2 (small humanin-like peptide 2) is a newly discovered MDP that is coded from the MT-RNR2 (Mitochondrially encoded 16S rRNA) gene in mitochondrial DNA (mtDNA). In the current study, we examined the biological consequences of treatment with exogenously-added SHLP2 in an in vitro human transmitochondrial age-related macular degeneration (AMD) ARPE-19 cell model. In AMD cells, we observed significant down-regulation of the MDP-coding MT-RNR2 gene, and remarkably reduced levels of all five oxidative phosphorylation (OXPHOS) complex I-V protein subunits that are involved in the electron transport chain; these results suggested mitochondrial toxicity and abnormal OXPHOS complex protein subunits' levels in AMD cells. However, treatment of AMD cells with SHLP2: (1) restored the normal levels of OXPHOS complex protein subunits, (2) prevented loss of viable cells and mitochondria, (3) increased the number of mtDNA copies, (4) induced anti-apoptotic effects, and (5) attenuated amyloid-β-induced cellular and mitochondrial toxicity. Cumulatively, our findings established the protective role of SHLP2 in AMD cells in vitro. In conclusion, this novel study supports the merit of SHLP2 in the treatment of AMD, a primary retinal disease that is a leading cause of blindness among the elderly population in the United States as well as worldwide.


Conflict of interest statement

S.N. None; P.C. Consultant and stockholder of CohBar Inc. A.B.N. None; B.D.K. Clinical research: Alcon, Allergan, Apellis, Genentech, G.S.K. Ophthotech, Regeneron; Consultant: Alcon, Allergan, Catalyst, Genentech, Novartis, Ophthotech, Regeneron; Recipient: Allergan, Genentech, Novartis, Regeneron; M.C.K. None.

Figures

Figure 1
Figure 1
MT-RNR2 gene is down-regulated in AMD. (A) AMD cybrids had reduced MT-RNR2 gene expression (56% decrease, P = 0.03, n = 5) compared to age-matched normal (NL) cybrids. Administration of SHLP2 decreased MT-RNR2 gene expression in: (B) normal (16% decrease, P = 0.43, n = 5) and (C) AMD (42.3% decrease, P = 0.04, n = 4) cybrids. Data are presented as Mean ± SEM and normalized to untreated (UN) normal cybrids which were assigned a value of 1. Experiments were performed at the 72 hr time-point.
Figure 2
Figure 2
SHLP2 restores the OXPHOS complex I-V subunit protein levels to normal. (A) This figure shows representative Western blot images for OXPHOS subunit proteins and the loading control β-actin. The dotted lines demarcate the borders of cropped images for each of the four groups i.e., Normal untreated (NL UN), Normal SHLP2-treated, AMD untreated (AMD UN), and AMD SHLP2-treated. Full-length blots are presented in Supplementary Figures S1A, S1B, S2A and S2B. Loading control β-actin was run on the same gel. (B) A drastic decline in the protein levels of OXPHOS Complex I subunit (24%, P = 0.04, n = 5), Complex II subunit (59%, P = 0.04, n = 4), Complex III subunit (37%, P = 0.013, n = 3–4), Complex IV subunit (46%, P = 0.04, n = 3–4), and Complex V subunit (38%, P = 0.01, n = 4) was observed in AMD cybrids compared to those in normal cybrid cells. (C) The levels of OXPHOS complex proteins remained unchanged in normal cybrids treated with SHLP2 (P > 0.05, n = 4–5), compared to their untreated counterparts. (D) Addition of SHLP2 to AMD cybrids increased protein levels of Complex I subunit (350.8%, P = 0.028, n = 3–5), Complex II subunit (54%, P = 0.01, n = 5), Complex III subunit (32%, P = 0.03, n = 5), Complex IV subunit (221%, P = 0.03, n = 3–4), Complex V subunit (38%, P = 0.03, n = 3–4). Data are presented as Mean ± SEM. Data in Fig. B and Fig. C are normalized to untreated normal cybrids which were assigned a value of 1. Data in Fig. D are normalized to untreated AMD cybrids which were assigned a value of 1. Experiments were performed at the 72 hr time-point.
Figure 3
Figure 3
SHLP2 prevents loss of mitochondria. (A) Representative confocal images showing: (1) Relatively abundant mtGFP staining in normal (NL) untreated (UN) (top left panel) and NL SHLP2-treated (top right panel) cybrid cells, and (2) drastic increase in mtGFP staining in SHLP2-treated AMD cybrids (lower right panel) compared to AMD UN cybrids (lower left panel). Scale bar equals 50 µm; Green color represents mitochondrial GFP (mtGFP); Blue color represents DAPI (nuclear stain)). (B) Quantitation of the images showed that SHLP2 increased mtGFP fluorescence by 153.02% (P < 0.05, n = 4–5) in the cytoplasm of AMD cybrid cells. All mtGFP fluorescence intensities within a group were normalized to DAPI. Data are presented as Mean ± SEM and normalized to untreated normal cybrids which were assigned a value of 1. Experiments were performed at the 72 hr time-point.
Figure 4
Figure 4
SHLP2 increases mtDNA copy number and PGC-1α gene expression. (A) Bar graph showing the effects of SHLP2 treatment on mtDNA copy number in normal (NL) and AMD cybrids. No significant difference in mtDNA copy number was observed between untreated (UN) NL and SHLP2-treated NL cybrids (bar 1 vs. bar 2). Significant increase in mtDNA copy number was observed in SHLP2-treated AMD cybrids compared to untreated AMD cybrids (40.3%, P < 0.05, n = 4) (bar 3 vs. bar 4). (B) Bar graph showing the effects of SHLP2 treatment on PGC-1α gene expression in normal (NL) and AMD cybrids. No significant difference in PGC-1α gene expression was observed between untreated (UN) NL and SHLP2-treated NL cybrids (bar 1 vs. bar 2). However, treatment with SHLP2 caused significant increase in PGC-1α gene expression in AMD cybrids compared to their untreated counterparts (307.87%, P < 0.05, n = 4) (bar 3 vs. bar 4). Data are presented as Mean ± SEM and normalized to untreated normal cybrids which were assigned a value of 1. Experiments were performed at the 72 hr time-point.
Figure 5
Figure 5
SHLP2 prevents loss of viable cells and reduces apoptosis. (A) Treatment with SHLP2 did not bring about any differences in cell viability between the untreated normal (NL UN) and SHLP2-treated normal (NL SHLP2) cybrids (P > 0.05, n = 4). However, SHLP2 protected AMD cybrids from loss of viable cells (21.79% increase, P < 0.05, n = 4). (B) SHLP2 treatment significantly decreased the expression of Caspase-3 gene (81.8%, P < 0.05, n = 4) in AMD cybrids and caused no change in normal cybrids. (C) SHLP2 down-regulated Caspase-7 gene (72.48%, P < 0.05, n = 4–5) in AMD cybrids with no effect in normal cybrids. (D) Representative Western blot images for cleaved Caspase-3 protein and β-actin. The dotted lines demarcate the borders of cropped images for each of the four groups i.e., Normal untreated (NL UN), Normal SHLP2-treated, AMD untreated (AMD UN), and AMD SHLP2-treated. Full-length blots are presented in Supplementary Figs S3A, S3B, S4A, and S4B. Loading control β-actin was run on the same gel. (E) Quantitation graphs showed that SHLP2 reduced Cleaved Caspase-3 protein levels in AMD cybrids by 56.45% (P < 0.05, n = 4–5). No significant difference was observed between untreated and SHLP2-treated normal cybrids (P > 0.05, n = 4–5). Data are presented as Mean ± SEM and normalized to normal cybrids which were assigned a value of 1. Experiments were performed at the 72 hr time-point.
Figure 6
Figure 6
SHLP2 protects against Amyloid-β-induced cell death. (A) Addition of amyloid-β1–42 active peptide diminished the number of viable cells in normal (NL) cybrid cells compared to their untreated (UN) counterparts (bar 1 vs. bar 2). No significant difference in cell viability was observed between untreated and amyloid-β42–1 SC-treated NL cybrids (bar 1 vs. bar 3). Treatment with SHLP2 significantly increased the cell viability in amyloid-β1–42-treated NL (bar 5) and amyloid-β42–1 SC-treated NL cybrids (bar 6) compared to the ones treated with amyloid-β1–42 alone (bar 2). (B) Amyloid-β1–42-treated AMD cybrids showed reduced number of viable cells compared to the untreated group (bar 1 vs. bar 2) and the amyloid-β42–1 SC-treated group (bar 2 vs. bar 3). SHLP2 pretreatment resulted in a drastic increase in cell viability in amyloid-β1–42-treated (bar 5) and amyloid-β42–1 SC-treated (bar 6) AMD cybrids compared to the AMD cybrids treated with amyloid-β1–42 alone (bar 2). Data are presented as Mean ± SEM and normalized to untreated-normal cybrids which were assigned value of 1. Experiments were performed at the 72 hr time-point.
Figure 7
Figure 7
SHLP2 protects against Amyloid-β-induced mitochondrial damage. (A) Representative confocal images showing mtGFP staining in untreated, amyloid-β1–42-treated, amyloid-β42-1 SC-treated, SHLP2-treated, SHLP2 + amyloid-β1–42-treated, and SHLP2 + amyloid-β42-1-treated normal and AMD cybrid cells. (B) Quantitation graphs for normal cybrids, (C) Quantitation graphs for AMD cybrids. Scale bar equals 50 µm; Green color represents mitochondrial GFP (mtGFP); Blue color represents DAPI (nuclear stain)). This experiment showed: (1) reduced mtGFP signal in amyloid-β1–42-treated (amyloid-β1–42 Active) normal (7A top panel-2nd image, (77% decrease- 7B)) and AMD (7A bottom panel–2nd image; 65% decrease-7C) cybrids compared to their untreated counterparts (7A-NL UN: top panel-1st image; AMD UN: bottom panel-1st image); (2) No significant difference in mtGFP signal was observed between untreated and amyloid-β42–1 SC-treated normal (7A-top panel-3rd image) or AMD (7A-bottom panel-3rd image) cybrids; (3) Addition of SHLP2 increased mtGFP signal in amyloid-β1–42-treated (amyloid-β1–42 Active) normal (7A top panel-5th image; 223.2% increase-7B) but caused no significant change in amyloid-β42–1 SC-treated normal (7A top panel–6th image); (4) SHLP2 enhanced mtGFP fluorescence intensity in amyloid-β1–42-treated (amyloid-β1–42 Active) AMD (7A bottom panel-5th image; 451.02% increase-7C) and in amyloid-β42–1 SC-treated AMD (7A bottom panel-6th image; 83.81% increase-7C). Data are presented as Mean ± SEM and normalized to untreated normal cybrids which were assigned a value of 1. Experiments were performed at the 72 hr time-point.

References

    1. Al-Zamil WM, Yassin SA. Recent developments in age-related macular degeneration: a review. Clin Interv Aging. 2017;12:1313–1330. doi: 10.2147/CIA.S143508. - DOI - PMC - PubMed
    1. Barot M, Gokulgandhi MR, Mitra AK. Mitochondrial dysfunction in retinal diseases. Curr Eye Res. 2011;36:1069–77. doi: 10.3109/02713683.2011.607536. - DOI - PMC - PubMed
    1. Nashine S, et al. Differential Expression of Complement Markers in Normal and AMD Transmitochondrial Cybrids. PLoS One. 2016;11:e0159828. doi: 10.1371/journal.pone.0159828. - DOI - PMC - PubMed
    1. Nashine S, et al. Humanin G (HNG) protects age-related macular degeneration (AMD) transmitochondrial ARPE-19 cybrids from mitochondrial and cellular damage. Cell Death Dis. 2017;8:e2951. doi: 10.1038/cddis.2017.348. - DOI - PMC - PubMed
    1. Lee C, Yen K, Cohen P. Humanin: a harbinger of mitochondrial-derived peptides? Trends Endocrinol Metab. 2013;24:222–8. doi: 10.1016/j.tem.2013.01.005. - DOI - PMC - PubMed

Publication types

MeSH terms

Substances