. 2018 Oct 11;8(1):15120.
doi: 10.1038/s41598-018-33275-4.

Antibiotic export by efflux pumps affects growth of neighboring bacteria

Affiliations

Antibiotic export by efflux pumps affects growth of neighboring bacteria

Xi Wen et al. Sci Rep. .

Abstract

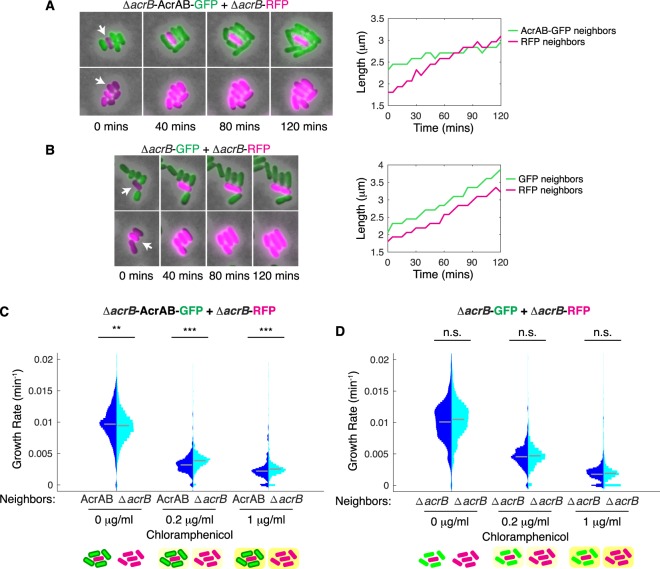
Cell-cell interactions play an important role in bacterial antibiotic resistance. Here, we asked whether neighbor proximity is sufficient to generate single-cell variation in antibiotic resistance due to local differences in antibiotic concentrations. To test this, we focused on multidrug efflux pumps because recent studies have revealed that expression of pumps is heterogeneous across populations. Efflux pumps can export antibiotics, leading to elevated resistance relative to cells with low or no pump expression. In this study, we co-cultured cells with and without AcrAB-TolC pump expression and used single-cell time-lapse microscopy to quantify growth rate as a function of a cell's neighbors. In inhibitory concentrations of chloramphenicol, we found that cells lacking functional efflux pumps (ΔacrB) grow more slowly when they are surrounded by cells with AcrAB-TolC pumps than when surrounded by ΔacrB cells. To help explain our experimental results, we developed an agent-based mathematical model, which demonstrates the impact of neighbors based on efflux efficiency. Our findings hold true for co-cultures of Escherichia coli with and without pump expression and also in co-cultures of E. coli and Salmonella typhumirium. These results show how drug export and local microenvironments play a key role in defining single-cell level antibiotic resistance.


Conflict of interest statement

The authors declare no competing interests.

Figures

Figure 1
Figure 1
Neighbors with pumps impact cell growth. (A) Schematic showing when ΔacrB cells are surrounded by cells with AcrAB-TolC pumps they grow more slowly than when surrounded by other ΔacrB cells. (B) Growth rates of wild type cells expressing gfp (WT-GFP) and ΔacrB cells expressing rfpacrB-RFP). Cells were mixed in ratios of 5:1 and 1:5 and the growth rate of ΔacrB-RFP cells was then quantified for the two different ratios. (C) Growth rates of wild type cells, given WT-GFP or ΔacrB-RFP neighbors. For (B,C) statistical significance was calculated using the Kolmogorov-Smirnov test, where ***p < 0.001, n.s.: not significant. Gray bars show mean growth rate. Distribution mean, standard deviation, and p-values are listed in Table S1. Plot axis limits were set to show >97% of cells; however full data set including outliers and n values (number of cells) for each are shown in Fig. S2. Schematics under (B,C) show the type of neighbors surrounding the cell in the middle whose growth rate is calculated. Background color indicates presence of antibiotics.
Figure 2
Figure 2
ΔacrB cells with and without acrAB complementation show neighbor-dependent differences in growth. (A) ΔacrB-RFP and AcrAB-GFP cells were mixed in ratios of 1:5 and 5:1 and grown on agarose pads with 0.2 µg/ml chloramphenicol. Left panel is representative series of time-lapse images showing growth of a ΔacrB-RFP cell surrounded by AcrAB-GFP neighbors. Right panel shows the cell length over time for the cell indicated with an arrow in the left panel. (B) ΔacrB-RFP and ΔacrB-GFP cells for conditions as described in (A). Length data for all cells for conditions from (A,B) are shown in Fig. S3. (C) Growth rates of ΔacrB-RFP cells with either AcrAB-GFP or ΔacrB-RFP neighbors quantified at different chloramphenicol concentrations. (D) Growth rates of ΔacrB-RFP cells with either ΔacrB-GFP or ΔacrB-RFP neighbors. Statistical significance was calculated using the Kolmogorov-Smirnov test. ***p < 0.001; **p < 0.01; n.s.: not significant. Gray bars show mean growth rate. Distribution mean, standard deviation, and p-values are listed in Table S1. Full data set including outliers and n values are shown in Fig. S2. Schematics under (C,D) show the type of neighbors surrounding the cell in the middle whose growth rate is calculated. Background color indicates antibiotic concentration.
Figure 3
Figure 3
Relative abundance of ΔacrB cells decreases when they have AcrAB-GFP neighbors. (A) Relative abundance was calculated using the data set in Fig. 2C, where we define relative abundance as the fraction of the biomass ΔacrB-RFP cells make up at the end, divided by their fraction at the start. (B) Relative abundance calculated using the data set in Fig. 2D. Dashed line at one indicates value if there is no change in the abundance of ΔacrB-RFP cells over time. Error bars show standard deviation between replicates. Schematics under plots show the type of neighbors surrounding the cell in the middle whose growth rate is calculated. Background color indicates antibiotic concentration.
Figure 4
Figure 4
Model predicts cell growth rate differences under antibiotic conditions. (A) Schematic depicting the spatial relationship between the focal cell in the center, its neighbors, and the environment. (B) Biomass and intracellular chloramphenicol concentration of ΔacrB cells with wild type neighbors or ΔacrB neighbors simulated in an environment with 0.1 µg/mL of chloramphenicol. (C) Cell growth of ΔacrB cells with different chloramphenicol concentrations given wild type or ΔacrB neighbors. Growth rate is calculated as the average change in biomass divided by the time simulated. Model parameters and initial conditions are listed in Table S2. (D) Cell growth under ciprofloxacin treatment for the same cell configurations as in (C). (E) ΔacrB-RFP and AcrAB-GFP cells were mixed in different ratios (1:5 or 5:1) and grown on agarose pads with ciprofloxacin. Statistical significance was calculated using the Kolmogorov-Smirnov test, where n.s.: not significant. Gray bars show mean growth rate. Distribution mean, standard deviation, and p-values are listed in Table S1. Full data set including outliers and n values for each are shown in Fig. S2. Schematics under (CE) show the type of neighbors surrounding the cell in the middle whose growth rate is calculated. Background color indicates presences of antibiotics.
Figure 5
Figure 5
E. coli and S. typhimurium co-culture. S. typhimurium cells were mixed with either WT-GFP or ΔacrB-RFP E. coli. Statistical significance was calculated using the Kolmogorov-Smirnov test. ***p < 0.001. Gray bars show mean growth rate. Distribution mean, standard deviation, and p-values are listed in Table S1. Full data set including outliers and n values for each are shown in Fig. S2. Schematic under plot shows the type of neighbors surrounding the cell in the middle whose growth rate is calculated. Background color indicates antibiotic concentration.

References

    1. Brauner A, Fridman O, Gefen O, Balaban NQ. Distinguishing between resistance, tolerance and persistence to antibiotic treatment. Nature Reviews Microbiology. 2016;14:320–330. doi: 10.1038/nrmicro.2016.34. - DOI - PubMed
    1. Bos J, et al. Emergence of antibiotic resistance from multinucleated bacterial filaments. Proceedings Of The National Academy Of Sciences Of The United States Of America. 2015;112:178–183. doi: 10.1073/pnas.1420702111. - DOI - PMC - PubMed
    1. Zhang Q, et al. Acceleration of Emergence of Bacterial Antibiotic Resistance in Connected Microenvironments. Science (New York, NY) 2011;333:1764–1767. doi: 10.1126/science.1208747. - DOI - PubMed
    1. El Meouche I, Siu Y, Dunlop MJ. Stochastic expression of a multiple antibiotic resistance activator confers transient resistance in single cells. Scientific reports. 2016;6:19538. doi: 10.1038/srep19538. - DOI - PMC - PubMed
    1. Levin-Reisman Irit, Ronin Irine, Gefen Orit, Braniss Ilan, Shoresh Noam, Balaban Nathalie Q. Antibiotic tolerance facilitates the evolution of resistance. Science. 2017;355(6327):826–830. doi: 10.1126/science.aaj2191. - DOI - PubMed

Publication types

MeSH terms