. 2018 Apr 26;7(5):848-858.
doi: 10.1039/c8tx00100f. eCollection 2018 Sep 1.

Oxidative stress and mitochondrial impairment mediated apoptotic cell death induced by terpinolene in Schizosaccharomyces pombe

Affiliations

Oxidative stress and mitochondrial impairment mediated apoptotic cell death induced by terpinolene in Schizosaccharomyces pombe

Hizlan H Agus et al. Toxicol Res (Camb). .

Abstract

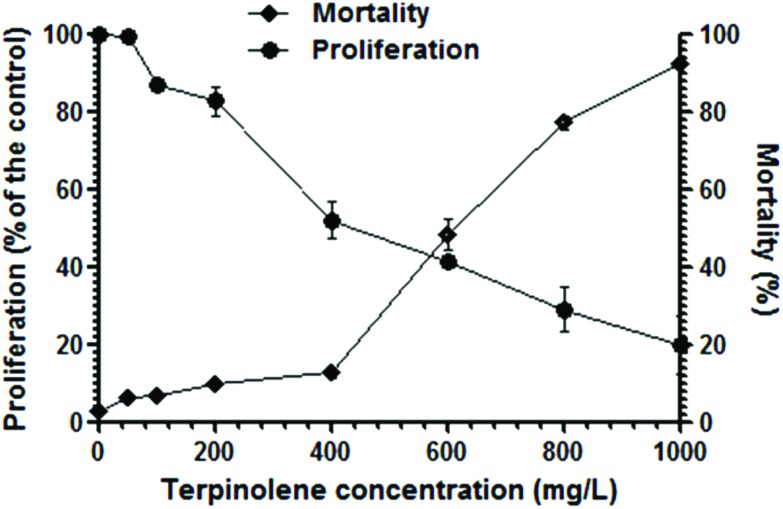
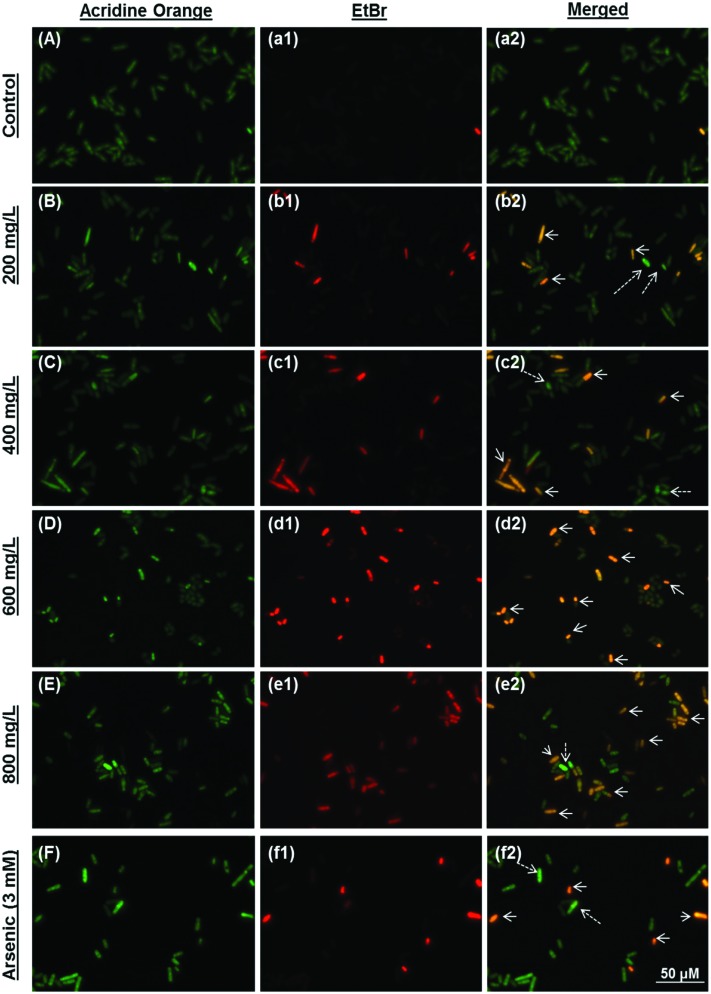
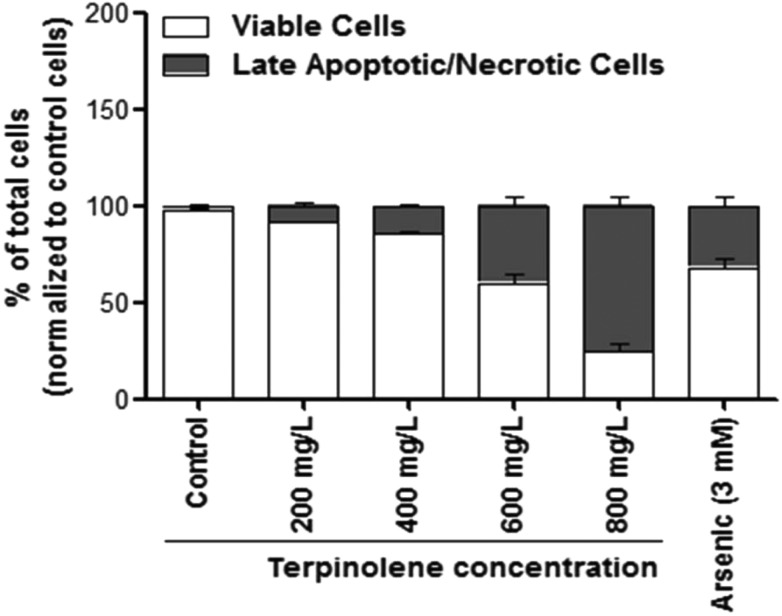
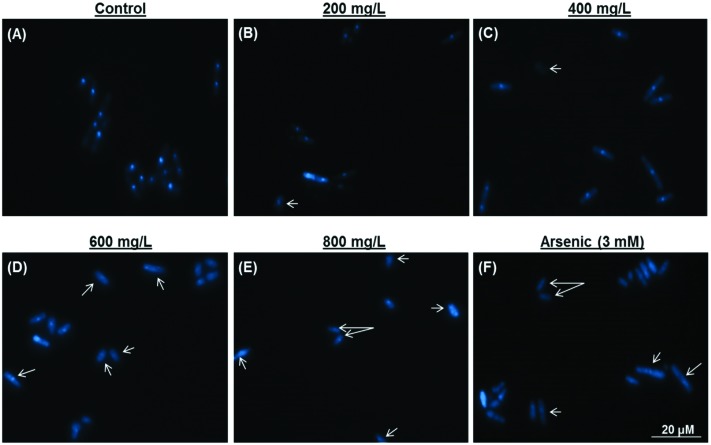
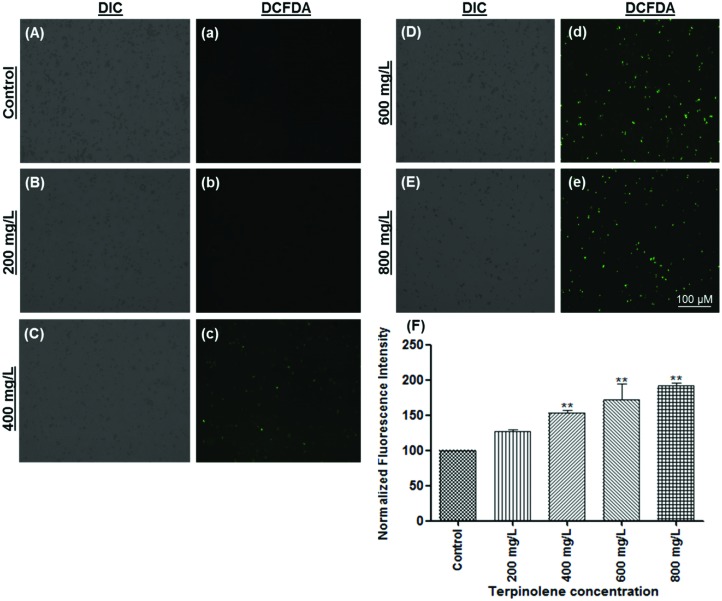
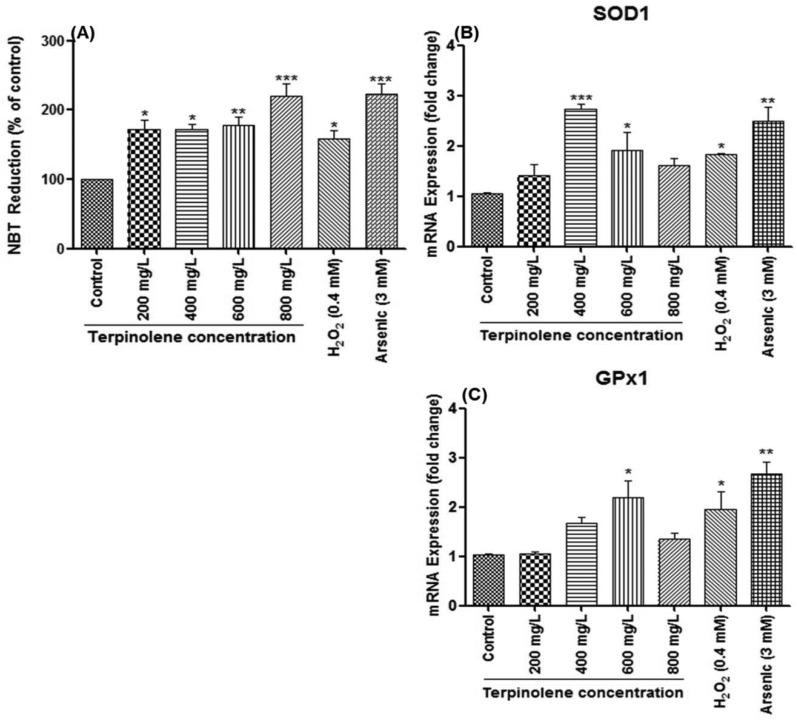
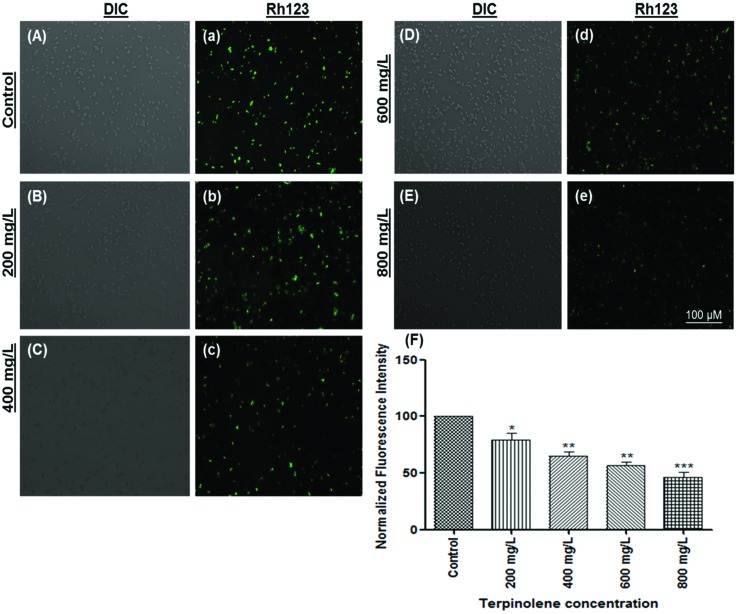
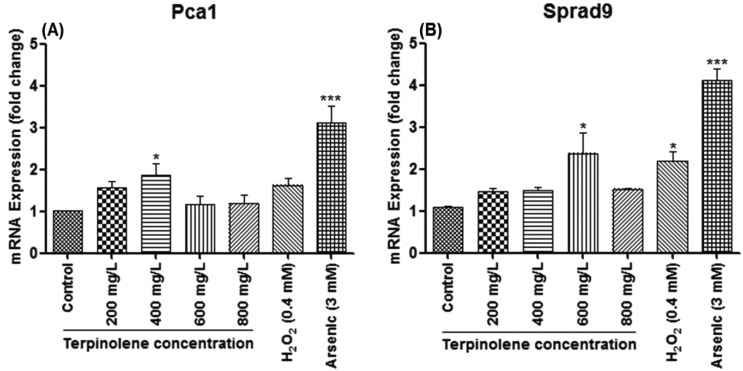
Terpinolene is one of the most abundant monoterpenes used as a food supplement or odorant in cosmetics and the pharmaceutical industry. In this study, we aimed to assess apoptotic, oxidative and cytotoxic effects of terpinolene. We used the fission yeast (Schizosaccharomyces pombe) as a promising uni-cellular model organism in molecular toxicology and cell death research, due to its resemblance to mammalian cells at the molecular level. After terpinolene exposure (200-800 mg L-1), the IC50 and LC50 were calculated as 349.17 mg L-1 and 593.87 mg L-1. Cells, stained with acridine orange/ethidium bromide and DAPI, showed apoptotic nuclear morphology, chromatin condensation and fragmentation. 2,7-Dichlorodihydrofluorescein diacetate (DCFDA) fluorescence gradually increased (1.5-2-fold increase) in correlation with increasing concentrations of terpinolene (200-800 mg L-1). Mitochondrial impairment at higher concentrations of terpinolene (400-800 mg L-1) was shown by Rhodamine 123 staining. Real-time PCR experiments showed significant increases (1.5-3-fold) in SOD1 and GPx1 levels (p < 0.05) as well as 2-2.5-fold increases (p < 0.05) in pro-apoptotic factors, Pca1 and Sprad9. The potential effects of terpinolene on programmed cell death and the underlying mechanisms were clarified in unicellular model fungi, Schizosaccharomyces pombe.


Figures

Fig. 1
Fig. 1. Cell proliferation and viability after exposure to 0–1000 mg L–1 terpinolene solutions for 3 h. Cell proliferation was assessed by a hemocytometer. Mortality of cells was assessed by the Methylene Blue assay. Values are presented as mean ± SEM. Calculations were made from at least five independent biological replica (n = 5).
Fig. 2
Fig. 2. Apoptosis of S. pombe cells was evaluated using acridine orange–ethidium bromide dual staining. Viable, early and late apoptotic/necrotic cells were visualized using a fluorescent microscope after exposure to 0 (A, a1 and a2), 200 (B, b1 and b2), 400 (C, c1 and c2), 600 (D, d1 and d2), 800 (E, e1 and e2) mg L–1 terpinolene and 3 mM arsenic(iii) (F, f1, f2) solutions. Arsenic(iii) was used as a positive control. Arrows: Late apoptotic/necrotic cells; dashed arrows: early apoptotic cells. At least 200 cells were counted in each biological replica (n = 5).
Fig. 3
Fig. 3. Percentage of viable and late apoptotic/necrotic cells after exposure to 0–800 mg L–1 terpinolene and 3 mM arsenic solutions. At least 200 cells were counted in each biological replica. A small number of early apoptotic cells were ignored. Values are presented as mean ± SEM. Calculations were made from at least five independent biological replicas (n = 5).
Fig. 4
Fig. 4. Nuclear morphology was evaluated using 4,6-diamidino-2-phenylindole (DAPI) staining after exposure to 0 (A), 200 (B), 400 (C), 600 (D), 800 (E) mg L–1 terpinolene and 3 mM arsenic(iii) (F) solutions. Arsenic(iii) was used as a positive control. Arrows: Degraded and fragmented DNA. Images were taken using a fluorescent microscope from at least three independent biological replica (n = 3).
Fig. 5
Fig. 5. Measurement of ROS levels using DCFDA (2′,7′-dichlorofluorescin diacetate) staining. ROS generation of cells exposed to 0 (A and a), 200 (B and b), 400 (C and c), 600 (D and d) and 800 (E and e) mg L–1 was visualized and measured by a fluorescence microscope. (F) ROS generation of cells exposed to 0–800 mg L–1 terpinolene was calculated as normalized fluorescence intensity. Values are presented as mean ± SEM. Statistical analysis was made to compare experimental groups and the control group. Significantly different values are indicated by asterisks (One-way ANOVA, **p < 0.01). Images were taken from at least three independent biological replicas (n = 3).
Fig. 6
Fig. 6. Cellular ROS levels and gene expression levels of antioxidant enzymes. (A) ROS levels in cells exposed to 0–800 mg L–1 terpinolene were measured by the NBT (3,3′-(3,3′-dimethoxy-4,4′-biphenylene)bis[2-(4-nitrophenyl)-5-phenyl-2H-tetrazolium chloride) assay. ROS generation of cells was determined as absorbance of reduced NBT at 620 nm in a microplate reader and expressed as normalized NBT reduction compared to the control group. (B and C) mRNA levels of SOD1 and GPx1 in cells exposed to 0–800 mg L–1 were measured by RT-PCR. Values are presented as mean ± SEM. Statistical analysis was made to compare experimental groups and the control group. Significantly different values are indicated by asterisks (One-way ANOVA, *p < 0.05, **p < 0.01, ***p < 0.001). Values were taken from at least three independent biological replicas (n = 3).
Fig. 7
Fig. 7. The mitochondrial transmembrane potential (MTP) of S. pombe cells was evaluated using Rhodamine123. The MTP of cells exposed to 0 (A and a), 200 (B and b), 400 (C and c), 600 (D and d) and 800 (E and e) mg L–1 terpinolene solutions was visualized and measured by a fluorescence microscope. (F) Dose-dependent decline in the fluorescent intensity of cells exposed to increasing concentrations of terpinolene (0–800 mg L–1) was measured as normalized fluorescence intensity. Values are presented as mean ± SEM. Statistical analysis was made to compare experimental groups and the control group. Significantly different values are indicated by asterisks (One-way ANOVA, *p < 0.05, **p < 0.01, ***p < 0.001). Images were taken from at least three independent biological replicas (n = 3).
Fig. 8
Fig. 8. Apoptosis-related mRNA expression in S. pombe cells exposed to 0–800 mg L–1 terpinolene. mRNA levels of Pca1 and Sprad9 were measured by RT-PCR. Values are presented as mean ± SEM. Statistical analysis was made to compare experimental groups and the control group. Significantly different values are indicated by asterisks (One-way ANOVA, *p < 0.05, ***p < 0.001). Values were taken from at least three independent biological replicas (n = 3).

References

    1. Farooq A., Choudhary M. I., Rahman A. U., Tahara S., Başer K. H. C., Demirci F. Z. Naturforsch., C: J. Biosci. 2002;57:863–866. - PubMed
    1. Dawid-Pać R. Postep Derm. Alergol. 2013;30:170–177. - PMC - PubMed
    1. Trombetta D., Castelli F., Sarpietro M. G., Venuti V., Cristani M., Daniele C., Saija A., Mazzanti G., Bisignano G. Antimicrob. Agents Chemother. 2005;49:2474–2478. - PMC - PubMed
    1. Chueca B., Pagán R., García-Gonzalo D. Int. J. Food Microbiol. 2014;189:126–131. - PubMed
    1. Masten S. and Haneke K. E., Toxicological Summary For Turpentine [8006-64-2], https://ntp.niehs.nih.gov/ntp/htdocs/chem_background/exsumpdf/turpentine....