. 2017 Sep 19;4(3):ofx173.
doi: 10.1093/ofid/ofx173. eCollection 2017 Summer.

Ongoing HIV Replication During ART Reconsidered

Affiliations

Ongoing HIV Replication During ART Reconsidered

Mary F Kearney et al. Open Forum Infect Dis. .

Abstract

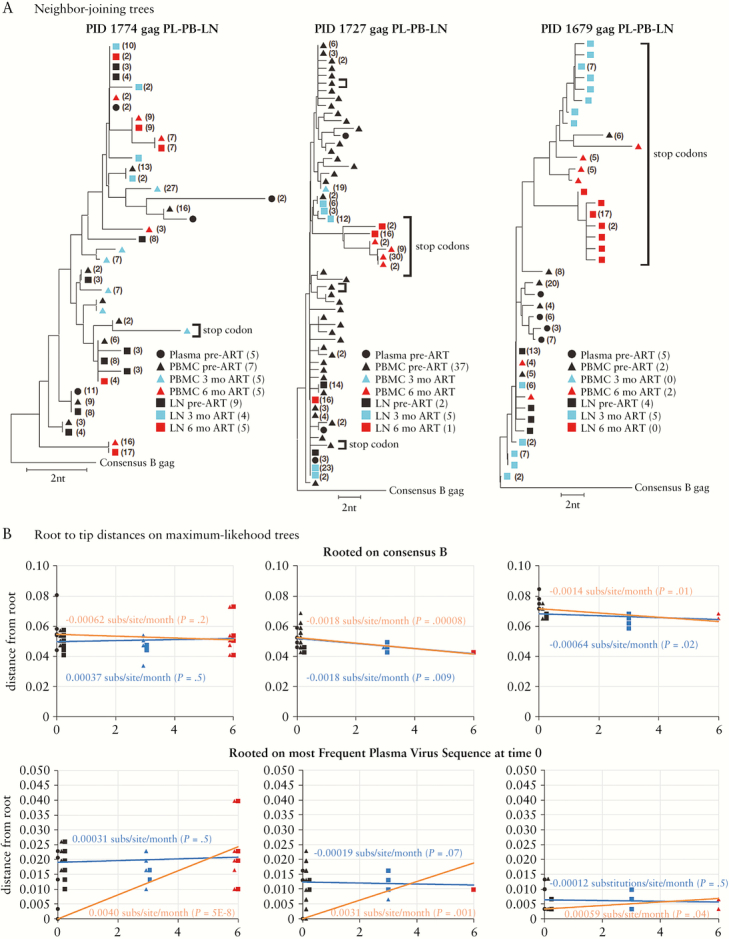
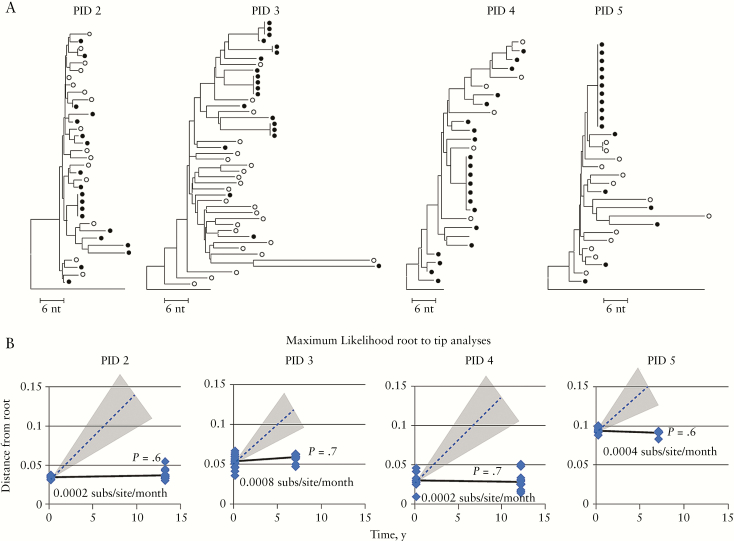
Lorenzo-Redondo et al. recently analyzed HIV RNA sequences in plasma virus and proviral DNA sequences in lymph nodes (LN) and peripheral blood mononuclear cells (PBMC) from samples collected over a 6-month period from 3 individuals following initiation of antiretroviral therapy (ART) and concluded that ongoing HIV replication occurred in LN despite ART and that this replication maintained the HIV reservoir. We analyzed the same sequences and found that the dataset was very limited (median of 5 unique RNA or DNA sequences per sample) after accounting for polymerase chain reaction resampling and hypermutation and that the few remaining DNA sequences after 3 and 6 months on ART were not more diverse or divergent from those in pre-ART in any of the individuals studied. These findings, and others, lead us to conclude that the claims of ongoing replication on ART made by Lorenzo-Redondo et al. are not justified from the dataset analyzed in their publication.

Keywords: HIV evolution; HIV reservoir; clonal expansion; lymph nodes; ongoing replication on ART; single-genome sequencing.


Figures

Figure 1.
Figure 1.
(A) Neighbor-joining trees of all gag sequences from Lorenzo-Redondo et al. (their Table S1) rooted on the consensus subgroup B HIV sequence. The numbers in parentheses indicate the frequencies of each variant (referred to by the authors [5] as “haplotype”) in the data set. Those without numbers were a single sequence in the dataset. Sequences with stop codons (mostly hypermutant) are labeled. The arrows indicate the most frequent plasma virus RNA sequences used by Lorenzo-Redondo [5], as described in the legend of their Extended Data Table 1, as the baseline for calculation of evolutionary rates. We note that 4 of the 5 the sequence sets comprising sequences from 6 months on antiretroviral therapy in peripheral blood mononuclear cell (red triangles) in PID 1774, and lymph node (red squares) are identical, which is unlikely to have occurred in vivo. (B) Plots of the distances of each sequence from the root of maximum likelihood trees versus time. Two different rootings were used as indicated. Distances of the DNA sequences from this root are plotted by linear regression using either the DNA sequences only (blue lines) or excluding the time 0 DNA sequences (orange lines), starting with the most frequent time 0 plasma virus RNA sequence (bottom panels), as was used by Lorenzo-Redondo et al. to calculate substitution rate. The slopes of the regression lines (in substitutions/site/month) are shown for each method, along with the P value relative to a line of 0 slope (in parentheses). Some of the 0-, 3-, and 6-month points are slightly shifted for clarity. ART, antiretroviral therapy; LN, lymph node, PBMC, peripheral blood mononuclear cell.
Figure 2.
Figure 2.
(A) Neighbor-joining trees of sequences from PIDs 2–5 of Figure 1 of Maldarelli et al. (GenBank accession numbers KX018120 to KX018257) [2]. Single-genome sequences was performed as described on peripheral blood mononuclear cell (PBMC) DNA samples [2]. Sequence alignments were performed by Muscle or manually. NJ trees were generated in MEGA 6.06. Open circles denote baseline PBMC DNA sequences; filled circles, PBMC sequences after ≥7 years on suppressive antiretroviral therapy (ART). (B) The best fit evolutionary model was determined using jModelTest2 and ML trees were generated with PAUP for root-to-tip distances, which were calculated with TreeStat (v. 1.6.2). Plots of the distances of each sequence from the root (consensus B) of ML trees versus time (solid lines) is shown, as compared with the rate of evolution during ART reported by Lorenzo-Redondo et al. (mean dashed line, range in shading (6.24 to 10.3 × 10⁻⁴ substitutions/site/month)). Note that the mean root-to-tip distance of the only participant showing any positive difference between the first and last points (0.0008 substitutions/site/year) is about 12-fold less than the rate reported by Lorenzo-Redondo et al.

References

    1. Kearney MF, Spindler J, Shao W, et al. . Lack of detectable HIV-1 molecular evolution during suppressive antiretroviral therapy. PLoS Pathog. 2014;10:e1004010. - PMC - PubMed
    1. Maldarelli F, Wu X, Su L, et al. . HIV latency. Specific HIV integration sites are linked to clonal expansion and persistence of infected cells. Science. 2014;345:179–83. - PMC - PubMed
    1. Simonetti FR, Sobolewski MD, Fyne E, et al. . Clonally expanded CD4+ T cells can produce infectious HIV-1 in vivo. Proc Natl Acad Sci U S A. 2016;113:1883–8. - PMC - PubMed
    1. Ho YC, Shan L, Hosmane NN, et al. . Replication-competent noninduced proviruses in the latent reservoir increase barrier to HIV-1 cure. Cell. 2013;155:540–51. - PMC - PubMed
    1. Lorenzo-Redondo R, Fryer HR, Bedford T, et al. . Persistent HIV-1 replication maintains the tissue reservoir during therapy. Nature. 2016;530:51–6. - PMC - PubMed