Review
. 2019 Mar;28(3):487-501.
doi: 10.1002/pro.3526. Epub 2018 Dec 13.

Structural biology of G protein-coupled receptor signaling complexes

Affiliations
Review

Structural biology of G protein-coupled receptor signaling complexes

X Edward Zhou et al. Protein Sci. 2019 Mar.

Abstract

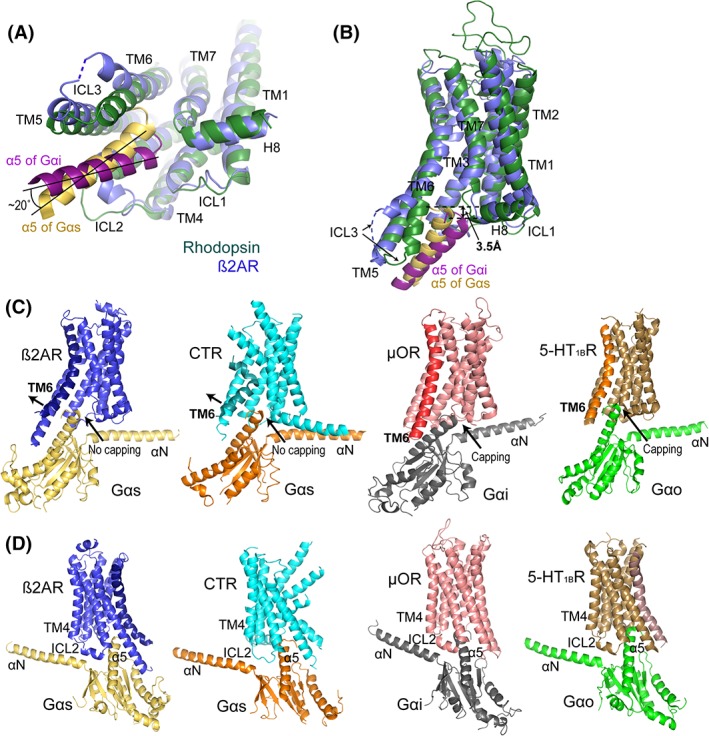
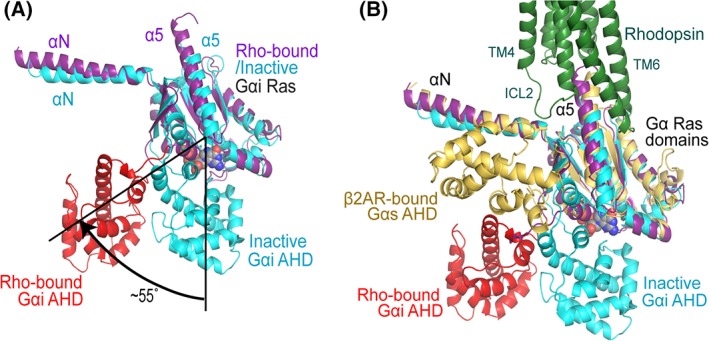
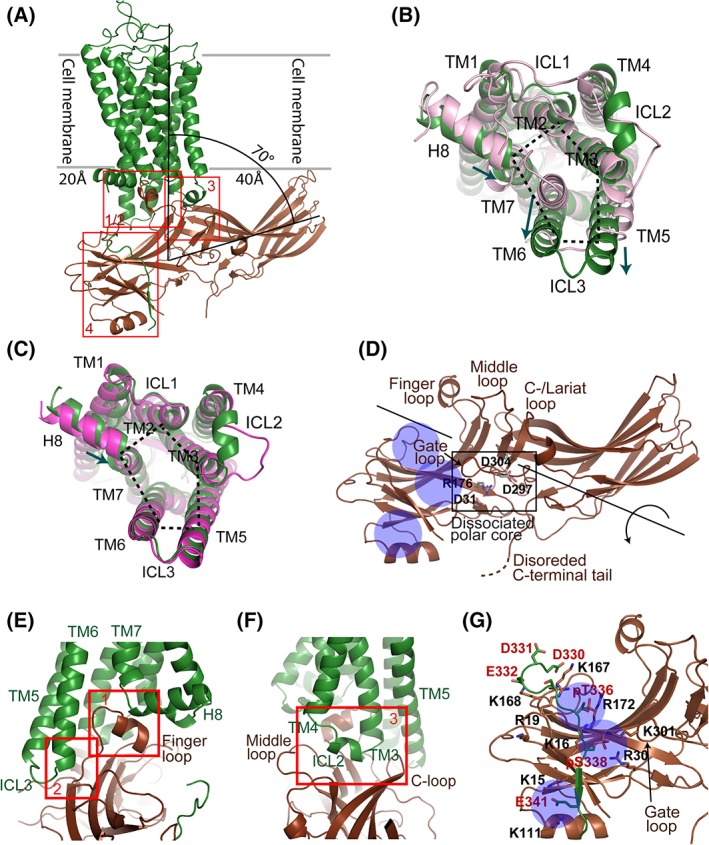
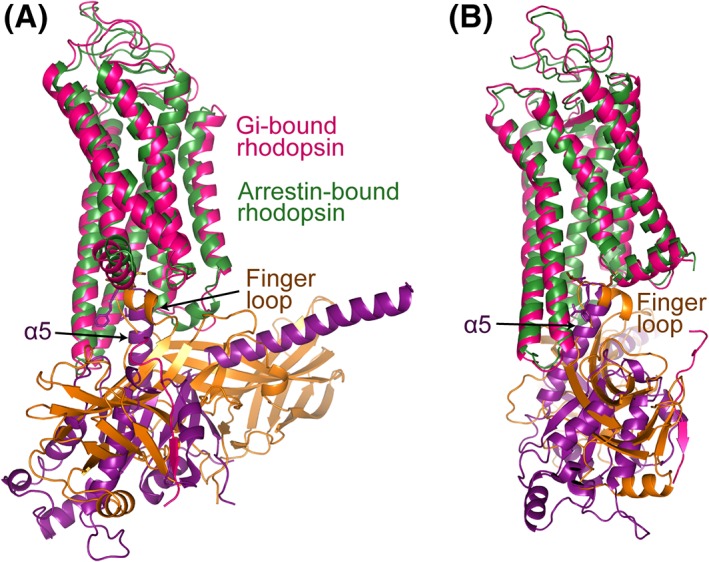
G protein-coupled receptors (GPCRs) constitute the largest family of cell surface receptors that mediate numerous cell signaling pathways, and are targets of more than one-third of clinical drugs. Thanks to the advancement of novel structural biology technologies, high-resolution structures of GPCRs in complex with their signaling transducers, including G-protein and arrestin, have been determined. These 3D complex structures have significantly improved our understanding of the molecular mechanism of GPCR signaling and provided a structural basis for signaling-biased drug discovery targeting GPCRs. Here we summarize structural studies of GPCR signaling complexes with G protein and arrestin using rhodopsin as a model system, and highlight the key features of GPCR conformational states in biased signaling including the sequence motifs of receptor TM6 that determine selective coupling of G proteins, and the phosphorylation codes of GPCRs for arrestin recruitment. We envision the future of GPCR structural biology not only to solve more high-resolution complex structures but also to show stepwise GPCR signaling complex assembly and disassembly and dynamic process of GPCR signal transduction.

Keywords: G protein; G protein-coupled receptors; GPCR; Structural biology; arrestin; signaling.


Figures

Figure 1
Figure 1
Rhodopsin–Gi assembly. (A) Two views of the rhodopsin‐Gi protein‐Fab complex structure (human rhodopsin with human Gαi/rat Gβ1/Bovine Gγ2; PDB code: 6CMO). Rhodopsin is colored in dark green, Gαi Ras domain in magenta, Gαi α helical domain (AHD) in red, Gβ in blue, Gγ in yellow, and the Fab in gray. The key structure interface elements of Gαi with rhodopsin, α5 and αN, are labeled.(B) Structure interface between the rhodopsin TM pocket and α5 of Gαi. The key interface residues are labeled; hydrophobic residues in the rhodopsin TM pocket that interact with α5 of Gαi are depicted in gray surface presentation. The same color code is used as in panel A.
Figure 2
Figure 2
Specificity of GPCR–G protein interaction. (A) The orientations of α5 of Gαi (magenta) and Gαs (yellow) in their complexes with rhodopsin (dark green) and β2AR (blue), respectively. Rhodopsin‐bound Gi is about 20° twisted in a clockwise direction compared with β2AR‐bound Gs when viewed from the intracellular end of the receptors. (B) The α5 of Gαs in the β2AR‐Gs complex is upward‐positioned and closer to TM6 of the receptor than that of Gi in rhodopsin‐Gi complexes. The α5 of Gi positioned about 3.5 Å away from that of Gs in the TM pocket. The color code is the same as in Panel A. (C) GPCR–G protein complex structures. From left to right: β2AR‐Gs (PDB: 3SN6), CTR‐Gs (PDB: 5UZ7), μOR‐Gi (PDB: 6DDE), and 5‐HT1BR‐Go (PDB: 6G79). Key structural elements of the complexes are labeled. TM6 of each of the receptor is highlighted by darker colors. (D) Different orientation of the structures shown in Panel C to highlight the ICL2 conformations.
Figure 3
Figure 3
Enrichment of distinct motifs on TM6 of Gs or Gi/o protein‐coupling GPCRs. GPCRDB generic numbering system is used in this figure (http://gpcrdb.org). (A) Sequence alignment of TM6 motifs of Gi−/Go‐coupling and Gs‐coupling GPCRs shows distinct motifs for coupling Gi or Gs subtypes. (B) Relative probability of polar/positively charged, hydrophobic or specific type (Gly) residues for Gi/o (n = 76) and Gs (n = 25) coupling receptors. (C and D) TM6 sequence motifs of GPCRs for coupling Gs (C) or Gi/o (D) proteins and representative Gs or Gi/o‐coupling GPCR structures with distinct patterns of polar/positively charged (red), hydrophobic (green), or specific type (Gly, black) residues at TM6.31/34/35/36/38/42 positions. Dashed lines indicate the cytoplasmic surface of the bilayer membrane. Φ, hydrophobic residue; θ, polar or positively charged residue; T, threonine; S, serine; G, glycine; and X, any residue. (E) Sequence alignment of TM6 motifs of class B GPCRs shows motifs for coupling Gs protein. (F and G) TM6 sequence motifs of CTR (F) and GLP1R (G) for coupling Gs protein. Labeled are distinct patterns of T/S (red), hydrophobic (green), or specific residues (Gly and Pro, black) on TM6.
Figure 4
Figure 4
Structural dynamics of the α‐helical domain of G proteins. (A) The α‐helical domain (AHD, red) of the Gαi subunit is 55° tilted away from the Ras domain (magenta) compared with its inactive GDP bound conformation (blue), in which AHD and Ras domain are close to each other to form the nucleotide binding pocket. (B) The comparison of the AHD of Gαi in rhodopsin‐bound conformation with that of Gαs in β2AR‐bound conformation. Gαs is colored in yellow; the same color code as in Panel A is used for rhodopsin‐bound and inactive Gαi subunits.
Figure 5
Figure 5
Rhodopsin–visual arrestin interaction. (A) Rhodopsin–visual arrestin complex structure (human rhodopsin with mouse visual arrestin; PDB code: 5W0P). Rhodopsin is colored in dark green, and arrestin in dark brown. Red boxes indicate rhodopsin–arrestin interface patches. (B) Comparison of arrestin‐bound rhodopsin (dark green) with the inactive state of the receptor (pink). The inward shift of the intracellular side of TM7 and Helix 8 of arrestin‐bound rhodopsin is indicated by the small arrow. The outward tilt of TM6 and the extension of TM5 enlarge the intracellular pocket in the TM domain of rhodopsin (indicated with dotted lines) for arrestin binding. (C) Comparison of arrestin‐bound (dark green) with Gi‐bound (red) conformations of rhodopsin. The inward shift of the intracellular side of TM7 and Helix 8 of arrestin‐bound rhodopsin is indicated by the small arrow. The intracellular pocket in the TM domain of arrestin‐bound rhodopsin is similar to that of Gi‐bound rhodopsin, which is indicated by dotted lines. (D) Structural conformation of rhodopsin‐bound visual arrestin with its C‐terminal tail disordered. The structure features a dissociated polar core, a gate loop that is shifted to the N‐domain, and an opened cleft between the N‐ and C‐domains at the central crest region of arrestin that is resulted from a 20° rotation of the domains against each other. The positive surface on the N‐domain is exposed and accessible for receptor binding. (E and F) Rhodopsin–visual arrestin interface patches. Interfaces are formed between 1) the arrestin finger loop and the TM pocket as well as the turn between TM7 and Helix 8 of rhodopsin (E); 2) between the loop and the β‐strand following the finger loop of arrestin and TM5, TM6 and ICL3 of rhodopsin (E); and 3) between arrestin crest loops (middle loop and C‐loop) and rhodopsin ICL2 (F). (G) Rhodopsin–visual arrestin N–C interaction. Rhodopsin C‐terminal tail Residues K339 through E341 form an intermolecular β‐sheet with βI of arrestin. The phosphate groups of pT336 and pS338, and the side chain of E341 of the rhodopsin C‐terminal tail interact with the three positively charged pockets (indicated by blue circles) of the arrestin N‐domain. Key residues of the interface are labeled.
Figure 6
Figure 6
Basal conformation of visual arrestin (bovine arrestin, PDB code: 1CF1). The arrestin C‐terminal tail interacts with the N‐domain, thus blocking the positively charged pockets B and C on the N‐domain that are required for receptor C‐tail interaction. The positively charged pocket A of the arrestin N‐domain (circled), however, is still solvent‐exposed for binding to the phosphorylated receptor C‐tail. Arrestin N‐domain is colored in blue, and C‐domain in brown. Black square: polar core network.
Figure 7
Figure 7
Comparison of the interfaces of Gαi and visual arrestin with rhodopsin. (A) Gαi α5 can be closely superpositioned with the arrestin finger loop when Gi‐bound rhodopsin is aligned with arrestin‐bound rhodopsin. Gi‐bound rhodopsin is colored in red, arrestin‐bound rhodopsin in dark green, Gαi in magenta, and visual arrestin in brown. (B) A view with 90° rotation about the vertical axis.

Similar articles

Cited by

References

    1. Hall RA, Premont RT, Lefkowitz RJ (1999) Heptahelical receptor signaling: beyond the G protein paradigm. J Cell Biol 145:927–932. - PMC - PubMed
    1. Pierce KL, Premont RT, Lefkowitz RJ (2002) Seven‐transmembrane receptors. Nat Rev Mol Cell Biol 3:639–650. - PubMed
    1. Ritter SL, Hall RA (2009) Fine‐tuning of GPCR activity by receptor‐interacting proteins. Nat Rev Mol Cell Biol 10:819–830. - PMC - PubMed
    1. Bjarnadottir TK, Gloriam DE, Hellstrand SH, Kristiansson H, Fredriksson R, Schioth HB (2006) Comprehensive repertoire and phylogenetic analysis of the G protein‐coupled receptors in human and mouse. Genomics 88:263–273. - PubMed
    1. Hamm HE (1998) The many faces of G protein signaling. J Biol Chem 273:669–672. - PubMed

Publication types

Substances

LinkOut - more resources