

Host genetics and the rumen microbiome jointly associate with methane emissions in dairy cows
- PMID: 30312316
- PMCID: PMC6200390
- DOI: 10.1371/journal.pgen.1007580
Host genetics and the rumen microbiome jointly associate with methane emissions in dairy cows
Abstract
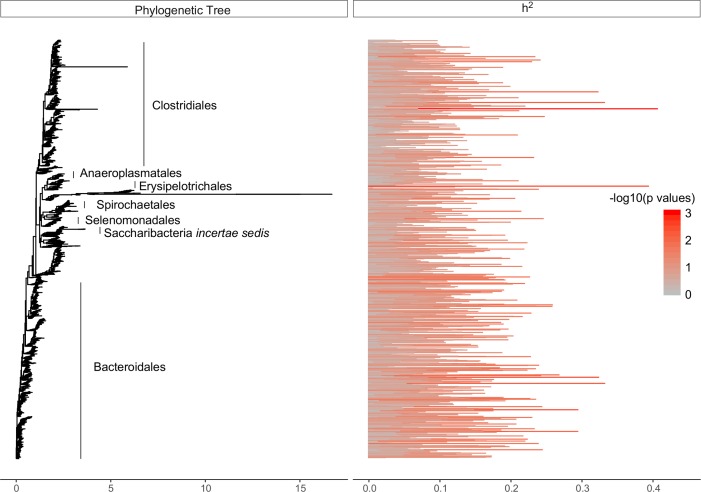
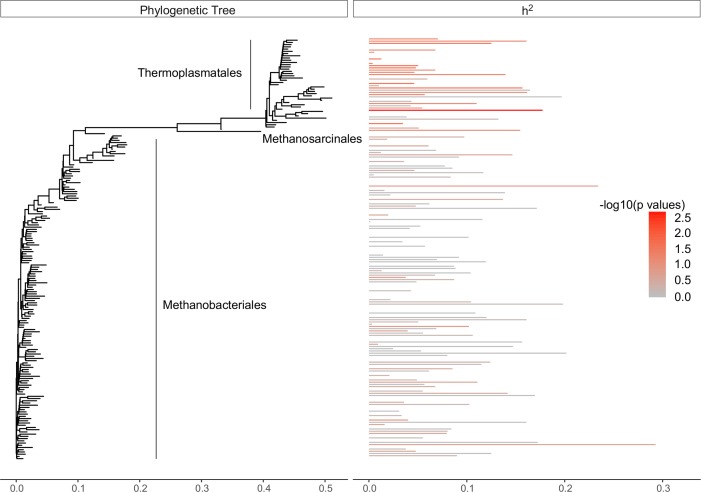
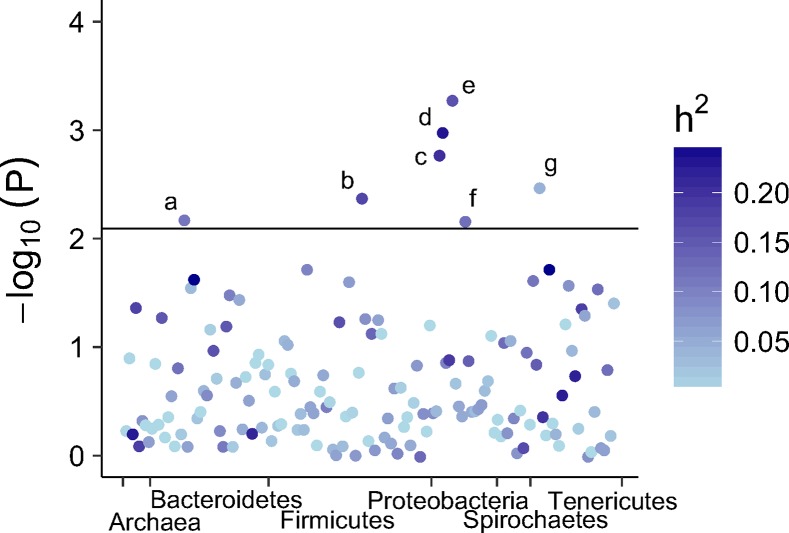
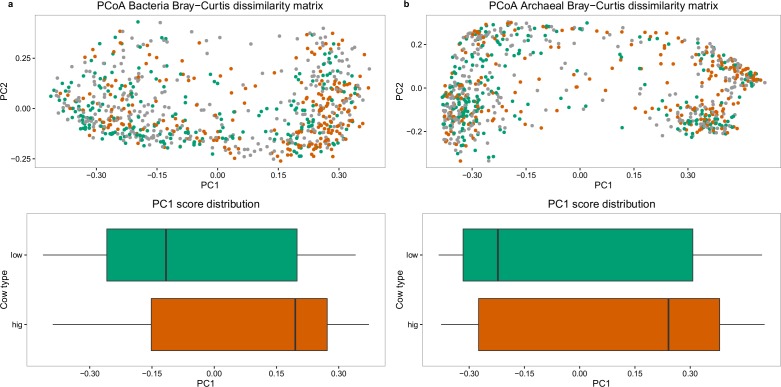
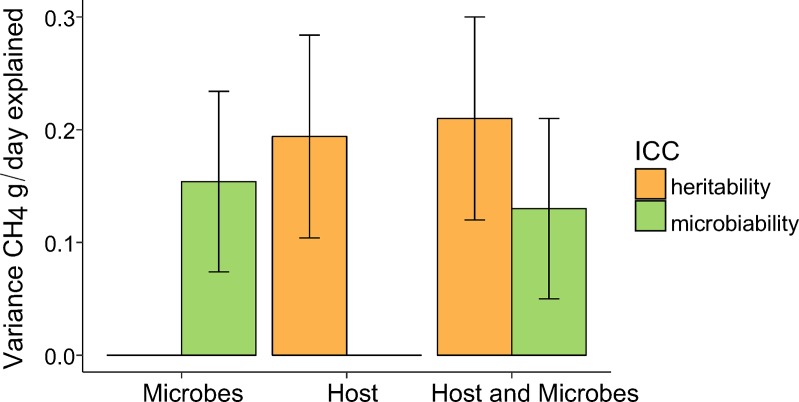
Cattle and other ruminants produce large quantities of methane (~110 million metric tonnes per annum), which is a potent greenhouse gas affecting global climate change. Methane (CH4) is a natural by-product of gastro-enteric microbial fermentation of feedstuffs in the rumen and contributes to 6% of total CH4 emissions from anthropogenic-related sources. The extent to which the host genome and rumen microbiome influence CH4 emission is not yet well known. This study confirms individual variation in CH4 production was influenced by individual host (cow) genotype, as well as the host's rumen microbiome composition. Abundance of a small proportion of bacteria and archaea taxa were influenced to a limited extent by the host's genotype and certain taxa were associated with CH4 emissions. However, the cumulative effect of all bacteria and archaea on CH4 production was 13%, the host genetics (heritability) was 21% and the two are largely independent. This study demonstrates variation in CH4 emission is likely not modulated through cow genetic effects on the rumen microbiome. Therefore, the rumen microbiome and cow genome could be targeted independently, by breeding low methane-emitting cows and in parallel, by investigating possible strategies that target changes in the rumen microbiome to reduce CH4 emissions in the cattle industry.
Conflict of interest statement
DRP and HBN are employed by Clinical-Microbiomics A/S. JL is employed by Viking Genetics. These organization have no financial or other interests in this manuscript or its findings; no other competing interests exist.
Figures
References
-
- Holmes CD, Prather MJ, Søvde OA, Myhre G. Future methane, hydroxyl, and their uncertainties: Key climate and emission parameters for future predictions. Atmos Chem Phys. 2013;13(1):285–302.
-
- IPCC. Climate Change 2014: Synthesis Report. Contribution of Working Groups I, II and III to the Fifth Assessment Report of the Intergovernmental Panel on Climate Change Core Writing Team, R.K. Pachauri and L.A. Meyer. 2014. 151 p.
-
- Gerber P., Steinfeld H, Henderson B, Mottet A, Opio C, Dijkman J, et al. Tackling climate change through livestock–A global assessment of emissions and mitigation opportunities Vol. 14, Food and Agriculture Organization of the United Nations (FAO), Rome: 2013.
-
- Alexandratos N, Bruinsma J, Boedeker G, Schmidhuber J, Broca S, Shetty P, et al. World agriculture: towards 2030/2050 Prospects for food, nutrition, agriculture and major commodity groups. 2006.
-
- Hill J, McSweeney C, Wright A-DG, Bishop-Hurley G, Kalantar-zadeh K. Measuring methane production from ruminants. Trends Biotechnol [Internet]. Elsevier Ltd; 2016;34(1):26–35. Available from: http://linkinghub.elsevier.com/retrieve/pii/S016777991500222X 10.1016/j.tibtech.2015.10.004 - DOI - PubMed
Publication types
MeSH terms
Substances
LinkOut - more resources
Full Text Sources
