. 2018 Oct 12;46(18):9524-9536.
doi: 10.1093/nar/gky761.

The somatic piRNA pathway controls germline transposition over generations

Affiliations

The somatic piRNA pathway controls germline transposition over generations

Bridlin Barckmann et al. Nucleic Acids Res. .

Abstract

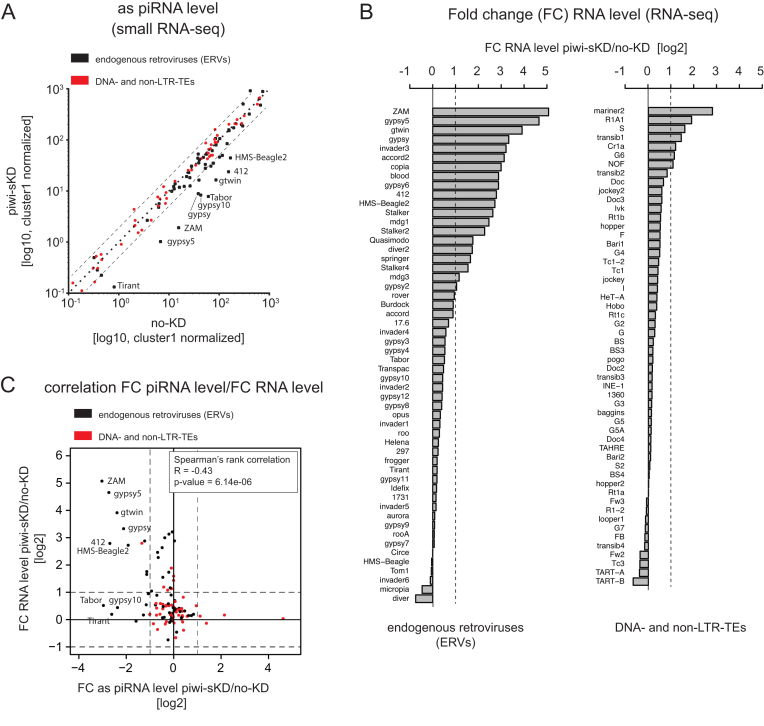
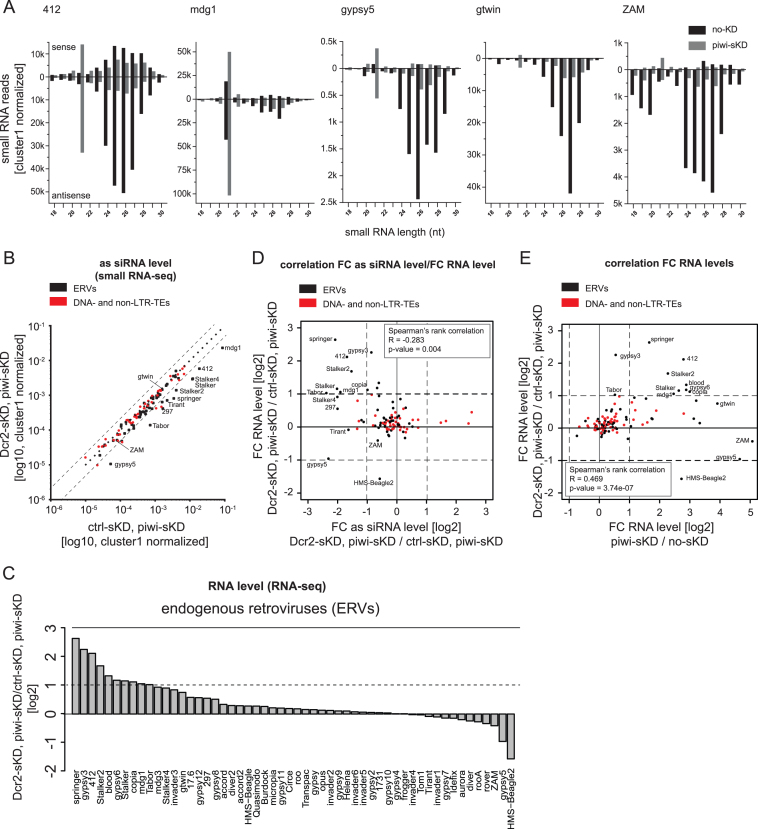
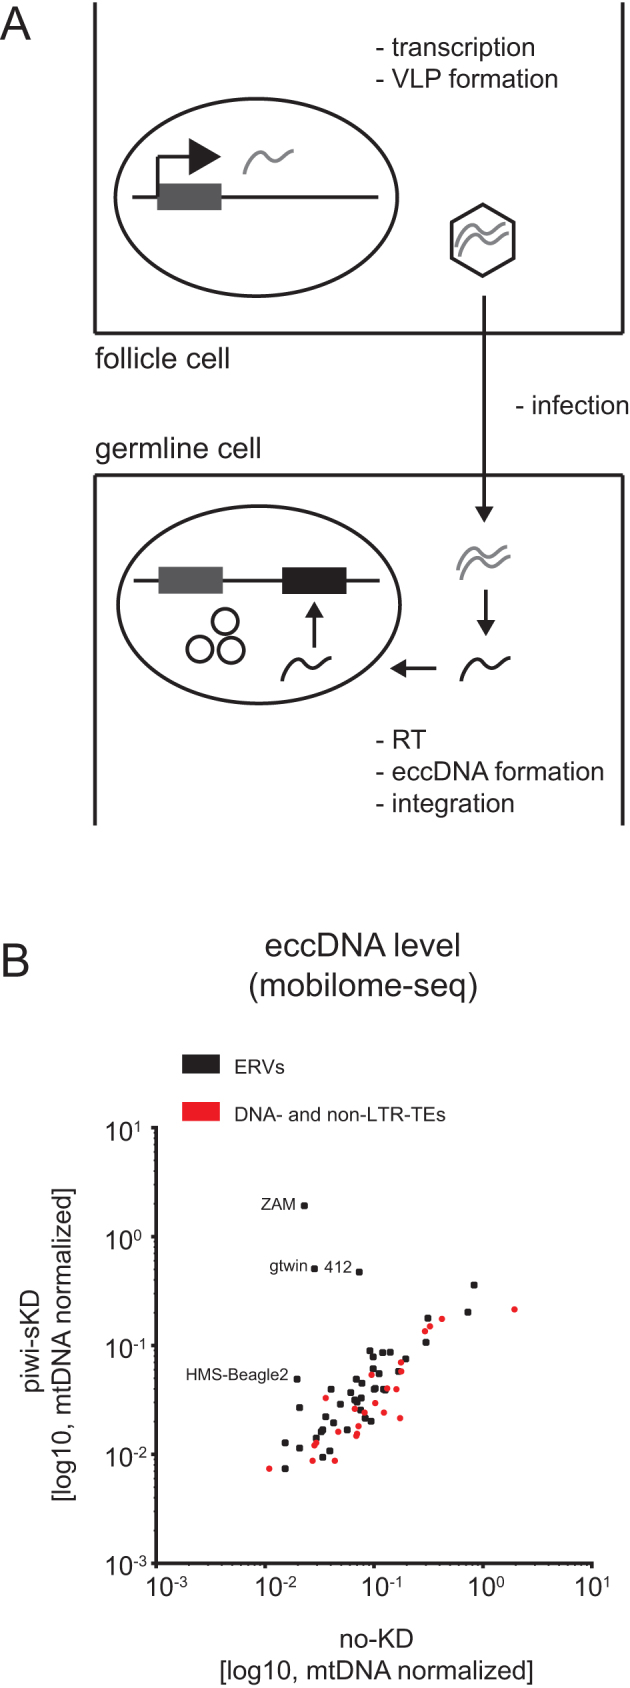
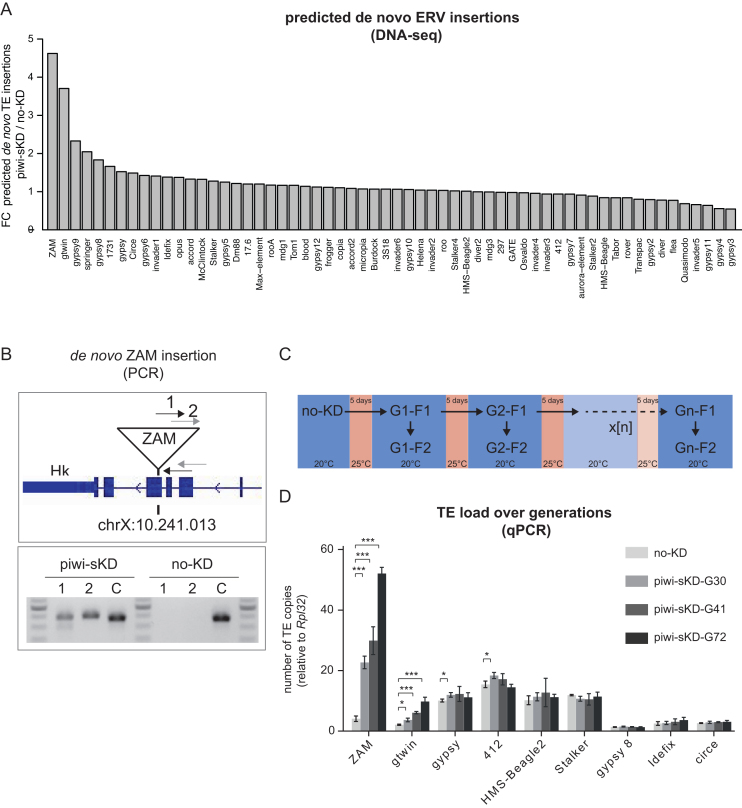
Transposable elements (TEs) are parasitic DNA sequences that threaten genome integrity by replicative transposition in host gonads. The Piwi-interacting RNAs (piRNAs) pathway is assumed to maintain Drosophila genome homeostasis by downregulating transcriptional and post-transcriptional TE expression in the ovary. However, the bursts of transposition that are expected to follow transposome derepression after piRNA pathway impairment have not yet been reported. Here, we show, at a genome-wide level, that piRNA loss in the ovarian somatic cells boosts several families of the endogenous retroviral subclass of TEs, at various steps of their replication cycle, from somatic transcription to germinal genome invasion. For some of these TEs, the derepression caused by the loss of piRNAs is backed up by another small RNA pathway (siRNAs) operating in somatic tissues at the post transcriptional level. Derepressed transposition during 70 successive generations of piRNA loss exponentially increases the genomic copy number by up to 10-fold.


Figures

Figure 1.
Figure 1.
Somatic piwi depletion leads to ERV-specific piRNA loss that correlates with ERV RNA increase. (A) Scatter-plot of antisense 23–30 nt RNA-seq reads normalized to the number of cluster 1 unique mappers reads (germline specific piRNA cluster) for annotated Drosophila melanogaster TEs (n = 123) in Piwi somatic knockdown (piwi-sKD) versus control (no-KD) (log10 scale; as: antisense). ERVs are depicted as black dots, DNA- and non-LTR-TEs as red dots. (B) Bar plot displaying TE RNA level fold changes calculated with normalized read count (two biological replicates) between piwi-sKD versus no-KD ovaries (log2 scale). ERVs are shown in the left panel and DNA- and non-LTR-TEs in the right panel. FC: Fold change. (C) Scatter-plot showing the correlation between fold change of normalized TE RNA level (piwi-sKD versus no-KD ovaries) and fold change of normalized antisense TE piRNA reads (piwi-sKD versus no-KD ovaries). ERVs are depicted as black dots, DNA- and non-LTR-TEs as red dots. Correlation was calculated as Spearman rank correlation. FC: Fold change; as: antisense.
Figure 2.
Figure 2.
The siRNA pathway participates in somatic ERV repression. (A) Size distribution (18–30nt) of sense (displayed above the X axis) and antisense (displayed below the X axis) small RNAs from no-KD ovaries (black bars) and piwi-sKD ovaries (grey bars) mapping to 412, mdg1, gypsy5, gtwin and ZAM. (B) Scatter plot comparing the number of antisense 21 nt small RNA-seq reads, normalized to the number of cluster 1 unique mappers (germline specific piRNA cluster), that matched annotated TEs, piRNA clusters or siRNA clusters in Dcr2-sKD; piwi-sKD and ctrl- sKD; piwi-sKD double knock down ovaries (log10 scale). The crtl-sKD was a somatic follicle cell RNAi targeting the unrelated white gene. ERVs are depicted as black dots, DNA- and non-LTR-TEs as red dots. (C) Bar plot displaying TE RNA level fold changes calculated with normalized read count (two biological replicates) between Dcr2-sKD; piwi-sKD and ctrl-sKD; piwi-sKD double knock down ovaries (log2 scale) for the 62 annotated Drosophila ERVs. (D) Scatter plot showing the correlation between fold changes of TE RNA level (Dcr2-sKD; piwi-sKD versus ctrl-sKD; piwi-sKD) and fold changes of TE piRNA level (Dcr2-sKD; piwi-sKD versus ctrl-sKD; piwi-sKD) (log2 scale). ERVs are depicted as black dots, DNA- and non-LTR-TEs as red dots. Correlation was calculated as Spearman rank correlation. FC: Fold change; as: antisense. (E) Scatter plot showing the correlation between fold changes of TE RNA-level in piwi-sKD versus no-KD ovaries and Dcr2-sKD; piwi-sKD versus ctrl-sKD; piwi-sKD ovaries (log2 scale). ERVs are depicted as black dots, DNA- and non-LTR-TEs as red dots. Correlation was calculated as Spearman rank correlation. FC: Fold change.
Figure 3.
Figure 3.
Somatic piwi depletion may lead to ERV virus like particle (VLP) germline infection. (A) Schematic representation of ERV life cycle. ERV transcription, translation and VLP formation takes place in the somatic follicle cells. The VLP is then crossing by an unknown mechanism the cell-cell border between follicle cell and germ line cell. RNA is reverse transcribed into cDNA. Viral cDNA enters the germ cell nucleus and integrates. EccDNA is formed as a by-product of integration. (B) Scatter plot showing the number of TE mapping mobilome-seq reads, normalized to the number of mitochondrial DNA (mtDNA) mappers, in embryos after piwi-sKD or no-KD (log10 scale). ERVs are depicted as black dots, DNA- and non-LTR-TEs as red dots.
Figure 4.
Figure 4.
Somatic piwi depletion may lead to de novo ERV insertions in the offspring genome, with a transposition rate stable over generations. (A) Bar plot displaying the ratio of de novo insertions per ERV family (n = 62) in embryos of the F2 generation after piwi-sKD versus no-KD embryos. (B) PCR-validation of a de novo ZAM insertion detected by DNA-seq at position chrX:10.241.013. gDNA from flies, of the F2 generation after piwi-sKD, in which the de novo ZAM insertion was detected and, as control, their no-KD ancestors was used. The upper panel shows a schematic representation of the genomic location of the de novo ZAM insertion with the two primer pairs spanning the break point between the 5′ end of the insertion and the genome. The lower panel shows the PCR products on agarose gel. Primer pair 1 and 2 detect the de novo ZAM insertion at position chrX:10.241.013 and a control primer pair C detects a fixed ZAM insertion (detected in all our libraries) at position chr2L:19.841.922. (C) Schema depicting the experimental set up of the single and successive piwi-sKD. (D) Bar plot displaying the TE load for the depicted ERVs in no-KD and after 30, 41 and 72 generations of successive piwi-sKD (G30, G41 and G72). The F2 generation after the last piwi-sKD was analyzed by qPCR. The mean and standard deviation from three biological replicates is shown. The P-values where calculated with a two-tailed t-test (*P < 0.05, **P < 0.01, ***P < 0.001).

References

    1. Jurka J., Kapitonov V.V., Kohany O., Jurka M.V.. Repetitive sequences in complex genomes: structure and evolution. Annu. Rev. Genomics Hum. Genet. 2007; 8:241–259. - PubMed
    1. Finnegan D.J. Transposable elements and DNA transposition in eukaryotes. Curr. Opin. Cell Biol. 1990; 2:471–477. - PubMed
    1. Levin H.L., Moran J.V.. Dynamic interactions between transposable elements and their hosts. Nat. Rev. Genet. 2011; 12:615–627. - PMC - PubMed
    1. Anxolabéhère D., Kidwell M.G., Periquet G.. Molecular characteristics of diverse populations are consistent with the hypothesis of a recent invasion of Drosophila melanogaster by mobile P elements. Mol. Biol. Evol. 1988; 5:252–269. - PubMed
    1. Kidwell M.G., Novy J.B.. Hybrid dysgenesis in Drosophila Melanogaster: Sterility resulting from gonadal dysgenesis in the P-M system. Genetics. 1979; 92:1127–1140. - PMC - PubMed

Publication types

Substances