. 2018 Nov 30;293(48):18624-18635.
doi: 10.1074/jbc.RA118.003352. Epub 2018 Oct 12.

Electrostatic repulsion causes anticooperative DNA binding between tumor suppressor ETS transcription factors and JUN-FOS at composite DNA sites

Affiliations

Electrostatic repulsion causes anticooperative DNA binding between tumor suppressor ETS transcription factors and JUN-FOS at composite DNA sites

Bethany J Madison et al. J Biol Chem. .

Abstract

Many different transcription factors (TFs) regulate gene expression in a combinatorial fashion, often by binding in close proximity to each other on composite cis-regulatory DNA elements. Here, we investigated how ETS TFs bind with the AP1 TFs JUN-FOS at composite DNA-binding sites. DNA-binding ability with JUN-FOS correlated with the phenotype of ETS proteins in prostate cancer. We found that the oncogenic ETS-related gene (ERG) and ETS variant (ETV) 1/4/5 subfamilies co-occupy ETS-AP1 sites with JUN-FOS in vitro, whereas JUN-FOS robustly inhibited DNA binding by the tumor suppressors ETS homologous factor (EHF) and SAM pointed domain-containing ETS TF (SPDEF). EHF bound ETS-AP1 DNA with tighter affinity than ERG in the absence of JUN-FOS, possibly enabling EHF to compete with ERG and JUN-FOS for binding to ETS-AP1 sites. Genome-wide mapping of EHF- and ERG-binding sites in prostate epithelial cells revealed that EHF is preferentially excluded from closely spaced ETS-AP1 DNA sequences. Structural modeling and mutational analyses indicated that adjacent positively charged surfaces from EHF and JUN-FOS use electrostatic repulsion to disfavor simultaneous DNA binding. Conservation of positive residues on the JUN-FOS interface identified E74-like ETS TF 1 (ELF1) as an additional ETS TF exhibiting anticooperative DNA binding with JUN-FOS, and we found that ELF1 is frequently down-regulated in prostate cancer. In summary, divergent electrostatic features of ETS TFs at their JUN-FOS interface enable distinct binding events at ETS-AP1 DNA sites, which may drive specific targeting of ETS TFs to facilitate distinct transcriptional programs.

Keywords: AP1 transcription factor (AP1); ETS transcription factor family; JUN–FOS complex; gene expression; prostate cancer; protein–DNA interaction; protein–protein interaction; transcriptional regulation; tumor suppressor gene.


Conflict of interest statement

The authors declare that they have no conflicts of interest with the contents of this article

Figures

Figure 1.
Figure 1.
JUN–FOS differentially influences the DNA binding of ETS factors to AP1–ETS composite sites. A, representative phosphorimages of EMSAs for EHF (left), ETV4 (middle), and FLI1 (right) binding to the UPP promoter DNA duplex. ETS titrations were performed with DNA alone (top), and with JUN–FOS bound to the DNA (bottom). JUN–FOS EMSAs contain two control lanes; the 1st lane with indicated ETS factor and DNA and the last lane with DNA only. The higher band for EHF corresponds to two EHF molecules bound to the DNA duplex, as observed previously for similar ETS factors (17). B, binding isotherms for EHF binding to UPP DNA in the absence (black) and presence (gray) of JUN–FOS. C, KD values for ETS factors binding to UPP DNA without (black) and with (gray) JUN–FOS. Lines indicate the mean and standard deviation from two experiments (filled circles). Minimal KD values of 1000 nm were estimated for EHF and SPDEF binding to UPP promoter DNA with JUN–FOS as binding isotherms for these low-affinity interactions do not approach saturation. Similarly, minimal KD values of 100 nm were estimated for ERG and FLI1 binding to UPP promoter DNA. See Fig. S1 and Table S1 for quantification of KD values and fold differences.
Figure 2.
Figure 2.
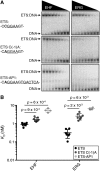
Single-nucleotide change flanking core ETS-binding sequence differentially affects the DNA binding of ETS factors. A, representative EMSAs for EHF (left) and ERG (right) with three different DNA duplexes. DNA sequences are listed on the left and consist of a consensus ETS DNA sequence (ETS), a single nucleotide change from the ETS consensus sequence that is present in ETS–AP1 composite motifs (ETS C(-1)A), and an ETS–AP1 composite DNA sequence (ETS–AP1). ETS and AP1 DNA-binding sites are underlined, and the single nucleotide change is in bold. B, KD values for EHF and ERG with different DNA sequences. See Table S2 and Fig. S2 for quantification of EMSAs.
Figure 3.
Figure 3.
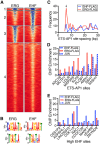
Preferential binding of ERG to ETS–AP1 sites in vivo. A, heat map of reads for ERG–FLAG and EHF–FLAG ChIP data; numbers at left indicate clusters referred to in the text. Analysis of ChIPseq data using MACS2 returned 34,746 enriched regions for ERG–FLAG and 44,977 for EHF–FLAG. B, ETS (top) and AP1 (bottom) DNA-binding sequences are enriched in ERG- and EHF-binding sites as determined by MEME (56). C, spacing between ETS and AP1 sites in top 1000 EHF–FLAG and ERG–FLAG ChIP peaks; spacing is defined as nucleotide distance between core ETS (GGAA) and AP1 (TGANTCA) DNA recognition motifs (11). Arrow indicates the ETS–AP1 spacing that was used in EMSAs. D, qPCR quantification of EHF–FLAG, ERG–FLAG, and JUN enrichment at putative regulatory elements for genes shown; regions selected based on match to ETS–AP1 sites with +6 spacing as indicated by the arrow in C. Two to three independent biological replicates provided similar patterns but different maximum levels of enrichment. A representative experiment is shown. E, qPCR quantification of EHF–FLAG, ERG–FLAG, and JUN enrichment at regions predicted to have high EHF occupancy based on ChIPseq data. ChIP enrichment for D and E is defined as the qPCR signal for that site divided by the qPCR signal for a neutral region, the 3′ UTR of BCLxL1.
Figure 4.
Figure 4.
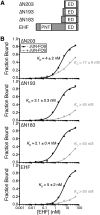
Sequences N-terminal to the ETS domain and within the ETS domain of EHF are important for anticooperative binding with JUN–FOS to composite ETS–AP1 sites. A, schematic of EHF truncation series. ETS DNA-binding domain (ED) and Pointed domain (PNT) are labeled. B, representative binding isotherms for EHF and N-terminal truncations binding to an ETS–AP1 sequence without (black) and with (gray) JUN–FOS. KD values (mean ± S.D.) from four experiments are listed. Minimal KD values for EHF, EHFΔN183, and EHFΔN193 binding to DNA with JUN–FOS were estimated as these binding isotherms do not approach saturation. See Fig. S4 for representative EMSA images and Table S5 for quantification.
Figure 5.
Figure 5.
Positively-charged residues near the JUN–FOS interface are important for anticooperative binding of EHF and JUN–FOS. A and B, structural model of EHF (A) and ERG (B) binding to an ETS–AP1 composite DNA sequence with JUN–FOS. EHF, ERG, and JUN–FOS are shown in surface mode and colored according to electrostatic potential (red, negative; blue, positive). Regions of EHF that were subsequently mutated are labeled 1–4 in A. Note that EHF residues 193–204 are not present in this modeled structure. C, listing of EHF residues that were mutated. Circled numbers 1–4 correspond to the regions labeled in A. The top and bottom sequences indicate the native and mutated residues, respectively. Residues are colored according to charge, as in A. D, portions of EMSAs showing EHF wildtype (WT) and mutants bound in the presence of JUN–FOS on an ETS–AP1 site. EHF was serially diluted in 2-fold increments. Bands corresponding to JUN–FOS bound to DNA (JF:DNA) as well as EHF and JUN–FOS bound to DNA (EHF:JF:DNA) are labeled. See Fig. S7 and Table S6 for further quantification of EMSAs.
Figure 6.
Figure 6.
ELF1 also exhibits anticooperative DNA binding with JUN–FOS. A, sequence alignment of EHF and ELF1/2/4 subfamilies for regions important for anticooperative DNA binding with JUN–FOS. Numbers above sequences and arrows below sequences refer to EHF regions and residues mutated in Fig. 5. See Fig. S6 for complete sequence alignments. B, representative EMSAs for ELF1 alone (top) and with JUN–FOS (bottom). The first three lanes correspond to DNA only, ELF1:DNA, and JUN–FOS:DNA (bottom gel only) controls. C, comparison of KD values for ELF1, ELK4, ERF, and GABPA alone (black) and with JUN–FOS (gray). Filled circles indicate an individual experiment, and lines indicate the mean and S.D. See Table S7 for KD values and Fig. S9 for representative EMSAs of ELK4, ERF, and GABPA. D, example of an oncoprint curated from cBioPortal showing mutational frequencies of the ETS factors ERG, ETV1, ELF1, EHF, and SPDEF (http://www.cbioportal.org) (31, 32). (Please note that the JBC is not responsible for the long-term archiving and maintenance of this site or any other third party hosted site.) This example is from a 2015 TCGA prostate cancer study (34). ERG and ETV1 are frequently overexpressed through gene fusions, and EHF and SPDEF are rarely present in deep deletions, as characterized previously (15, 16, 19, 20). Interestingly, ELF1 is also frequently involved in deep deletions suggesting that it may be a tumor suppressor in prostate cancer. See Fig. S11 for additional studies with frequent ELF1 gene deletions in prostate cancer patients.
Figure 7.
Figure 7.
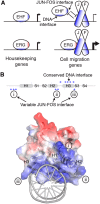
Model for differential regulation of ETS–AP1 sites by ETS factors. A, left, EHF and ERG have DNA-binding surfaces similar to all ETS factors and therefore bind to ETS DNA sequences with relatively similar affinities. Right, distinct JUN–FOS interface of EHF and ERG allows ERG to bind to ETS–AP1 sequences with JUN–FOS but prevents EHF from binding to ETS–AP1 sequences with JUN–FOS. This difference in binding affinities is consistent with the repression and activation of ETS–AP1-regulated genes by EHF and ERG, respectively (11, 13). B, three positive regions of EHF form the JUN–FOS interface. Top, ETS domain of EHF is depicted in cartoon format; cylinders and arrows indicate α-helices and β-strands, respectively, and are named according to previous nomenclature (27). Positive residues in α-helix H3 are at the primary DNA interface and are highly conserved among human ETS factors (Figs. S6 and S8). In contrast, positive residues N-terminal to the ETS domain (i), in the H2–H3 loop (ii), and C terminus of α-helix H3 (iii) form the JUN–FOS interface and are only found in a subset of human ETS factors. Bottom, these three regions of EHF, which are separated in primary sequence, converge to form a broad positively-charged interface for JUN–FOS. See Fig. S10 for the JUN–FOS interfaces of SPDEF, ELF1, and ERG.

References

    1. Lee T. I., and Young R. A. (2000) Transcription of eukaryotic protein-coding genes. Annu. Rev. Genet. 34, 77–137 10.1146/annurev.genet.34.1.77 - DOI - PubMed
    1. Panne D. (2008) The enhanceosome. Curr. Opin. Struct. Biol. 18, 236–242 10.1016/j.sbi.2007.12.002 - DOI - PubMed
    1. Garvie C. W., Pufall M. A., Graves B. J., and Wolberger C. (2002) Structural analysis of the autoinhibition of Ets-1 and its role in protein partnerships. J. Biol. Chem. 277, 45529–45536 10.1074/jbc.M206327200 - DOI - PubMed
    1. Jolma A., Yin Y., Nitta K. R., Dave K., Popov A., Taipale M., Enge M., Kivioja T., Morgunova E., and Taipale J. (2015) DNA-dependent formation of transcription factor pairs alters their binding specificity. Nature 527, 384–388 10.1038/nature15518 - DOI - PubMed
    1. LaRonde-LeBlanc N. A., and Wolberger C. (2003) Structure of HoxA9 and Pbx1 bound to DNA: Hox hexapeptide and DNA recognition anterior to posterior. Genes Dev. 17, 2060–2072 10.1101/gad.1103303 - DOI - PMC - PubMed

Publication types

MeSH terms