. 2018 Oct 12;9(1):4250.
doi: 10.1038/s41467-018-06713-0.

Variants in exons 5 and 6 of ACTB cause syndromic thrombocytopenia

Affiliations

Variants in exons 5 and 6 of ACTB cause syndromic thrombocytopenia

Sharissa L Latham et al. Nat Commun. .

Erratum in

  • Author Correction: Variants in exons 5 and 6 of ACTB cause syndromic thrombocytopenia.
    Latham SL, Ehmke N, Reinke PYA, Taft MH, Eicke D, Reindl T, Stenzel W, Lyons MJ, Friez MJ, Lee JA, Hecker R, Frühwald MC, Becker K, Neuhann TM, Horn D, Schrock E, Niehaus I, Sarnow K, Grützmann K, Gawehn L, Klink B, Rump A, Chaponnier C, Figueiredo C, Knöfler R, Manstein DJ, Di Donato N. Latham SL, et al. Nat Commun. 2018 Nov 19;9(1):4930. doi: 10.1038/s41467-018-07404-6. Nat Commun. 2018. PMID: 30451859 Free PMC article.

Abstract

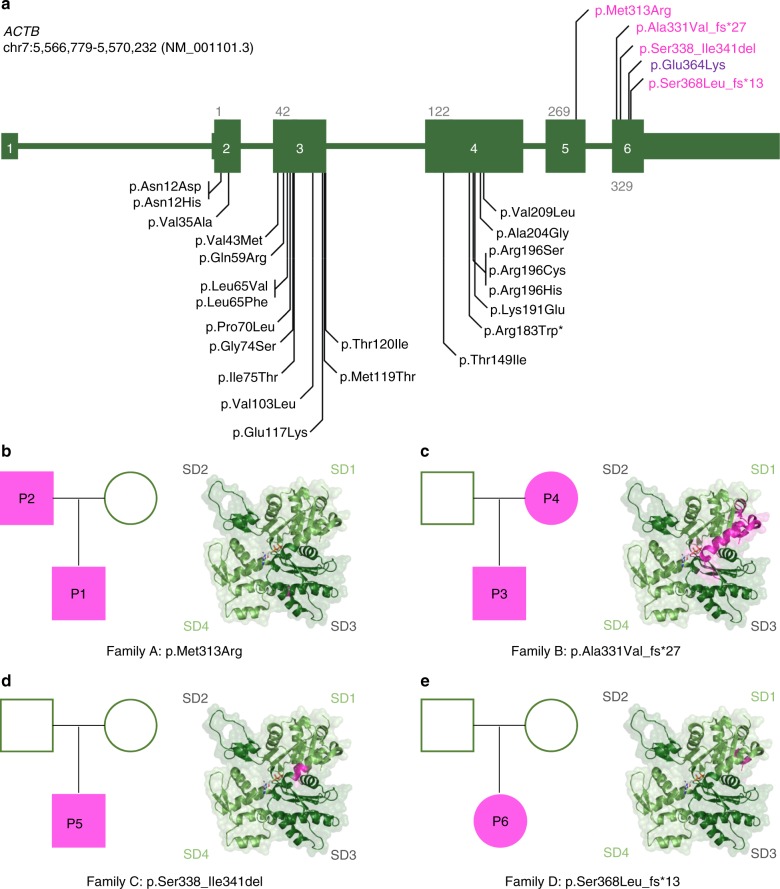
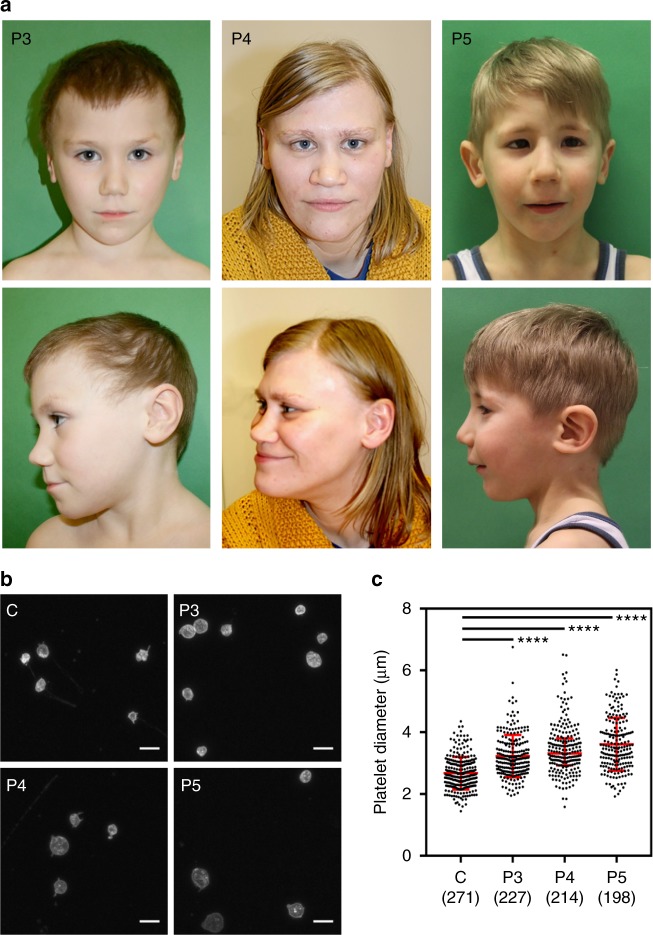
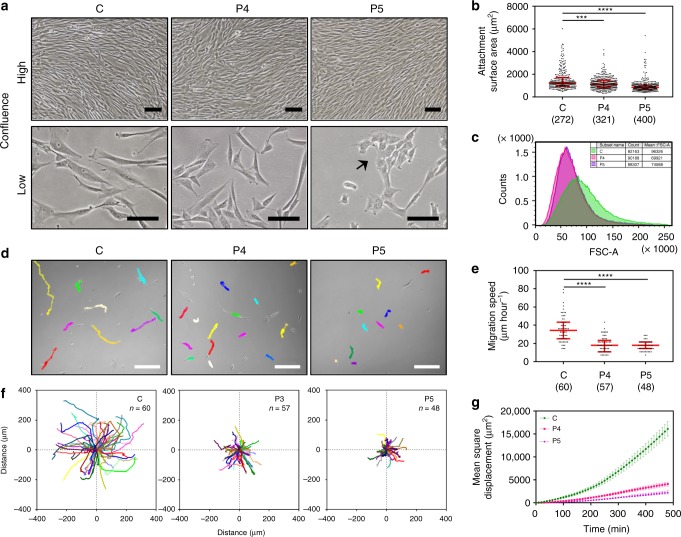
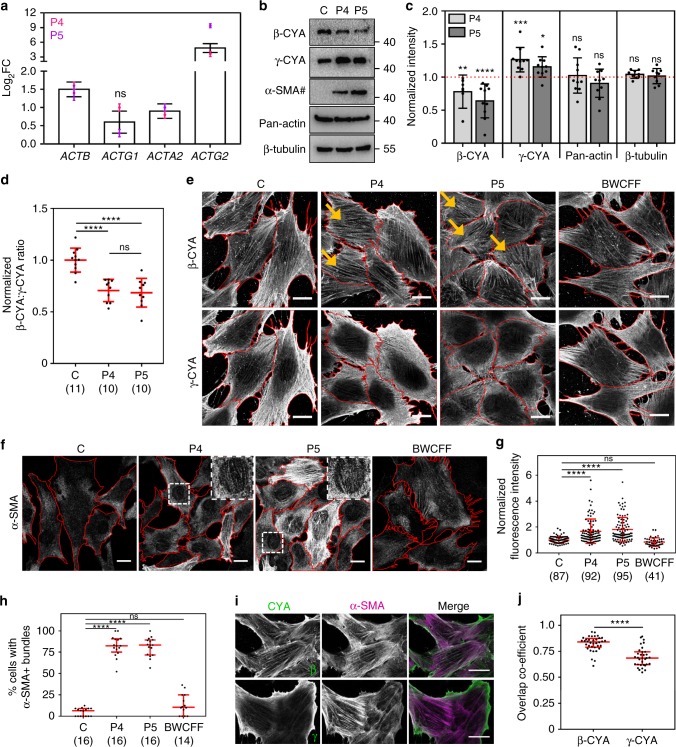
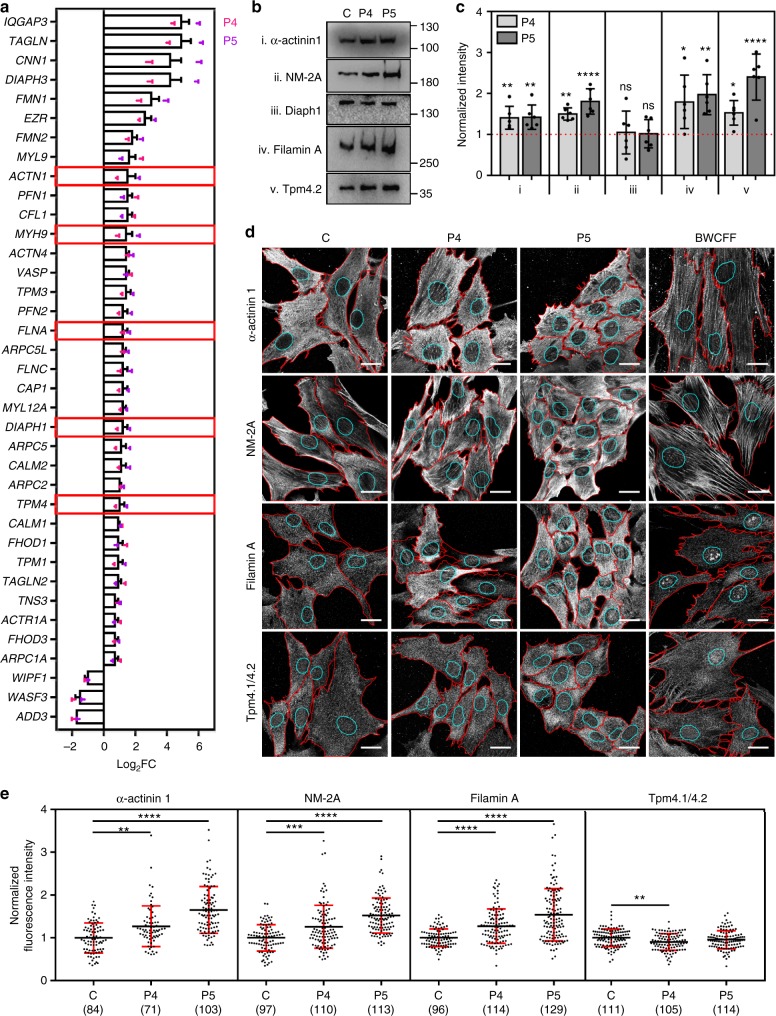
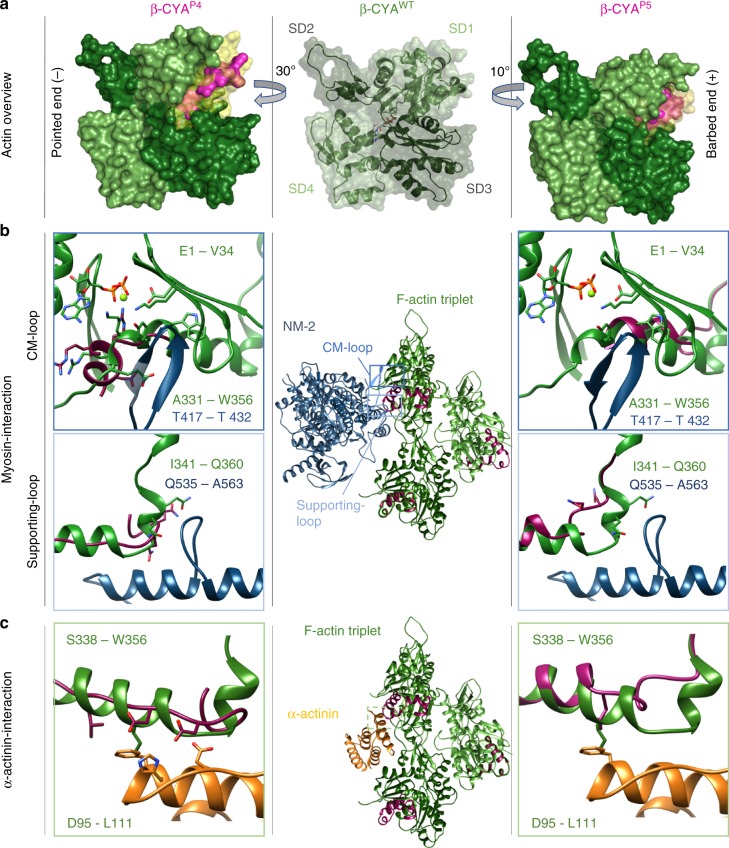
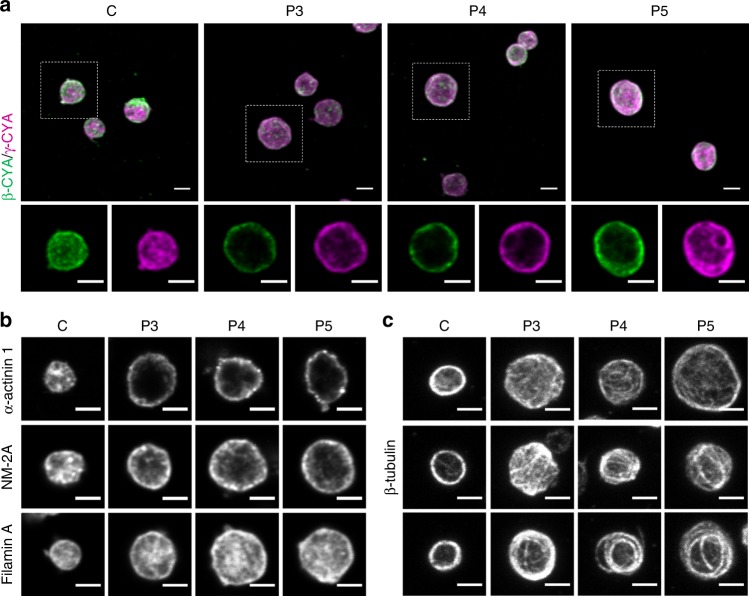
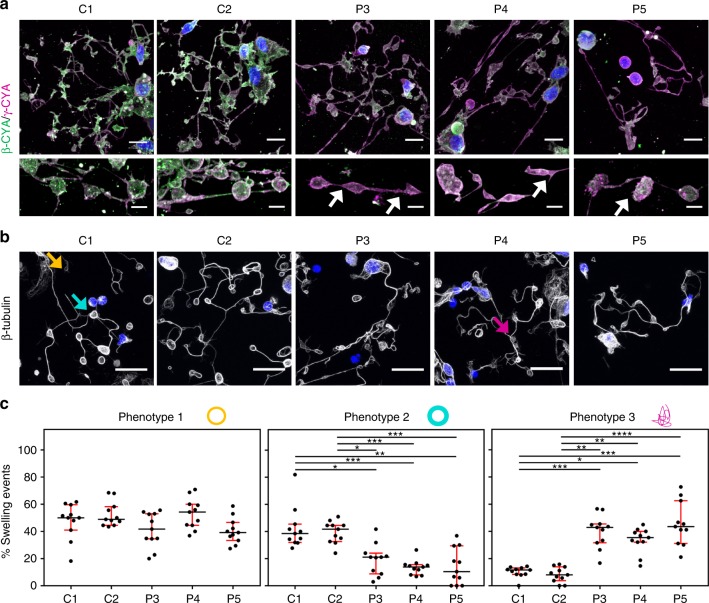
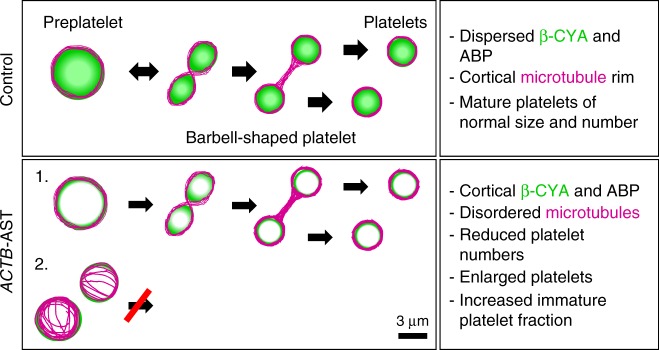
Germline mutations in the ubiquitously expressed ACTB, which encodes β-cytoplasmic actin (CYA), are almost exclusively associated with Baraitser-Winter Cerebrofrontofacial syndrome (BWCFF). Here, we report six patients with previously undescribed heterozygous variants clustered in the 3'-coding region of ACTB. Patients present with clinical features distinct from BWCFF, including mild developmental disability, microcephaly, and thrombocytopenia with platelet anisotropy. Using patient-derived fibroblasts, we demonstrate cohort specific changes to β-CYA filament populations, which include the enhanced recruitment of thrombocytopenia-associated actin binding proteins (ABPs). These perturbed interactions are supported by in silico modeling and are validated in disease-relevant thrombocytes. Co-examination of actin and microtubule cytoskeleton constituents in patient-derived megakaryocytes and thrombocytes indicates that these β-CYA mutations inhibit the final stages of platelet maturation by compromising microtubule organization. Our results define an ACTB-associated clinical syndrome with a distinct genotype-phenotype correlation and delineate molecular mechanisms underlying thrombocytopenia in this patient cohort.


Conflict of interest statement

The authors declare no competing interests.

Figures

Fig. 1
Fig. 1
Overview of ACTB-AST mutations. a Schematic representations of ACTB mutations. ACTB-AST mutations are shown in magenta above the gene model and BWCFF-associated mutations from the literature and from our own patients are given below the gene model; Asterisk (*) indicates a specific variant associated with progressive dystonia. Genomic coordinates refer to the GRCh37/hg19 genome assembly. Exons are numbered and coding exons are indicated by large boxes; be Pedigree charts (left) and in silico representations of impacted residues (right) in b Family A (P1 and P2)—ACTB: p.Met313Arg, c Family B (P3 and P4) - ACTB: p.Ala331Val_fs*27, d Family C (P5)—ACTB: p.Ser338_Ile341del and e Family D (P6)—ACTB: p.Ser368Leu_fs*13. For pedigree charts, squares represent males, circles indicate females, magenta-shaded symbols indicate individuals with ACTB-AST and patients are numbered according to the text. For in silico representations, affected amino acid residues are indicated in magenta on the actin protein structure (PDB 5JLH)
Fig. 2
Fig. 2
ACTB-AST patients display minor facial anomalies and thrombocytopenia with enlarged platelets. a Craniofacial appearance of patient 3 (left, P3, p.Ala331Val_fs*27) at 5 years of age, patient 4 (mid, P4, p.Ala331Val_fs*27) at 31 years of age and patient 5 (right, P5, p.Ser338_Ile341del) at 4 year 10 months. Flared eyebrows (P3 and P4), straight eyebrows (P4 and P5), telecanthus (all), epicanthal folds (P3 and P5), upslanting palpebral fissures (P3 and P4), a broad nasal tip (P3 and P5), a bulbous nose (P4), a thin upper vermillion border (all) and prominent chin (P4) are observed in these patients; b, c CD61-labeled platelets purified from a healthy control (C), P3, P4 and P5 were analyzed by immunofluorescence microscopy; b Representative images show that platelets in patient samples vary from normal to large in size. Scale bars represent 5 µm; c Particle analysis shows a significant shift in the size distribution and average diameter of patient platelets compared with a healthy control. Individual data points are plotted with the median and IQR. The number of platelets analyzed from 1 experiment is given in brackets below each condition. Significance was determined with the Kruskal–Wallis and Dunn’s multiple comparisons tests, where ****p < 0.0001
Fig. 3
Fig. 3
Reduced cell attachment surface area, volume and migratory capacity of ACTB-AST fibroblasts. a Micrographs of control (C), patient 4 (P4, p.Ala331Valfs*27) and patient 5 (P5, p.Ser338_Ile341del) primary dermal fibroblasts at high (top row) and low (bottom row) confluence. At low confluence, ACTB-AST cells are distinctly smaller than controls and P5 cells grow in aggregates (arrow). All scale bars are 100 µm; b Quantification of the cell attachment surface area from immunofluorescence analyses (i.e. Figure 4e) shows reduced coverage distribution by ACTB-AST cells (median and IQR, the number of cells analyzed in 4 experiments is given in brackets); c Flow cytometry analysis of the Forward Scatter Area (FSC-A) vs. normalized cell count (100,000 events from 1 experiment) shows a reduction in ACTB-AST cell volume (P4: pink, P5: purple) compared to the control (green); dg Migration assays demonstrate reduced migratory capacity for ACTB-AST patient primary fibroblasts; d Representative images at 8 h with migratory tracks overlaid. Scale bars are 100 µm; e Migration speed of individual cells represented in µm per hour (median and IQR); f Trajectories of all tracks recorded for C, P4 and P5 from 0 h (origin) to 8 h (5 movies from 2 technical replicates, n = number of cells analyzed); g Mean square displacement analysis of C (green), P4 (magenta) and P5 (purple) fibroblasts (mean ± s.e.m.). Significance was determined with the Kruskal–Wallis test, where ***p < 0.001 and ****p < 0.0001
Fig. 4
Fig. 4
Actin isoform regulation in ACTB-AST patient fibroblasts. a RNA-Seq analysis of actin transcripts in P4 and P5 compared to the healthy control (log2 fold change ± s.e.m.). Bar graphs show the combined results from both patients relative to the control. Overlayed dot plots show the individual patient data calculated from three technical replicates (p < 0.0001 unless stated as ns); b Representative western blots show reduced β-CYA, increased γ-CYA and α-SMA in P4 and P5 fibroblasts compared to the control (C). Double the sample amount was required to detect α-SMA (#); c Densitometry analysis of P4 and P5 signals expressed as mean (±s.d.) relative to the control (9–10 replicates from 6 lysates; Kruskal–Wallis test); d Reduced β-CYA:γ-CYA ratios are detected in P4 and P5 fibroblasts by immunofluorescence microscopy (mean ± s.d.; image numbers analyzed from 3 experiments are given in brackets; one-way ANOVA); e Representative maximum intensity projections show β-CYA (top) and γ-CYA (bottom) distribution within z-stack slices 1–2 of C, P4, P5, and BWCFF control fibroblasts. Yellow arrows indicate cells where thick basal β-CYA bundles are abundant. Scale bars are 15 µm; f Immunofluorescence microscopy shows increased α-SMA expression in P4 and P5 fibroblasts. Inserts show α-SMA incorporation in ACTB-AST sub-nuclear basal filaments. Scale bars are 15 µm; g Normalized α-SMA fluorescence intensity in individual cells (mean ± s.d.; the number of cells analyzed from 3 experiments is given in brackets; Kruskal–Wallis test); h The percentage of cells per image in which α-SMA is incorporated into basal sub-nuclear filaments (median and IQR; 14–16 images from 3 experiments; Kruskal-Wallis test); i P5 cells co-stained for β-CYA or γ-CYA (left, green in merge) and α-SMA (mid, magenta in merge). Scale bars are 20 µm; j Greater overlap of α-SMA with β-CYA is observed in P5 cells (median and IQR; 33–36 cells from 3 experiments; Mann–Whitney test). In all cases, *p < 0.05, ***p < 0.001, ****p < 0.0001 and ns, not significant
Fig. 5
Fig. 5
Select thrombocytopenia-associated ABPs are recruited to basal β-CYA-rich filaments. a ABP transcripts significantly deregulated (log2 fold change ± s.e.m.) in both P4 and P5 fibroblasts compared to a healthy control, as determined by RNA-Seq. Bar graphs show the combined results from both patients relative to the control. Dot plots show the individual patient data calculated from three technical replicates. Red boxes indicate the genes where disease-causing mutations have been associated with thrombocytopenia with enlarged platelets; b, c Western blot analysis and densitometry of ABP candidates: (i) α-actinin 1, (ii) NM-2A, (iii) Diaph1, (iv) Filamin A and (v) Tpm4.1/4.2 in control (C), P4 and P5 fibroblast lysates. Significant upregulation is validated for all candidates except Diaph1. Data are represented relative to the control (mean ± s.d.; 6 replicates from 3 lysates; Kruskal–Wallis test); d Representative maximum intensity projections show α-actinin 1 (top row), NM-2A (second row), Filamin A (third row) and Tpm4.1/4.2 distribution within z-stack slices 1–2 of C, P4, P5 and BWCFF control fibroblasts. Cell boundaries are shown in red and cyan regions indicate the nuclear boundaries where basal sub-nuclear filaments localize. Scale bars are 20 µm; e Quantification of the fluorescence intensity of each candidate ABP in the sub-nuclear region (mean ± s.d.; Kruskal–Wallis test). The number of cells analyzed from 3 experiments is indicated in brackets. In all cases, **p < 0.01, ***p < 0.001 and ****p < 0.0001
Fig. 6
Fig. 6
In silico modeling of P4- and P5-associated ACTB variants. a Overview of wildtype (WT) β-CYA (mid) in cartoon with space-fill overlay. β-CYAP4 and β-CYAP5 to the left and right respectively, with missing volumes indicated in yellow space-fill and affected residues modeled in magenta space-fill; b The binding interface of NM-2 (blue, according to PDB 5JLH) on a β-CYAWT F-actin triplet (mid, green with magenta C-terminal residues) is shown. Close-ups of affected β-CYAP4 (left) and β-CYAP5 (right) residues are superimposed as magenta cartoon structures on the green β-CYAWT cartoon structure. CM-loop interactions with mutant actins are shown in the top panels, whilst supporting-loop interactions are modeled in the lower panels; c In silico modeling of the interaction interface of β-CYAWT (green) with α-actinin (orange, according to PDB 3LUE, confirmed by docking) is shown (mid). Left and right show the interface with affected C-terminal residues for β-CYAP4 (left) and β-CYAP5 (right), respectively
Fig. 7
Fig. 7
ACTB-AST patient platelets have disordered actin and microtubule cytoskeletons. ac Assessment of the actin and microtubule cytoskeletons in platelets purified from healthy control (C), patient 3 (P3), patient 4 (P4), and patient 5 (P5) EDTA-peripheral blood (1 experimental replicate); a Representative maximum intensity projections (top row) are given for β-CYA (green) and γ-CYA (magenta) labeled samples, showing reduced β-CYA:γ-CYA ratios in patient samples. Mid-stack slices of the marked regions of interest (white squares) are shown below, demonstrating cortical redistribution of actin isoforms in patient thrombocytes; b Mid-stack slices show strong cortical recruitment of NM-2A and α-actinin 1, and a moderate cortical enrichment of Filamin A in patient platelets; c Representative images demonstrate the highly disordered nature of β-tubulin in patient-derived platelets compared to those from a healthy control. 3–6 images (total of 20–60 platelets) were assessed for each protein of interest. All scale bars represent 2 µm
Fig. 8
Fig. 8
Microtubule organization in proplatelet swellings is compromised in ACTB-AST-derived megakaryocytes. a β-CYA (green) and γ-CYA (magenta) distribution in proplatelet-forming MKs from PBMCs isolated from the whole blood of two healthy controls (C1 and C2), patient 3 (P3), patient 4 (P4), and patient 5 (P5). Representative maximum intensity projections show reduced incorporation of β-CYA into proplatelet structures in ACTB-AST cells. White arrows indicate irregular-shaped proplatelet swellings identified in patient samples. Scale bars are 10 µm for the top row and 5 μm for the bottom row; b Representative images of β-tubulin labeled MKs from C1, C2, P3, P4, and P5. Arrows indicate the three proplatelet swelling phenotypes observed, where microtubules are (1) organized into a thin marginal band (yellow arrow), (2) organized into a thick marginal band (cyan arrow), or (3) disordered (magenta arrow). Scale bars are 20 µm; c Quantification of the percentage of proplatelet-attached swellings with thin marginal bands (phenotype 1, left), thick marginal bands (phenotype 2, middle) and disordered microtubules (phenotype 3, right) shows significant differences between healthy controls and ACTB-AST patients. For each condition, blinded analysis of 11 images from 3 samples obtained from 1 experimental repeat was performed. Data are represented as median (IQR). Significance was determined with the Kruskal–Wallis test, where *p < 0.05, **p < 0.01, ***p < 0.001, ****p < 0.0001
Fig. 9
Fig. 9
Proposed model of the mechanisms underlying thrombocytopenia in ACTB-AST. Preplatelets and barbell-shaped platelets shed into the blood stream convert into platelets in a microtubule-dependent manner. A thick band of microtubules is responsible for twisting the center of the preplatelet to form the barbell-shaped platelet, essentially dividing it into two individual terminal platelets. Abscission of terminal platelets subsequently occurs in the circulation. In ACTB-AST patients, cytoplasmic actin isoforms and select ABPs (α-actinin 1, NM-2A and to a lesser extent Filamin A) enrich at the preplatelet cortex. The cortical microtubule band observed in mature control cells forms in fewer ACTB-AST platelets. Instead, microtubules are highly disordered. We propose that the final platelet processing steps are therefore restricted in preplatelets with a disordered microtubule cytoskeleton, leading to reduced numbers of enlarged and immature platelets in patient circulation

References

    1. Holmes KC, Popp D, Gebhard W, Kabsch W. Atomic model of the actin filament. Nature. 1990;347:44–49. doi: 10.1038/347044a0. - DOI - PubMed
    1. Dominguez R, Holmes KC. Actin structure and function. Annu Rev. Biophys. 2011;40:169–186. doi: 10.1146/annurev-biophys-042910-155359. - DOI - PMC - PubMed
    1. Winder SJ, Ayscough KR. Actin-binding proteins. J. Cell. Sci. 2005;118:651–654. doi: 10.1242/jcs.01670. - DOI - PubMed
    1. Rottner K, Faix J, Bogdan S, Linder S, Kerkhoff E. Actin assembly mechanisms at a glance. J. Cell. Sci. 2017;130:3427–3435. doi: 10.1242/jcs.206433. - DOI - PubMed
    1. Pollard TD, Cooper JA. Actin, a central player in cell shape and movement. Science. 2009;326:1208–1212. doi: 10.1126/science.1175862. - DOI - PMC - PubMed

Publication types