. 2018 Oct:36:113-121.
doi: 10.1016/j.ebiom.2018.09.036. Epub 2018 Oct 11.

Improved assays to measure and characterize the inducible HIV reservoir

Affiliations

Improved assays to measure and characterize the inducible HIV reservoir

Marta Massanella et al. EBioMedicine. 2018 Oct.

Abstract

Background: Improved assays are critical to better characterize the HIV reservoir and to reliably evaluate candidate intervention strategies. Here we describe different methods to quantify the HIV reservoir.

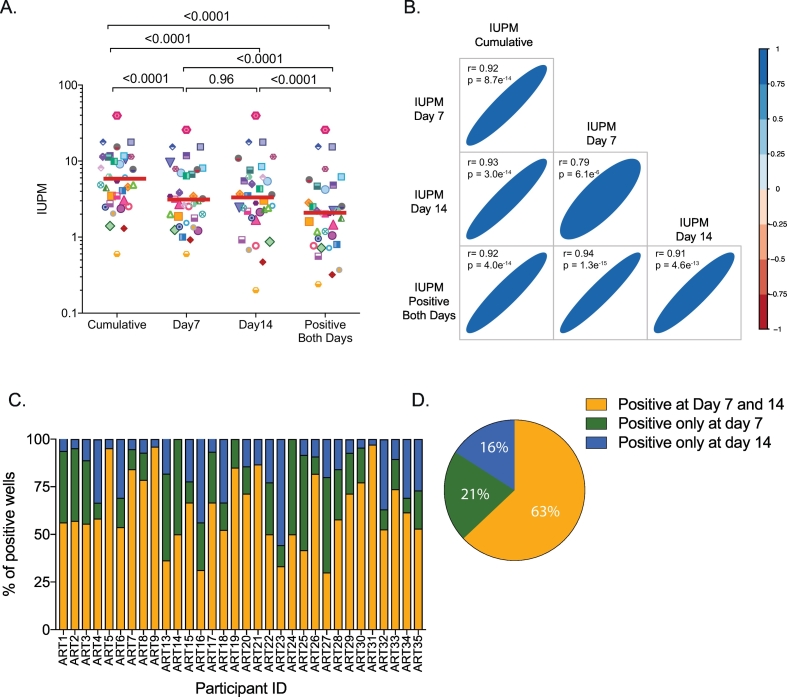
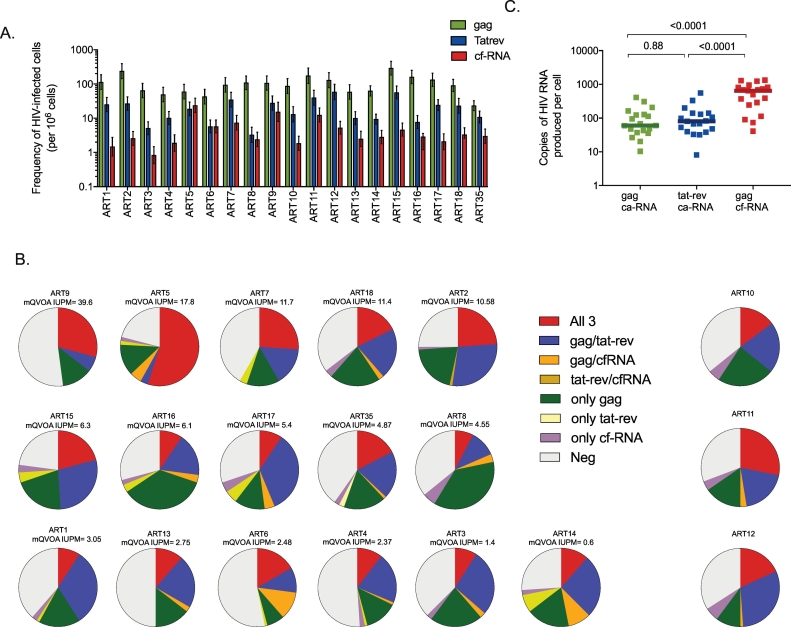
Methods: We developed an optimized quantitative viral outgrowth assay (QVOA) to quantify the frequency of cells harboring replication-competent HIV, which is simpler and more sensitive than classical QVOAs. We also developed new inducible RNA assays that concomitantly measure the frequency of cell-associated [ca-] (gag and tat-rev) and cell-free [cf-] HIV RNA after three days of anti-CD3/CD28 stimulation.

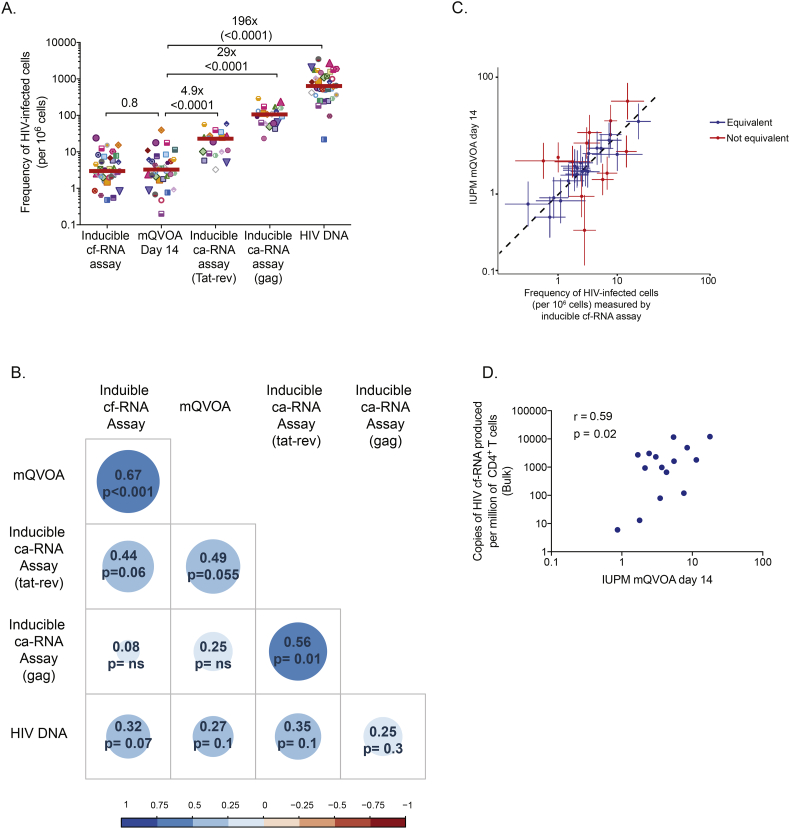
Findings: The median frequency of the infected cells measured after induction was 94 IQR[60-132], 16 IQR [9-29] and 2.9 IQR[1.9-6.8] cells/106 CD4+ T-cells for ca-RNA gag and tat-rev, and cf-RNA, respectively. There are a large proportion of transcription-competent proviruses (ca-RNA) that seemed unable to form complete virions (cf-RNA), suggesting post-transcriptional blocks or defective proviruses. Importantly, the median frequency of infected CD4+ T-cells as estimated by 3-day inducible cf-RNA assay was not statistically different from the frequency measured by the QVOA (median of 3.3 [1.9-6.2] IUPM). The latently infected cells detected by the inducible cf-RNA assay correlated highly with the QVOA ( r= 0.67, p < .001), and both assays were equivalent in 60% of the samples tested, suggesting that most cells induced to produce virions are generating replication-competent virus.

Interpretation: These inducible RNA assays provide more sensitivity and a greater dynamic range for the monitoring of reduction of the reservoir by eradication strategies. Such assays may serve as robust and useful tools for clinical investigations of the HIV reservoir.

Keywords: Eradication; HIV reservoir; Inducible HIV RNA; Latency; VOA.


Figures

Fig. 1
Fig. 1
Modified Quantitative viral outgrowth assay (mQVOA). Total CD4+ T cells from ART-suppressed individuals (n = 32) were stimulated for 2 days with plate bound anti-CD3/CD28 antibodies, after which feeder cells (MOLT-4/CCR5 cells) were added. Cultures were split twice weekly and culture supernatants were collected at days 7 and 14. (A) Infectious units per million (IUPM) of assayed CD4+ T cells were calculated using the online calculator (http://silicianolab.johnshopkins.edu/) at day 7 or 14 and compared to the IUPM for wells positive at both days 7 and 14 (Positive both days IUPM), or for wells positive at either time point (Cumulative IUPM). Log10 transformed individual values and median IUPM are shown. One-way ANOVA p-values are indicated. (B) Correlation matrix between the different log10 transformed IUPM calculated from panel A are plotted. Coefficients of correlation and p-values were obtained from Pearson test. The colour and width of the ellipse show the strength of the correlation between two variables (a narrow ellipse indicates stronger correlation) and tilt the direction. (C) For each individual, we show the percentage of wells considered positive at day 7 and 14 (in yellow), only positive at day 7 (green) or only positive at day 14 (blue). (D) Mean data from panel C are summarized.
Fig. 2
Fig. 2
Characterization of Inducible RNA Assays. Limiting dilution of CD4+ T cells from ART-suppressed subjects (n = 19) were stimulated with anti-CD3/CD28 antibodies for 3 days in the presence of raltegravir. Activated cells as well as culture supernatants were extracted and analyzed for HIV RNA production by ddPCR. The frequencies of the inducible reservoir for each transcript were calculated using the same online calculator as for mQVOA (http://silicianolab.johnshopkins.edu/). (A) Inducible RNA assays can concomitantly quantify in each well the frequency of cells producing ca-RNA, including usRNA gag (green) and msRNA tat-rev (blue) and viral production (cf-RNA, red), as shown in supplemantary figure 3. For each individual, the frequency of cells expressing a given HIV RNA transcript and upper and lower CI95 are plotted. (B) For each individual, the proportion of wells with 3, 2, 1 or 0 RNA transcripts detected in the same well are shown. Pie charts were ordered by IUPM from mQVOA (when available) highlighting the correlation between cf-RNA and mQVOA. (C) Estimation of the copies of HIV RNA usRNA gag, msRNA and viral particles produced per cell in the inducible RNA assay. Total RNA copies from the limiting dilution assay (sum of all positive wells) were normalized by the frequency of cells expressing a given transcript. Log10 transformed individual values and medians are shown. One-way ANOVA p-values are indicated.
Fig. 3
Fig. 3
Comparison of HIV reservoir measured by five different assays. (A) The frequency of cells harboring replication competent virus measured by mQVOA was compared with the inducible reservoir, measured as the frequency of cells expressing gag ca-RNA, tat-rev ca-RNA or production of viral particles upon stimulation. In addition, total HIV DNA (gag) was quantified in all samples. Log10 transformed individual values and medians are shown. P-values were obtained with the student t-test for paired data. Fold-changes between mQVOA and other assays are indicated. (B) Correlation matrices between the frequencies of cells harboring HIV reservoir from Panel A are plotted (log10 transformed data). Coefficients of correlation and p-values were obtained with Pearson test. The colour and size of the circle show the strength of the correlation between two variables (a bigger circles and darker colors indicate stronger correlations). (C) Correlations between the IUPM (measured by mQVOA at day 14) and the frequency of cells harboring virus with the capacity to produce viral particles (measured by inducible cf-RNA assay). Upper and lower 95% confidence intervals are plotted for both assays. Taking into account the upper and lower 95% confidence intervals, we calculated when mQVOA and inducible cf-RNA assay had equivalent (in blue) or non-equivalent (in red) frequencies. (D) Five million CD4+ T cells were stimulated with anti-CD3/CD28 plate bound in bulk for 3 days in the presence of raltegravir. Supernatant was collected and cf-RNA was extracted, quantified by ddPCR and normalized to the number of CD4+ T cells. Log10 transformed cf-RNA copies per million of CD4+ T cells were correlated with the IUPM measured by mQVOA (day 14). Coefficients of correlation and p-values were obtained from Pearson test.

References

    1. Wong J.K., Hezareh M., Günthard H.F., Havlir D.V., Ignacio C.C., Spina C.A. Recovery of replication-competent HIV despite prolonged suppression of plasma viremia. Science. 1997 Nov 14;278(5341):1291–1295. - PubMed
    1. Finzi D., Hermankova M., Pierson T., Carruth L.M., Buck C., Chaisson R.E. Identification of a reservoir for HIV-1 in patients on highly active antiretroviral therapy. Science. 1997 Nov 14;278(5341):1295–1300. - PubMed
    1. Chun T.W., Engel D., Berrey M.M., Shea T., Corey L., Fauci A.S. Early establishment of a pool of latently infected, resting CD4(+) T cells during primary HIV-1 infection. Proc Natl Acad Sci U S A. 1998 Jul 21;95(15):8869–8873. - PMC - PubMed
    1. Richman D.D., Margolis D.M., Delaney M., Greene W.C., Hazuda D., Pomerantz R.J. The challenge of finding a cure for HIV infection. Science. 2009 Mar 6;323(5919):1304–1307. - PubMed
    1. Archin N.M., Liberty A.L., Kashuba A.D., Choudhary S.K., Kuruc J.D., Crooks A.M. Administration of vorinostat disrupts HIV-1 latency in patients on antiretroviral therapy. Nat. Nature Publishing Group. 2012 Jul 17;487(7408):482–485. - PMC - PubMed

MeSH terms