. 2018 Nov 21;100(4):831-845.e7.
doi: 10.1016/j.neuron.2018.09.027. Epub 2018 Oct 11.

Neonatal Tbr1 Dosage Controls Cortical Layer 6 Connectivity

Affiliations

Neonatal Tbr1 Dosage Controls Cortical Layer 6 Connectivity

Siavash Fazel Darbandi et al. Neuron. .

Abstract

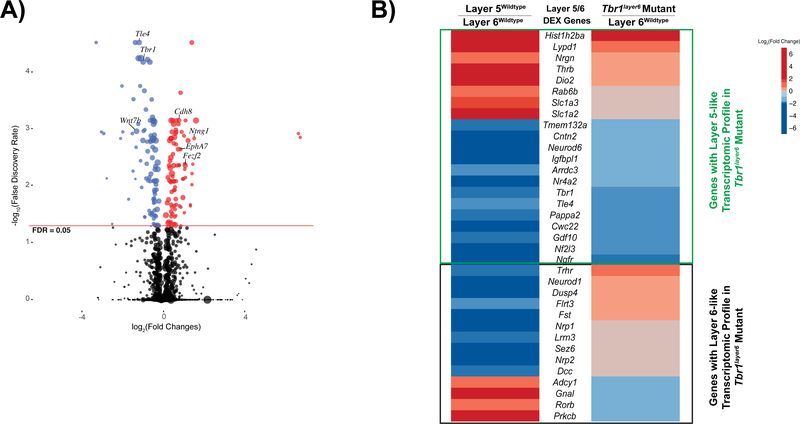
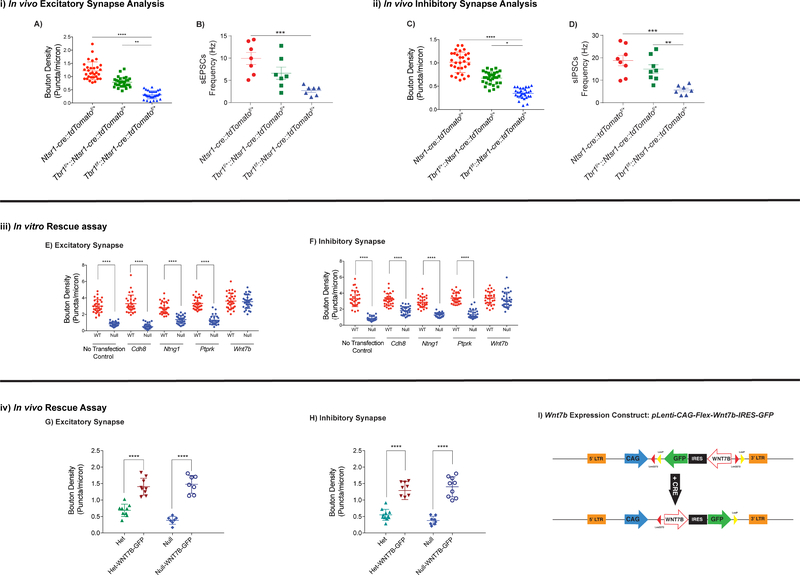
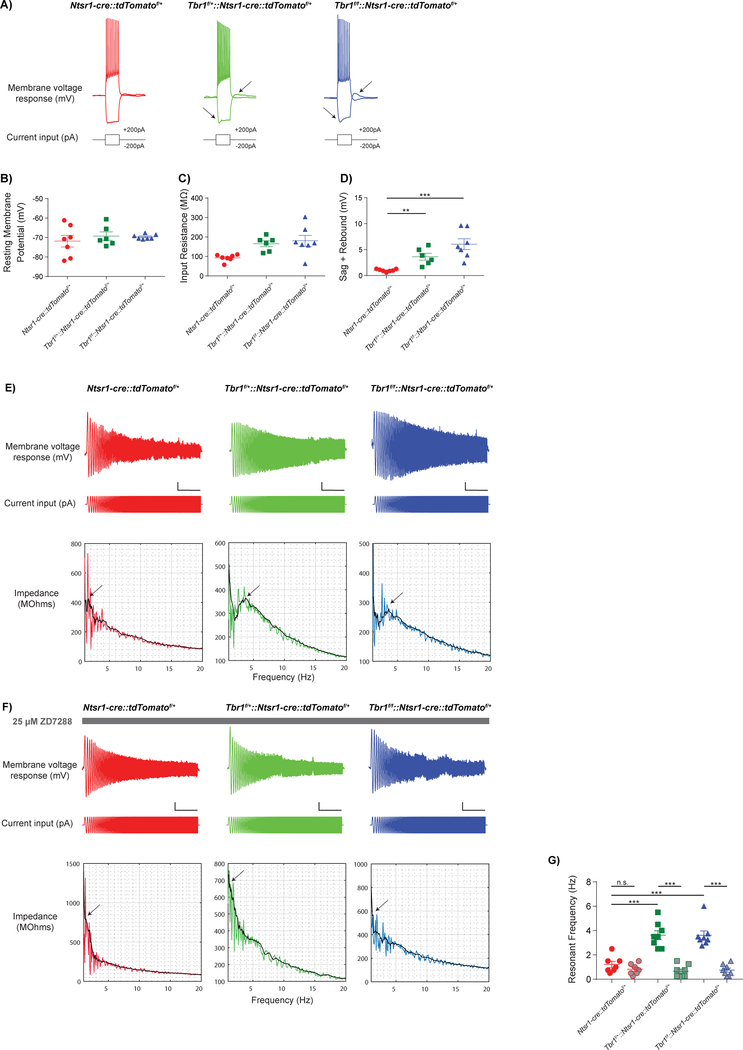
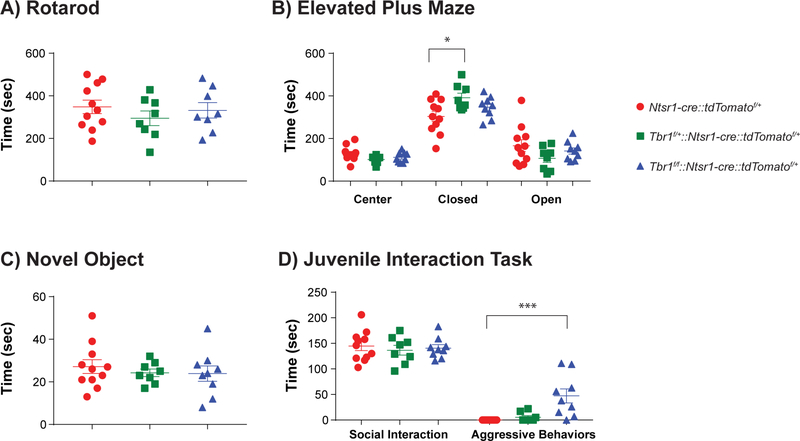
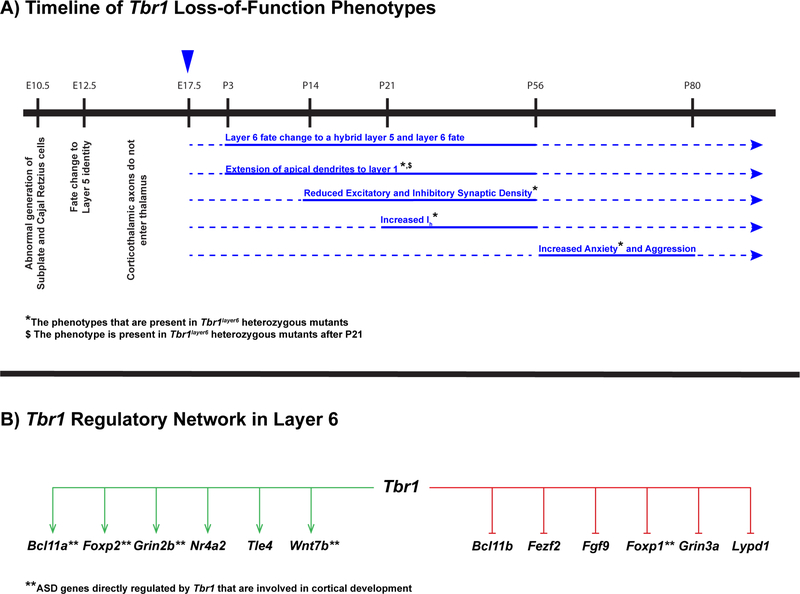
An understanding of how heterozygous loss-of-function mutations in autism spectrum disorder (ASD) risk genes, such as TBR1, contribute to ASD remains elusive. Conditional Tbr1 deletion during late mouse gestation in cortical layer 6 neurons (Tbr1layer6 mutants) provides novel insights into its function, including dendritic patterning, synaptogenesis, and cell-intrinsic physiology. These phenotypes occur in heterozygotes, providing insights into mechanisms that may underlie ASD pathophysiology. Restoring expression of Wnt7b largely rescues the synaptic deficit in Tbr1layer6 mutant neurons. Furthermore, Tbr1layer6 heterozygotes have increased anxiety-like behavior, a phenotype seen ASD. Integrating TBR1 chromatin immunoprecipitation sequencing (ChIP-seq) and RNA sequencing (RNA-seq) data from layer 6 neurons and activity of TBR1-bound candidate enhancers provides evidence for how TBR1 regulates layer 6 properties. Moreover, several putative TBR1 targets are ASD risk genes, placing TBR1 in a central position both for ASD risk and for regulating transcriptional circuits that control multiple steps in layer 6 development essential for the assembly of neural circuits.

Keywords: ASD; Tbr1; aggression; anxiety-like behavior; cortical development; development; layer 6; synapses.


Conflict of interest statement

Declaration of Interests

J.L.R.R. is cofounder, stockholder, and currently on the scientific board of Neurona, a company studying the potential therapeutic use of interneuron transplantation.

Figures

Figure 1.
Figure 1.. Tbr1 transcriptional regulation in the neonatal cortex.
(A) Volcano plot of genes up-regulated (red) and downregulated (blue) in FACS purified layer 6 neurons from P5 Tbr1layer6 homozygous mutant SSCx. Black dots represent the genes that did not reach statistical significance (adjusted p value > 0.05). The size of each point represents the difference in the median gene expression between Tbr1wildtype and Tbr1layer6 mutant (large dots mean large differences). (B) P5 transcriptomic comparison of DEX genes between layer 5wildtype vs. layer 6wildtype and Tbr1layer6 homozygotes vs. layer6wildtype. With respect to genes that mark wildtype layer 5 (red genes), we observed eight genes with increased expression in the Tbr1layer6 mutants (p < 0.05). With respect to genes that mark wildtype layer 6 (blue genes), we observed 13 with reduced expression in the Tbr1layer6 mutants (p < 0.05). However, there were 14 of the layer 5 and layer 6 marker genes whose expression did not significantly change in the Tbr1layer6 mutants (Fig. 1B). Genes with layer 5-like transcriptome profile (green box) and layer 6-like expression profile (black box) are indicated. See also Figure S1 and Tables S1, S2 and S3.
Figure 2
Figure 2. Tbr1 is required to maintain layer 6 identity in postnatal cortex.
In situ hybridization on SSCx coronal sections of Tbr1wildtype (A-J), Tbr1layer6 heterozygous (Tbr1f/+::Ntrs1-cre) (A´-J´), and Tbr1layer6 homozygous mutants (Tbr1f/f::Ntrs1-cre) (A´´- J´´) at P3 (n=2). In Tbr1layer6 heterozygotes and homozygotes, Tbr1 (A-A´´), Nr4a2 (B-B´´), Wnt7b (EE´´), and Bcl11a (F-F´´) expressions are reduced in layer 6 and subplate. The expression of Tbr1 and Wnt7b are increased in the superficial layers (A-A´´, E-E´´). The expression of Foxp2 (C, C´´) and Tle4 (D, D´´) are reduced in layer 6alower of Tbr1layer6 homozygous mutants. Tbr1layer6 heterozygotes and homozygotes exhibit an ectopic expression of Fezf2 (H-H´´) in layer 6. In Tbr1layer6 homozygous mutants, Bcl11b (G, G´´) and Foxp1 (I-I´´) are ectopically expressed in layer 6. Furthermore, Tbr1layer6 mutants exhibit changes in the number and laminar distribution of Sst+ CINs (J-J´´). Transcriptome levels of each gene is reflected as downregulated (red), upregulated (green) and unchanged (black) in Tbr1layer6 mutants. II-IV = layers 2–4, V = layer 5, VI = layer 6. VIb = Subplate. Scale bar = 50μm. See also Figure S2, Table S4.
Figure 3
Figure 3. Genome-wide analysis of TBR1 binding and transcriptional regulation of candidate enhancer regions in loci adjacent to Tbr1-regulated genes.
(A) Heatmap of TBR1 ChIP-seq replicates compared to the controls. (B) Summary of the genomic distribution of TBR1 ChIP-Seq peaks at P2. (C) TBR1 canonical motif. (D) TBR1 ChIP-Seq on wildtype whole cortex at P2 (red tracks). Red boxes represent the TBR1 binding that reached statistical significance. Genes are shown in blue. Candidate REs that were tested in the luciferase transcription assay are highlighted in green. Black boxes indicate REs that have proven enhancer activity in E11.5 cortex corresponding to hs416 (Tbr1 locus), hs434 (Fezf2 locus) and hs399 (Bcl11a locus). Black arrow indicates the direction of transcription. Genomic scale (in kb) are shown for each locus. (E) Luciferase transcription assay was utilized to measure activity of Tbr1, Foxp2, Grin2b, Bcl11a, Foxp1, Fezf2, Hcn1 candidate enhancers in P0 primary cortical cultures. The reporter activity was measured under enhancer alone (red) and enhancer co-transfected with TBR1 (grey). TBR1 activates candidate REs of Tbr1 (FC= 2.3, p= 0.0007), Foxp2 (FC= 2.17, p= 0.0023), Grin2b (FC= 4.11, p= 0.0015), and Bcl11a (FC= 3.46, p= 0.0002), whereas it represses candidate REs of Foxp1 (FC= −2.52, p= 0.0087), Fezf2 (FC= −2.55, p= 0.0015) and Hcn1 (FC= −2.9, p=0.0248). I56i enhancer and pGL4.23 empty vectors were used as negative controls. The error bars represent the standard error of the mean. (*) represents the transcript fold-change using qPCR. T-test with Welch’s correction was used for the statistical analysis. (*p<0.05) (**p< 0.01) (***p<0.001). Rep1=Replicate 1, Rep2=Replicate 2, BP=blocking peptide, TSS=Transcriptional Start Site, FC=Fold Change. See also Figure S4, Tables S5, S6.
Figure 4:
Figure 4:. Ectopic growth of layer 6 apical dendrites into superficial layer 1 in Tbr1layer6 mutants.
The endogenous tdTomato fluorescence (red) in the SSCx of Control (Ntsr1-cre::tdTomatof/+) (A-C), Tbr1layer6 heterozygous (Tbr1f/+::Ntsr1-cre::tdTomatof/+) (A´-C´), and Tbr1layer6 homozygous mutants (Tbr1f/f::Ntsr1-cre::tdTomatof/+) (A´´-C´´). These mice had the Ntsr1cre::tdTomatof/+ alleles to label the layer 6 cell bodies and their dendrites. Changes in the dendritic patterning of layer 6 neurons were examined at P3 (A-A´´), P21 (B-B´´) and P56 (CC´´). White arrowheads indicate some of the apical dendrites extending through layers 2/3 to layer 1 in Tbr1layer6 mutants. Orange arrowheads indicates a group of apical dendrites that only extend to layers 2/3. Cortical layers are labelled. Scale bar: 50μm. See also Figure S4.
Figure 5:
Figure 5:. Tbr1 is required for the excitatory and inhibitory synaptic development of layer 6 pyramidal neurons at P56.
(i) Excitatory synapses were analyzed via synaptic bouton staining onto apical dendrites of layer 6 neurons (n=30) and spontaneous EPSC (sEPSC) recordings from the soma of Tbr1 wildtype, Tbr1layer6 heterozygous, and Tbr1layer6 homozygous mutants at P56. Ntsr1-cre::tdTomatof/+ allele was used to label the layer 6 neurons. ImageJ software was used to process confocal images for quantification. Excitatory synapses were analyzed by VGlut1+ boutons and PSD95+ clusters colocalizing onto the dendrites of layer 6 neurons. (A) Quantification of excitatory synaptic density at P56. (B) Quantification of the sEPSC frequency in layer 6 neurons at P56. (ii) Inhibitory synapses were examined by synaptic bouton staining onto apical dendrites of layer 6 neurons and spontaneous IPSC (sIPSC) recordings from the soma of the layer 6 neurons of Tbr1 wildtype, Tbr1layer6 heterozygous, and Tbr1layer6 homozygous mutants at P56. Inhibitory synaptic input was measured by VGat+ boutons and Gephyrin+ clusters co-localizing onto the dendrites of layer 6 neurons. (C) Quantification of inhibitory synaptic density at P56. (D) Quantification of the sIPSC frequency in layer 6 neurons at P56. (iii) In vitro rescue assay was conducted using Cdh8, Ntng1, Ptprk and Wnt7b expression vectors in cultured P0 cells from Tbr1wildtype (red) and Tbr1layer6 mutant (blue) (n=2). (E, F) Quantification of excitatory and inhibitory synaptic density in vitro. (iv) In vivo rescue assay was conducted by injecting Wnt7b-IRES-GFP lentivirus into the layer 6 of SSCx of Tbr1layer6 heterozygous and Tbr1layer6 homozygous mutants at P1. (G, H) Quantification of excitatory and inhibitory synapse numbers onto the layer 6 neurons of Tbr1layer6 heterozygous (Het) and Tbr1layer6 homozygous mutants (Null) expressing GFP at P21. (I) Schematic representation of the lentiviral CAG-Flex-Wnt7b-IRES-GFP (Wnt7b-IRES-GFP expressing) construct. CRE inverts the Wnt7b coding region enabling its expression. Two-way ANOVA was used for the statistical analysis of the control, heterozygote and null. Two-tailed Ttest with tukey correction was used for pairwise comparisons. (*p<0.05) (**p< 0.01) (***p<0.001) (****p<0.0001). See also Figure S5.
Figure 6:
Figure 6:. Loss of Tbr1 in layer 6 somatosensory cortex results in an increase in hyperpolarization-activated cation currents (Ih).
Whole-cell patch clamp recordings from layer 6 SSCx at P56 (A-D) show that many intrinsic electrophysiological properties were unaffected by loss of Tbr1, including resting membrane potential (B), input resistance (C), and action potential half-width (data not shown). (E) Neurons were held in current clamp at −70mV. The resonant frequency was measured as the frequency at which the impedance profile reached its peak (arrows). Scale bar = 5 mV, 5 s. (F) ZD7288, an HCN channel blocker, decreased resonance frequency by over 50% in Tbr1layer6 heterozygous (green), and Tbr1layer6 homozygous mutants (blue). (G) Quantification of changes in resonant frequency of Tbr1wildtype (red), Tbr1layer6 heterozygous (green) and Tbr1layer6 homozygous mutants (blue) after ZD7288 treatment. (**p< 0.01) (***p<0.001). See also Figure S6.
Figure 7:
Figure 7:. Tbr1layer6 mutants exhibit increased aggressive and anxiety-like behavior at P56P80.
Behavioral analysis of Tbr1wildtype (red), Tbr1layer6 heterozygous (green), and Tbr1layer6 homozygous mutants (blue). (A) Rotarod assay did not demonstrate any impaired movement or motor coordination in Tbr1layer6 mutants. (B) Tbr1layer6 heterozygous (green) mutants spent more time in the closed arm of the elevated plus maze (an anxiety-like phenotype) compared to their Tbr1wildtype littermates. (C) Loss of Tbr1 did not affect the time spent engaged in novel object exploration or (D) social interactions. (D) Tbr1layer6 homozygous mutants (blue) exhibited aggressive behaviors when interacting with a novel juvenile mouse. Two-tailed T-test with tukey correction was used for pairwise comparisons (*p<0.05) (***p<0.001).
Figure 8:
Figure 8:
(A) Schematic representation of a timeline of Tbr1 loss-of-function phenotypes from embryonic stages until adulthood in mouse. The blue arrowhead at E17.5 corresponds to the timing of knocking out Tbr1 in layer 6 using conditional mutagenesis. Postnatal phenotypes associated with Tbr1 loss-of-function are shown in blue. Solid lines correspond to the developmental window in which we have provided evidence for the reported phenotypes. Dotted line represents the presumed duration of the reported phenotypes. (*) Indicates the phenotypes that are observed in Tbr1layer6 heterozygotes and homozygotes. (B) Schematic representation of regulatory network of Tbr1 in cortical layer 6. Tbr1 is a repressor (red) of determinants of layer 5 identity including Bcl11b, Fezf2, Fgf9, Foxp1, Grin3a and Lypd1. Conversely, Tbr1 dictates layer 6 identity through activation (green) of layer 6 markers including Bcl11a, Foxp2, Grin2b, Nr4a2, Tle4 and Wnt7b. (**) Indicates ASD genes directly regulated by Tbr1 (TBR1 genomic binding and expression changes in the mutant) that are involved in cortical development.

References

    1. BEDOGNI F, HODGE RD, ELSEN GE, NELSON BR, DAZA RAM, BEYER RP, BAMMLER TK, RUBENSTEIN JLR & HEVNER RF (2010). Tbr1 regulates regional and laminar identity of postmitotic neurons in developing neocortex. Proceedings of the National Academy of Sciences, 107, 13129–13134. https://doi.org/10.1073/pnas.1002285107 - DOI - PMC - PubMed
    1. BUDNIK V & SALINAS PC (2011). Wnt signaling during synaptic development and plasticity. Current Opinion in Neurobiology, 21, 151–159. https://doi.org/10.1016/j.conb.2010.12.002 - DOI - PMC - PubMed
    1. BULFONE A, SMIGA SM, SHIMAMURA K, PETERSON A, PUELLES L & RUBENSTEIN JLR (1995). T-Brain-1: A homolog of Brachyury whose expression defines molecularly distinct domains within the cerebral cortex. Neuron, 15, 63–78. https://doi.org/10.1016/0896-6273(95)90065-9 - DOI - PubMed
    1. BULFONE A, WANG F, HEVNER R, ANDERSON S, CUTFORTH T, CHEN S, MENESES J, PEDERSEN R, AXEL R & RUBENSTEIN JLR (1998). An Olfactory Sensory Map Develops in the Absence of Normal Projection Neurons or GABAergic Interneurons. Neuron, 21, 1273–1282. https://doi.org/10.1016/S08966273(00)80647-9 - DOI - PubMed
    1. CHEVÉE M, ROBERTSON JDJ, CANNON GH, BROWN SP & GOFF LA (2018). Variation in Activity State, Axonal Projection, and Position Define the Transcriptional Identity of Individual Neocortical Projection Neurons. Cell Reports, 22, 441–455. https://doi.org/10.1016/j.celrep.2017.12.046 - DOI - PMC - PubMed

Publication types