. 2018 Nov 15;72(4):687-699.e6.
doi: 10.1016/j.molcel.2018.09.005. Epub 2018 Oct 11.

Spt6 Is Required for the Fidelity of Promoter Selection

Affiliations

Spt6 Is Required for the Fidelity of Promoter Selection

Stephen M Doris et al. Mol Cell. .

Abstract

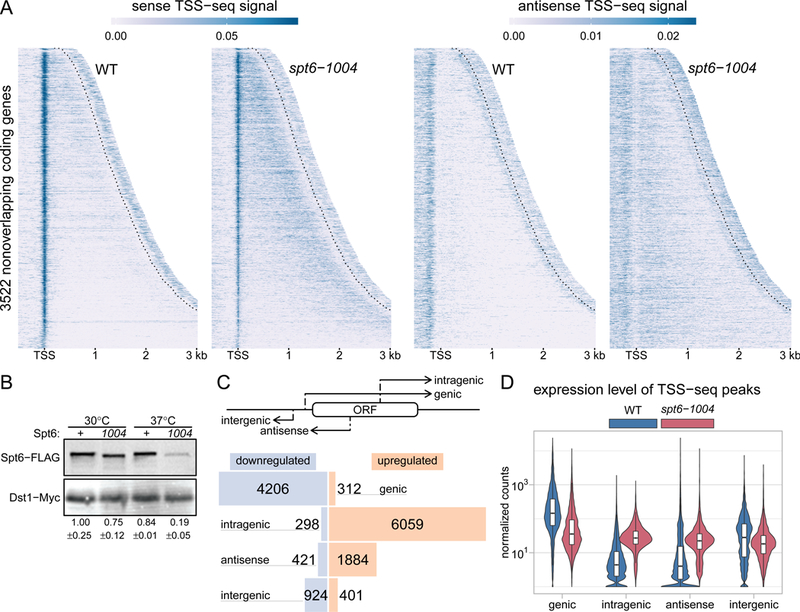
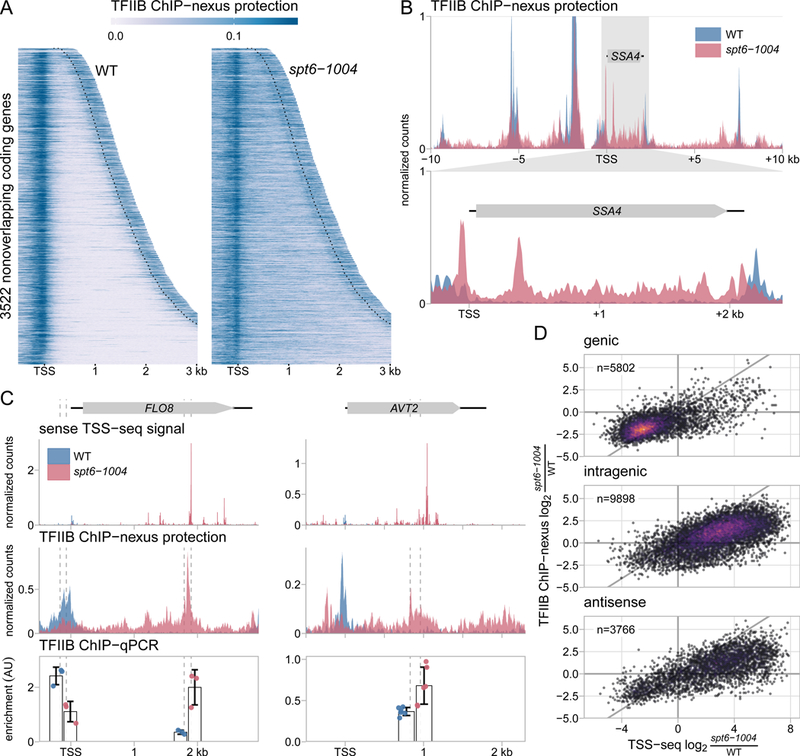
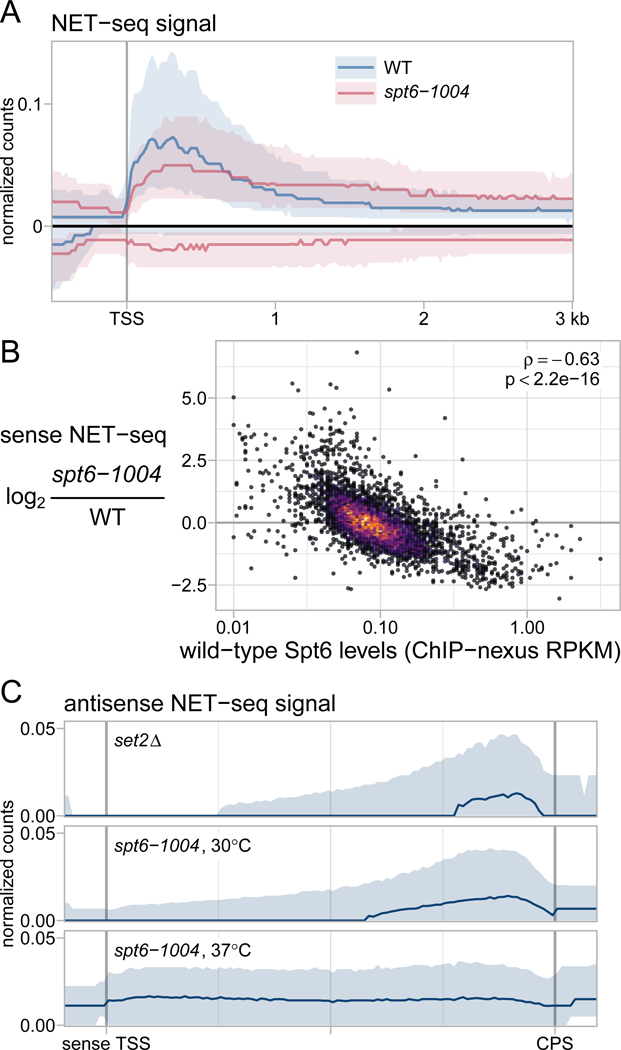
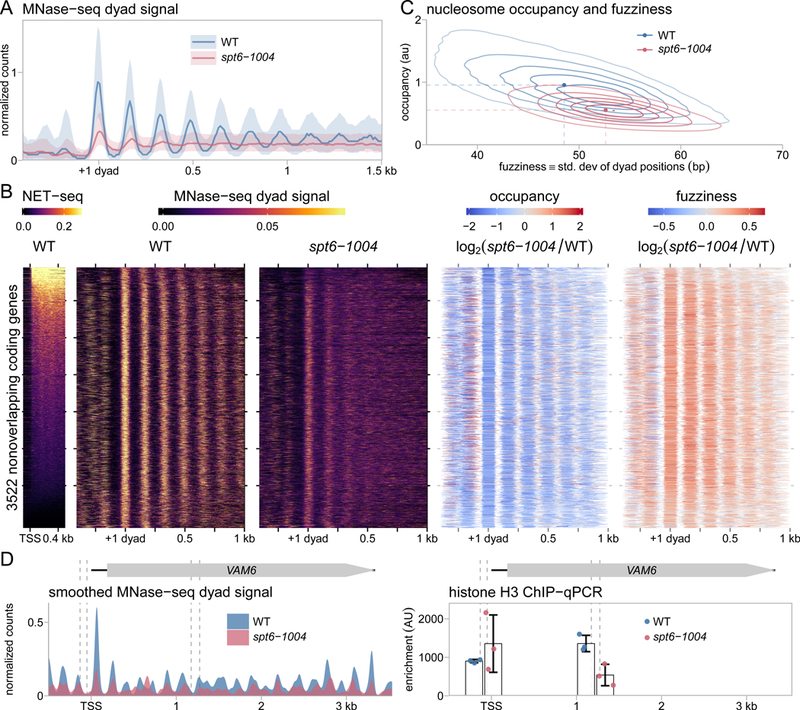
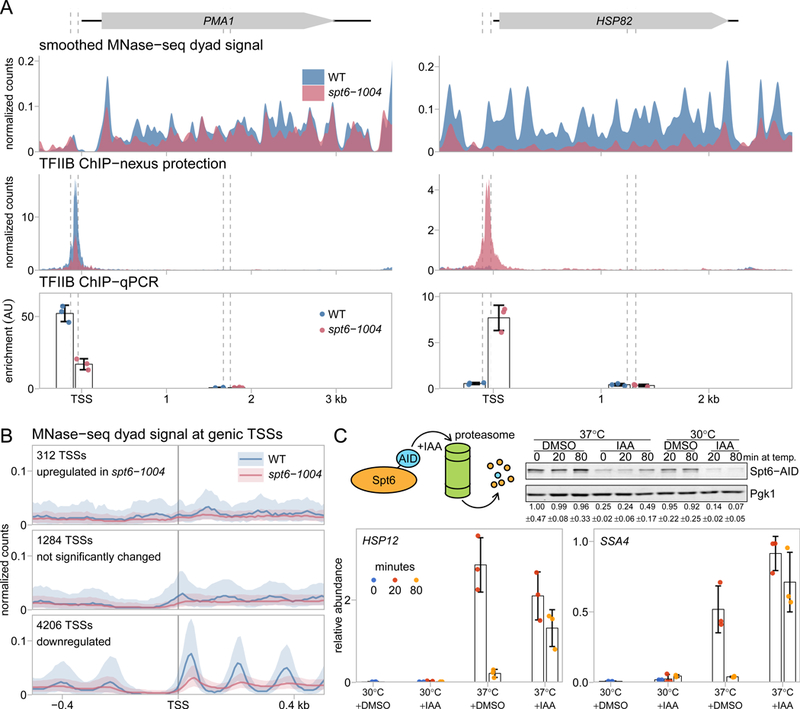
Spt6 is a conserved factor that controls transcription and chromatin structure across the genome. Although Spt6 is viewed as an elongation factor, spt6 mutations in Saccharomyces cerevisiae allow elevated levels of transcripts from within coding regions, suggesting that Spt6 also controls initiation. To address the requirements for Spt6 in transcription and chromatin structure, we have combined four genome-wide approaches. Our results demonstrate that Spt6 represses transcription initiation at thousands of intragenic promoters. We characterize these intragenic promoters and find sequence features conserved with genic promoters. Finally, we show that Spt6 also regulates transcription initiation at most genic promoters and propose a model of initiation site competition to account for this. Together, our results demonstrate that Spt6 controls the fidelity of transcription initiation throughout the genome.

Keywords: Spt6; chromatin structure; intragenic promoters; transcription start sites.


Conflict of interest statement

DECLARATION OF INTERESTS

The authors declare no competing interests.

Figures

Figure 1.
Figure 1.
Spt6 is globally required for normal transcription initiation. (A) Heatmaps of sense and antisense TSS-seq signal in wild-type and spt6-1004 strains, over 3522 non-overlapping genes aligned by wild-type genic TSSs and sorted by length. Data are shown for each gene up to 300 nucleotides 3’ of the cleavage and polyadenylation site (CPS; indicated by the dotted line). Values are the mean of spike-in normalized coverage in non-overlapping 20 nucleotide bins, averaged over two replicates. Values above the 95th percentile are set to the 95th percentile for visualization. (B) Western blot showing levels of Spt6 protein in wild-type and spt6-1004 at 30˚C and after an 80-minute shift to 37˚C. Protein levels were quantified using anti-FLAG antibody to detect Spt6 and anti-Myc to detect Dst1 from a spike-in strain (see Methods). The numbers below the blot show the mean and standard deviation for three Westerns. (C) The diagram at the top illustrates the different classes of TSSs. The bar plot below shows the number of TSS-seq peaks differentially expressed from DESeq2 in spt6-1004 versus wild-type (see Methods), classified by genomic region. Blue bars indicate downregulated peaks and orange bars indicate upregulated peaks. (D) Violin plots showing the expression level distributions for different genomic classes of TSS-seq peaks in wild-type and spt6-1004 strains. Values are the mean of counts from two replicates, normalized using an S. pombe spike-in (see Methods).
Figure 2.
Figure 2.
Spt6 is required for genome-wide localization of TFIIB. (A) Heatmaps of TFIIB binding as measured by ChIP-nexus in wild-type and spt6-1004 strains, over the same regions shown in Figure 1A. The values are the mean of library-size normalized coverage in 20 basepair windows, averaged over two replicates. The position of the CPS is shown by the dotted lines. Values above the 85th percentile are set to the 85th percentile for visualization. (B) The upper panel shows TFIIB binding in wild-type and spt6-1004 strains over 20 kb of chromosome II flanking the SSA4 gene, as measured by TFIIB ChIP-nexus. The lower panel shows an expanded view of TFIIB binding over the SSA4 gene. (C) TSS-seq, TFIIB ChIP-nexus, and TFIIB ChIP-qPCR measurements at the genic and intragenic promoters of the FLO8 and AVT2 genes in wild-type and spt6-1004 strains. TSS-seq counts are normalized to spike-in, ChIP-nexus values are normalized to library size, and ChIP-qPCR is normalized to amplification of a region of the S. pombe pma1+ gene used as a spike-in control. Vertical dashed lines represent the coordinates of qPCR amplicon boundaries. (D) Scatterplots of fold-change in spt6-1004 over wild-type strains, comparing TSS-seq and TFIIB ChIP-nexus. Each dot represents a TSS-seq peak paired with the window extending 200 nucleotides upstream of the TSS-seq peak summit for quantification of TFIIB ChIP-nexus signal. Fold-changes are regularized fold-change estimates from DESeq2, with size factors determined from the S. pombe spike-in (TSS-seq) or the S. cerevisiae counts (ChIP-nexus). The diagonal line is y=x.
Figure 3.
Figure 3.
Spt6 is required for normal levels and distribution of elongating RNA polymerase II. (A) The average sense and antisense NET-seq signal in wild-type and spt6-1004 strains after a shift to 37˚C, over 3522 nonoverlapping genes. Sense and antisense signals are depicted above and below the x-axis, respectively. The solid line and shadings represent the median and inter-quartile range, which are shown in order to give an idea of how the signal varies among the thousands of genes with diverse characteristics being represented in the plot. The values are the mean of library-size normalized coverage in nonoverlapping 20 nucleotide bins, averaged over two replicates. (B) A scatterplot of NET-seq fold-change in the spt6-1004 mutant versus Spt6 occupancy in the wild-type strain as measured by Spt6 ChIP-nexus. Each dot represents NET-seq and Spt6 ChIP-nexus sense-strand signals summed over the entire length of the transcription unit. NET-seq fold-changes are regularized fold-change estimates from DESeq2. The Pearson correlation coefficient and associated p-value (Student’s t-distribution) are shown. (C) Average antisense NET-seq signal in the spt6-1004 strain at permissive (30˚C) and nonpermissive (37˚C) temperatures, compared to a set2Δ strain. The values are as in Figure 3A, with the solid line and shadings representing the median and inter-quartile range over 3522 nonoverlapping genes scaled to the same length.
Figure 4.
Figure 4.
Genome-wide defects in chromatin structure in an spt6-1004 mutant. (A) Average MNase-seq dyad signal in wild-type and spt6-1004 strains, over 3522 nonoverlapping genes. The values are the mean of spike-in normalized coverage in nonoverlapping 20 nucleotide bins, averaged over two replicates (spt6-1004) or one experiment (wild-type). The solid line and shadings represent the median and inter-quartile range. (B) The leftmost panel shows the NET-seq signal in a window extending 500 nucleotides downstream of the TSS, sorted from top to bottom by the level of the signal. The second and third panels show heatmaps of the spike-in normalized MNase-seq dyad signal from wild-type and spt6-1004 strains over 3522 nonoverlapping coding genes aligned by wild-type +1 nucleosome dyad and sorted by total sense NET-seq signal. The last two panels show the spike-in normalized changes in nucleosome occupancy and fuzziness. The increased occupancy indicated just upstream of the +1 dyad is likely caused by nucleosomes occupying NDRs in the spt6-1004 mutant. (C) A contour plot showing the global distribution of nucleosome occupancy and fuzziness in wild-type and spt6-1004 strains. (D) MNase-seq and histone H3 ChIP-qPCR measurements of nucleosome signal at the VAM6 gene in wild-type and spt6-1004 strains. MNase-seq coverage is spike-in normalized dyad signal, smoothed using a Gaussian kernel with a 20 bp standard deviation, and averaged by taking the mean of two replicates (spt6-1004) or one experiment (wild-type). Histone H3 ChIP-qPCR enrichment is normalized to amplification at the S. pombe pma1+ gene as a spike-in control. Vertical dashed lines represent the coordinates of the qPCR amplicon boundaries.
Figure 5.
Figure 5.
Chromatin structure and sequence features of intragenic promoters. (A) The average MNase-seq dyad signal and GC percentage for two clusters of intragenic TSSs that are upregulated in an spt6-1004 mutant, as well as all genic TSSs detected in wild type or spt6-1004. The clusters were determined from the MNase-seq signal flanking the TSS (see Methods). (B) Violin plots showing the distributions of TSS-seq signal for the two clusters of intragenic TSSs that are upregulated in an spt6-1004 mutant, and the distributions of their TFIIB ChIP-nexus signal in the window extending 200 nucleotides upstream of the TSS-seq peak. Counts are size factor normalized using the S. pombe spike-in (TSS-seq) or S. cerevisiae counts (TFIIB ChIP-nexus). (C) Sequence logos of the information content of TSS-seq reads overlapping genic and intragenic peaks in spt6-1004 cells. (D) Scaled density of the TATA box upstream of TSSs. For each category, a Gaussian kernel density estimate of the positions of exact matches to the motif TATAWAWR is multiplied by the total number of TATA occurrences in the category and divided by the total number of regions in the category. (E) Volcano plot of motif enrichment and depletion upstream of intragenic TSSs upregulated in spt6-1004. Odds ratios and false discovery rate are determined by Fisher’s exact test, comparing to random locations in the genome. Factors may appear more than once if they have multiple motifs in the databases that were searched.
Figure 6.
Figure 6.
Spt6 function is necessary to control genic transcription. (A) MNase-seq, TFIIB ChIP-nexus, and TFIIB ChIP-qPCR measurements at the PMA1 and HSP82 genes in wild-type and spt6-1004 strains, plotted as in 2B and 4D. For the ChIP-qPCR analysis, the mean and standard deviation are plotted for three experiments. (B) The average MNase-seq dyad signal at genic TSSs in wild-type and spt6-1004 strains, grouped by the differential expression status of the TSS. The solid line and shading represent the median and inter-quartile range. (C) RT-qPCR analysis of HSP12 and SSA4 RNA levels, testing the effects of temperature shift and Spt6 depletion. The top left panel shows a diagram of auxin-dependent degradation system used to deplete Spt6 and the top right panel shows a Western measuring the level of Spt6 protein, with and without depletion. The bottom panels show the RNA levels for HSP12 and SSA4 at times after a temperature shift from 30˚C to 37˚C. In these experiments, either DMSO or IAA were added 30 minutes before the zero time point. Plotted are the mean and standard deviation for three experiments, normalized to SNR190 RNA.

References

    1. Adkins MW, and Tyler JK (2006). Transcriptional activators are dispensable for transcription in the absence of Spt6-mediated chromatin reassembly of promoter regions. Mol Cell 21, 405–416. - PubMed
    1. Anandhakumar J, Moustafa YW, Chowdhary S, Kainth AS, and Gross DS (2016). Evidence for Multiple Mediator Complexes in Yeast Independently Recruited by Activated Heat Shock Factor. Mol Cell Biol 36, 1943–1960. - PMC - PubMed
    1. Andrews S (2014). FastQC: a quality control tool for high throughput sequence data. In Babraham Bioinformatics
    1. Andrulis ED, Guzman E, Doring P, Werner J, and Lis JT (2000). High-resolution localization of Drosophila Spt5 and Spt6 at heat shock genes in vivo: roles in promoter proximal pausing and transcription elongation. Genes Dev 14, 2635–2649. - PMC - PubMed
    1. Ardehali MB, Yao J, Adelman K, Fuda NJ, Petesch SJ, Webb WW, and Lis JT (2009). Spt6 enhances the elongation rate of RNA polymerase II in vivo. EMBO J 28, 1067–1077. - PMC - PubMed

Publication types

MeSH terms