. 2018 Dec 20;25(12):1495-1505.e3.
doi: 10.1016/j.chembiol.2018.09.009. Epub 2018 Oct 11.

A Lysine Acetyltransferase Contributes to the Metabolic Adaptation to Hypoxia in Mycobacterium tuberculosis

Affiliations

A Lysine Acetyltransferase Contributes to the Metabolic Adaptation to Hypoxia in Mycobacterium tuberculosis

Emily S C Rittershaus et al. Cell Chem Biol. .

Abstract

Upon inhibition of respiration, which occurs in hypoxic or nitric oxide-containing host microenvironments, Mycobacterium tuberculosis (Mtb) adopts a non-replicating "quiescent" state and becomes relatively unresponsive to antibiotic treatment. We used comprehensive mutant fitness analysis to identify regulatory and metabolic pathways that are essential for the survival of quiescent Mtb. This genetic study identified a protein acetyltransferase (Mt-Pat/Rv0998) that promoted survival and altered the flux of carbon from oxidative to reductive tricarboxylic acid (TCA) reactions. Reductive TCA requires malate dehydrogenase (MDH) and maintains the redox state of the NAD+/NADH pool. Genetic or chemical inhibition of MDH resulted in rapid cell death in both hypoxic cultures and in murine lung. These phenotypic data, in conjunction with significant structural differences between human and mycobacterial MDH enzymes that could be exploited for drug development, suggest a new strategy for eradicating quiescent bacteria.

Keywords: antibiotic; metabolism; mycobacterium; tuberculosis.


Conflict of interest statement

Declaration of interests

The authors declare no competing interests.

Figures

Figure 1.
Figure 1.. Genetic Screen to Identify Mutants with Altered Fitness in Hypoxia
(A) Scheme for identifying genes essential for adapting to and surviving in hypoxia. Saturated transposon libraries were grown in hypoxic vials for three and six weeks, at which point DNA was obtained from the surviving mutants. The compositions of the resulting mutant pools were compared with the input pool by TNseq. The behavior of hypothetical Mtb mutants are depicted. These can reflect neutral mutations (black), fitness advantages (blue), defects during the adaptation to hypoxa (red and green), and defects in survival in hypoxia (yellow). (B) Relative fitness of each individual mutant in the Mtb library at weeks 3 versus 6 of hypoxia. Dots are sized by statistical significance (Q-value indicates adjusted p-value as determined by resampling). Dotted lines indicate arbitrary log fold change cutoffs (1.5 fold), which in conjunction with a Q < 0.05 significance threshold yielded 32 mutants with a hypoxic survival defect. Only genes disrupted by >4 distinct TA insertions in the library were included in this analysis. (C) Using the criteria described in panel B, the indicated numbers of mutants with conditional fitness were identified. Coloring of mutant classes is consistent with panel A. “IvH3”: Input versus hypoxia week 3, IvH6: Input versus hypoxia week 6, H3vH6: hypoxia week 3 versus hypoxia week 3. D-F) Relative fitness of mutants lacking genes of the previously described DosR regulon (D), the mce1 operon (E), or predicted adenylate cyclases and ∆mt-pat (rv0998) (F). Only mutants represented in the input transposon library are shown. In F, mutant pools from 3 and 6 weeks of hypoxia are compared. Throughout, asterisks indicate statistical significance (Q <0.05 by resampling).
Figure 2.
Figure 2.. MtPat is necessary for redox homeostasis during hypoxia
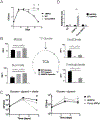
(A) Survival of ∆MtPat, wild type (WT), and the complemented mutant (Comp MtPat) in hypoxia. Asterisks indicate statistical significance (black:∆MtPat versus WT, gray: ∆MtPat versus complemented strain), determined by t-test using the Bonferroni correction (* p<0.05). Data depict one representative experiment of three. B) Metabolic flux through TCA reactions was estimated by quantifying the conversion of exogenously added 2-[13C]-glucose into each intermediate using (LC-MS). Metabolic flux was determined in under aerobic and hypoxic conditions using either WT or ∆MtPat mutant bacteria (bars are colored as indicated in figure) as described in the Methods section. Hypothetical bifurcated TCA cycle is depicted, as described in the text. Data represent the average of three independent experiments. * p<0.05, ** p<.005 by t-test using the Holm-Bonferroni correction. “ND” indicated no detectable conversion. C) Viability of ∆MtPat, WT, and the complemented mutant in 7H9 media containing oleate is shown in the left panel. The right panel depicts a parallel viability study in media lacking oleate. One representative experiment of two is depicted. * p<0.05, ** p<.005 by t-test using the Bonferroni correction. D) Ratio of NADH/NAD+ in WT, ∆MtPat and the complemented mutant strain under aerobic culture or after 7 days of hypoxic culture. Figure depicts one representative experiment of three performed. * p = 0.02 by t-test.
Figure 3.
Figure 3.. Depletion of the Mdh enzyme Reduces Hypoxic Survival
A) The abundance of the Mdh-DAS protein during inducible depletion was assessed by targeted label-free mass spectrometry. ATc was added to a culture of the mdh-DAS strain after 10 days of hypoxia. At the indicated time points, three independent peptides of Mdh were quantified in cell lysates by LC/MS/MS. Mdh abundance in each sample was normalized to the concentration of SigA protein. B) The mdh-DAS strain was cultured under aerobic conditions either with or without ATc, and growth was monitored by optical density (A600). C) The mdh-DAS strain was cultured under aerobic conditions until saturation (day 10), at which point ATc was added. CFU were enumerated at the indicated time points by plating. D) The mdh-DAS strain was cultured under hypoxic conditions and ATc was added to non-replicating cultures at day 10. CFU were enumerated at the indicated time points by plating. E) The relative flux of 2-[13C]-glucose into citrate was determined in WT and Mdh-DAS strains under hypoxic conditions. ATc exposure was initiated at 10 days, simultaneously with the addition of 2-[13C]-glucose. Flux into citrate was determined after 10 days of labeling. F) Mdh depletion in mouse lung. After aerosol infection with pooled wild type and mdh-DAS strains, Mdh depletion was initiated via doxycycline (“dox”) in two different regimens. The “acute regimen” began one week after infection and continued for two weeks. The “chronic regimen” began 6 weeks postinfection and continued for 8 weeks. Mutant fitness was measured by detection of unique strain-specific DNA barcode via qPCR. Throughout, asterisks indicate p<0.05 by t-test using bonferroni’s correction.
Figure 4.
Figure 4.. Chemical inhibition of Mdh kills hypoxic Mycobacterium tuberculosis.
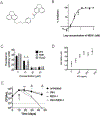
A) Structure of MDH-I. B) Inhibition of Mdh biochemical activity by MDH-I. Each point represents and average of triplicate measurements. The axes cross at zero. C) WT, mdh-DAS, or control sucD-DAS strains were exposed to the indicated doses of MDH-I in the presence of ATc to initiate protein depletion. Mtb growth was quantified using the Alamar Blue fluorescence assay. D) An mdh inducible overexpression strain was exposed to the indicated doses of MDH-I in the presence of the indicated concentration of inducer (Atc). The MIC of MDH-I at each ATc concentration was determined as in panel C. The slope of this dose-response was significantly different from zero (p = 0.013, determined by linear regression). E) MDH-I (40uM) and/or INH (2uM) were added to hypoxic cultures at day 10 (arrow), and CFU were enumerated. Limit of detection in panel D is indicated by the dotted line (100 CFU/ml). Throughout, asterisks indicate p<0.05 by t-test using bonferroni’s correction. In panel E gray: untreated versus MDH-I+INH, black: untreated versus MDH-I.
Figure 5.
Figure 5.. Structural comparison of human and mycobacterial MDH enzymes
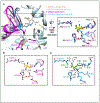
A) Comparison of substrate binding loop conformation in MDH structures. Human mitochondrial MDH (PDB ID: 2DFD) is shown in blue ribbon, and MtMdh is shown in shades of pink. MtMdh open form from the apo structure (PDB ID: 4TVO) is in magenta, intermediate and closed forms are from the NADH bound structure (PDB ID: 5KVV) in light pink and salmon, respectively. For the side-chains shown as sticks, carbons are colored according to the corresponding structural model. Additional moieties are colored as follows: sidechain oxygens are red, sidechain nitrogens are dark blue, malate from the human MDH structure is green, and Tris from the MtMDH structure is yellow. B and C) sidechain interactions with Tris and malate, respectively.
Figure 6.
Figure 6.. Summary of Mt-PAT dependent metabolic regulation.
Three acetyl-CoA producing pathways are depicted. The production of acetyl-CoA from fatty acid or acetate depends on the acyl-CoA ligase family that is inhibited by PAT orthologs. Mt-PAT activity is regulated by at least three metabolites. cAMP and acetyl-CoA directly promote Mt-PAT activity, producing the regulatory effects indicated by red dotted arrows. Conversely, NAD+ is a required cofactor for deacetylation mediated by the sirtuin-like Rv1151c protein (Sirt), producing events indicated in blue. The overall effect of Mt-Pat in hypoxia is to shift carbon flux into reductive TCA reactions. This effect likely depends on inhibition of acetyl-CoA production and possibly on direct regulation of TCA activity (indicated by a question mark). The effects of acetyl-CoA and NAD+ imply feedback regulation, as high acetyl-CoA levels favor Mt-PAT mediated inhibition of oxidative reactions (blue), whereas high NAD+ levels antagonize Mt-PAT favoring reductive reactions (red). The role of MDH in both oxidative and reductive TCA reactions and the potential role for cAMP in modulating these events are indicated.

References

    1. Adams PD, Afonine PV, Bunkóczi G, Chen VB, Davis IW, Echols N, Headd JJ, Hung L-W, Kapral GJ, Grosse-Kunstleve RW, et al. (2010). PHENIX: a comprehensive Python-based system for macromolecular structure solution. Acta Crystallogr. D Biol. Crystallogr 66, 213–221. - PMC - PubMed
    1. Ananthan S, Faaleolea ER, Goldman RC, Hobrath JV, Kwong CD, Laughon BE, Maddry JA, Mehta A, Rasmussen L, Reynolds RC, et al. (2009). High-throughput screening for inhibitors of Mycobacterium tuberculosis H37Rv. Tuberculosis (Edinb) 89, 334–353. - PMC - PubMed
    1. Baek S-H, Li AH, and Sassetti CM (2011). Metabolic regulation of mycobacteria growth and antibiotic sensitivity. PLoS Biol 9, e1001065. - PMC - PubMed
    1. Blumenthal A, Trujillo C, Ehrt S, and Schnappinger D (2010). Simultaneous analysis of multiple Mycobacterium tuberculosis knockdown mutants in vitro and in vivo. PLoS ONE 5, e15667. - PMC - PubMed
    1. Castaño-Cerezo S, Bernal V, Blanco-Catalá J, Iborra JL, and Cánovas M (2011).cAMP-CRP co-ordinates the expression of the protein acetylation pathway with central metabolism in Escherichia coli. Mol. Microbiol 82, 1110–1128. - PubMed

Publication types

MeSH terms

LinkOut - more resources