. 2018 Sep 24:11:347.
doi: 10.3389/fnmol.2018.00347. eCollection 2018.

Modification of a Putative Third Sodium Site in the Glycine Transporter GlyT2 Influences the Chloride Dependence of Substrate Transport

Affiliations

Modification of a Putative Third Sodium Site in the Glycine Transporter GlyT2 Influences the Chloride Dependence of Substrate Transport

Cristina Benito-Muñoz et al. Front Mol Neurosci. .

Abstract

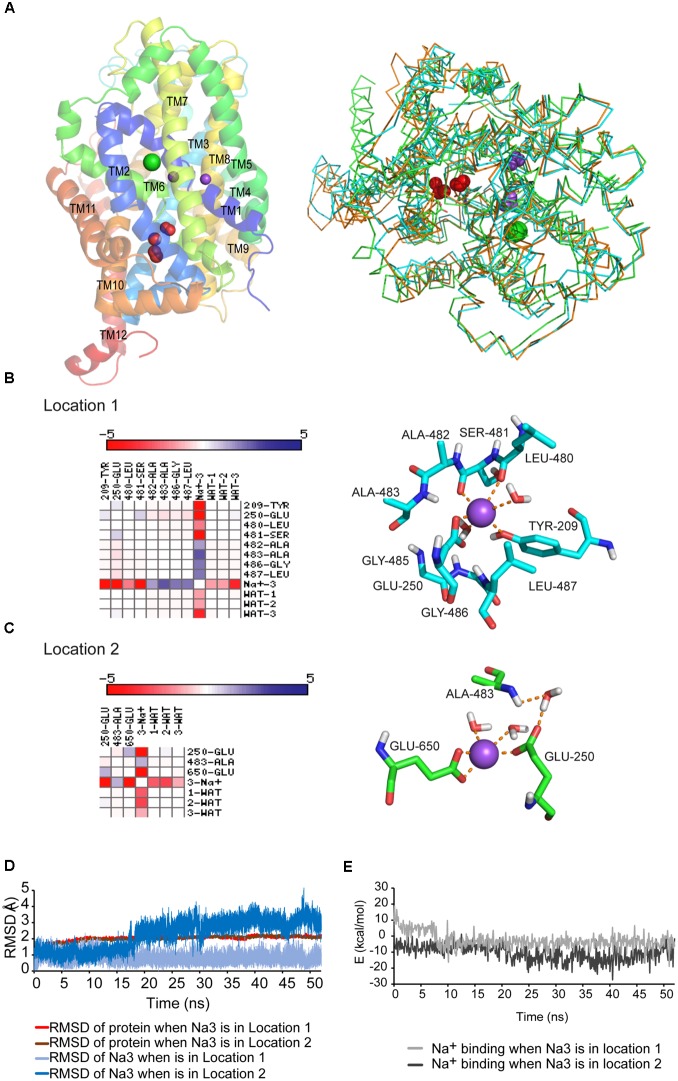
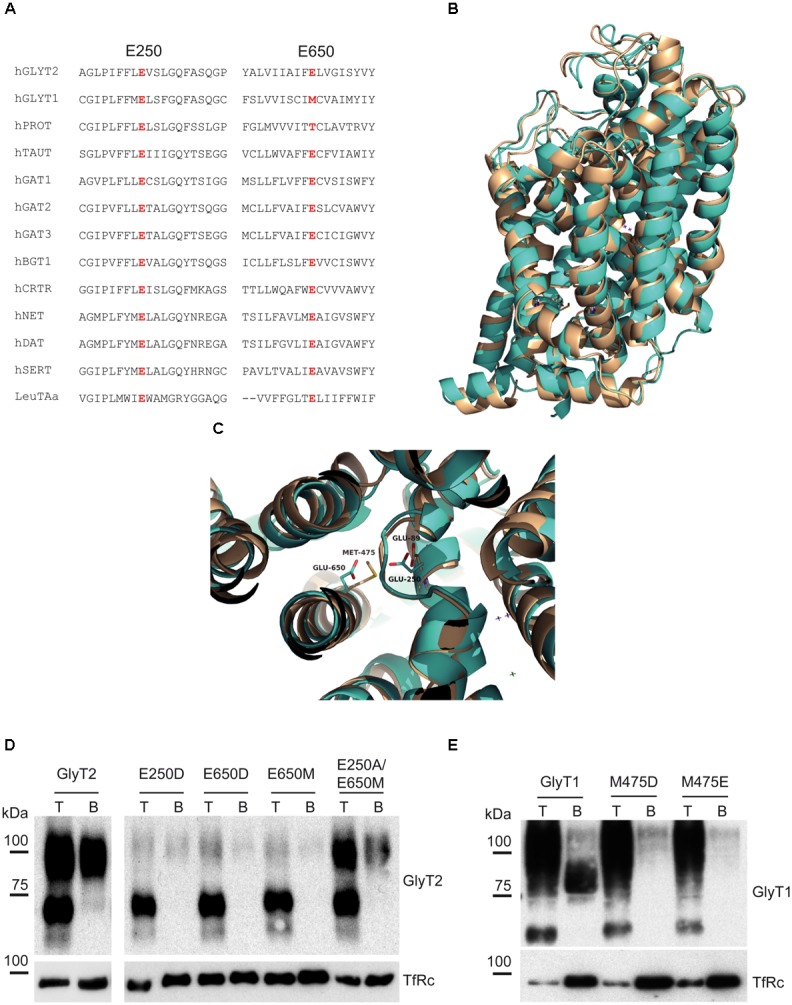
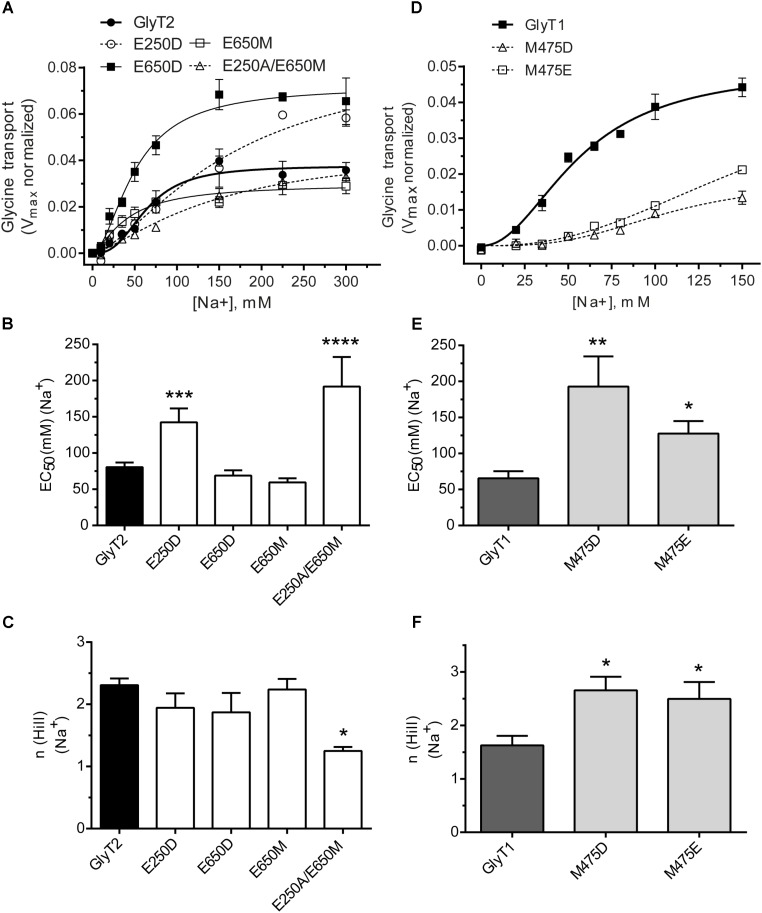
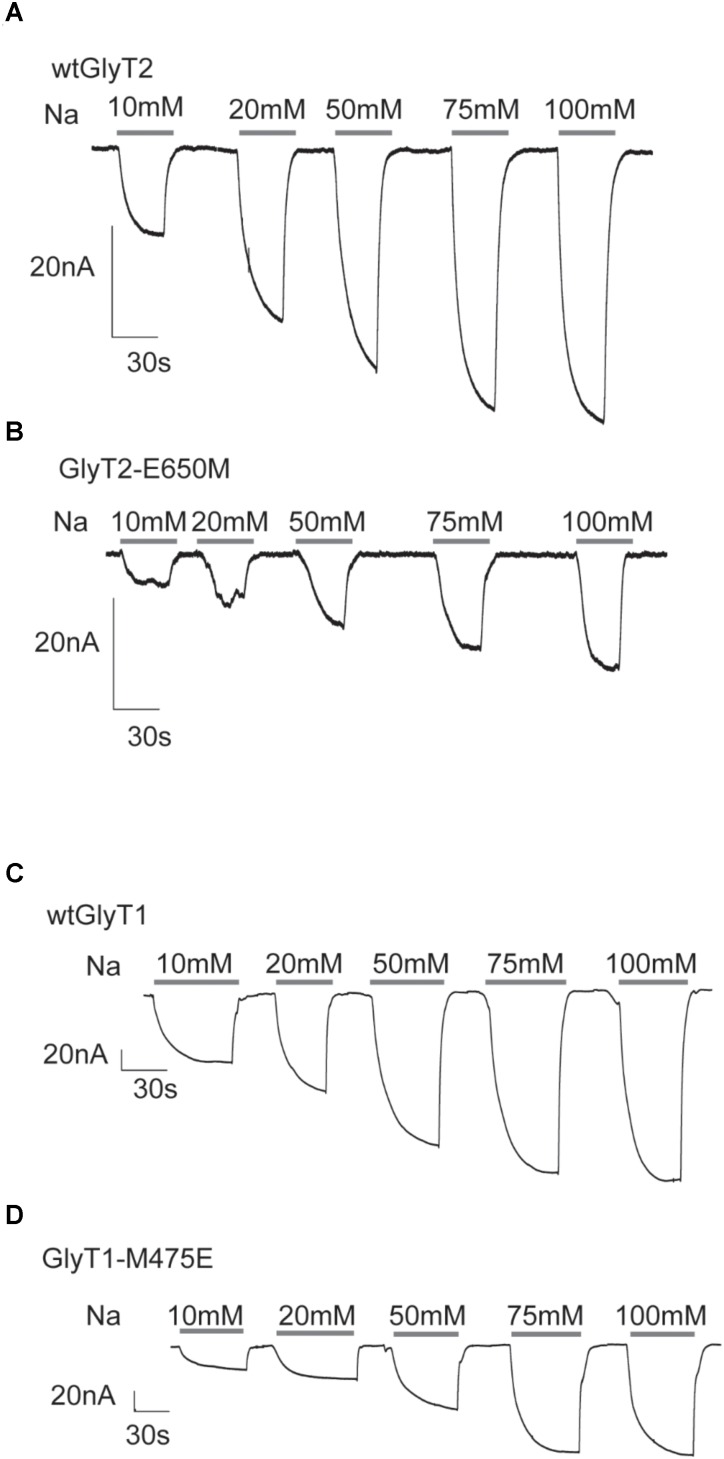
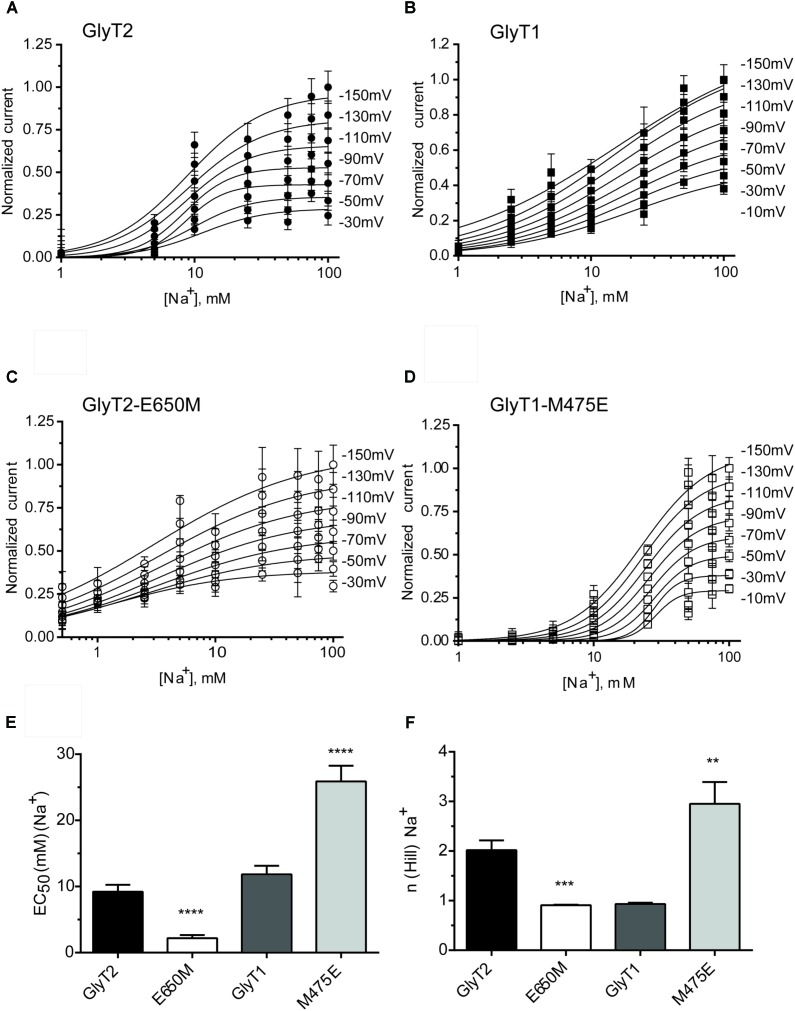
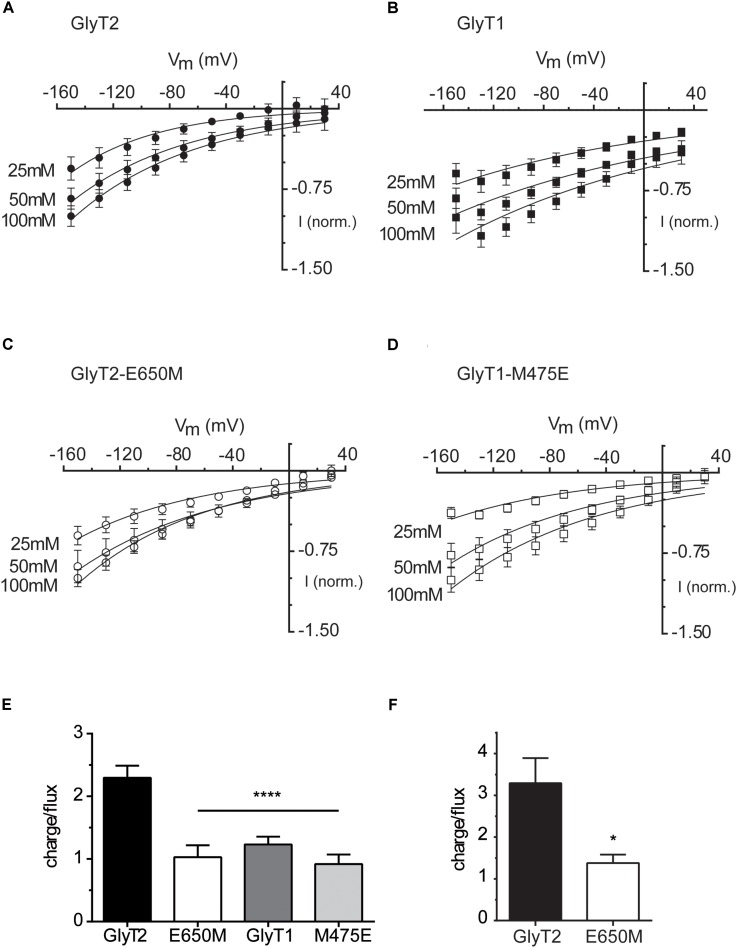
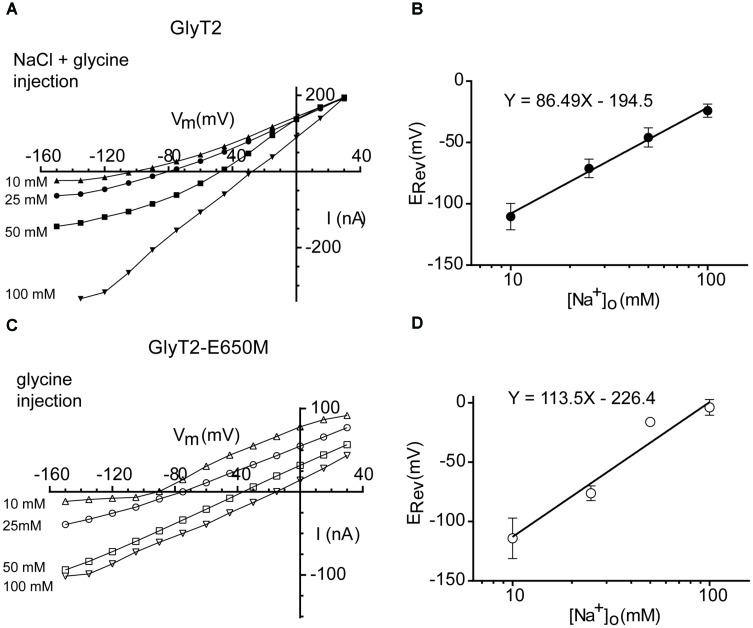
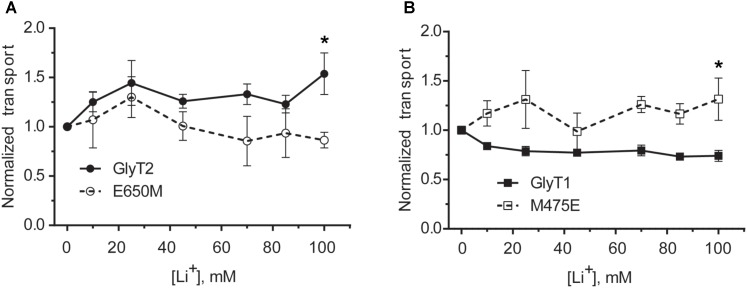
Neurotransmitter removal from glycine-mediated synapses relies on two sodium-driven high-affinity plasma membrane GlyTs that control neurotransmitter availability. Mostly glial GlyT1 is the main regulator of glycine synaptic levels, whereas neuronal GlyT2 promotes the recycling of synaptic glycine and supplies neurotransmitter for presynaptic vesicle refilling. The GlyTs differ in sodium:glycine symport stoichiometry, showing GlyT1 a 2:1 and GlyT2 a 3:1 sodium:glycine coupling. Sodium binds to the GlyTs at two conserved Na+ sites: Na1 and Na2. The location of GlyT2 Na3 site remains unknown, although Glu650 has been involved in the coordination. Here, we have used comparative MD simulations of a GlyT2 model constructed by homology to the crystalized DAT from Drosophila melanogaster by placing the Na3 ion at two different locations. By combination of in silico and experimental data obtained by biochemical and electrophysiological analysis of GlyTs mutants, we provide evidences suggesting the GlyT2 third sodium ion is held by Glu-250 and Glu-650, within a region with robust allosteric properties involved in cation-specific sensitivity. Substitution of Glu650 in GlyT2 by the corresponding methionine in GlyT1 reduced the charge-to-flux ratio to the level of GlyT1 without producing transport uncoupling. Chloride dependence of glycine transport was almost abolished in this GlyT2 mutant but simultaneous substitution of Glu250 and Glu650 by neutral amino acids rescued chloride sensitivity, suggesting that protonation/deprotonation of Glu250 substitutes chloride function. The differential behavior of equivalent GlyT1 mutations sustains a GlyT2-specific allosteric coupling between the putative Na3 site and the chloride site.

Keywords: GlyT; SLC6; hyperekplexia; neurotransmitter reuptake; sodium site.


Figures

FIGURE 1
FIGURE 1
(A) GlyT2 dDAT homology model. Left: PyMol-generated GlyT2 lateral view is shown in a cartoon representation with conserved Na1 and Na2 as purpled spheres and chloride ion as green sphere. The water molecules found in several NSS crystals (red spheres) are surrounding the unwound portion of TM6. Right: structure alignment in PyMol of GlyT2 model, LeuTAa and dDAT crystals. 90% of the LeuTAa and dDAT crystals in PDB show 2 crystallographic water molecules in locations 1 and/or 2. The three structures are shown as ribbon, GlyT2 model is colored in orange, LeuTAa in green, and dDAT in cyan. The waters are depicted as red spheres and residues Glu250 and Glu650, which bind waters, are shown in stick representation. (B) Interaction matrix and lateral view of Na3 placed in location 1. (C) Interaction matrix and lateral view of Na3 placed in location 2. Cations are shown as purple spheres. Residues are shown in stick representation. (D,E) Root-mean-square-deviations (RMSD) (D) and energy profile (E) along the 50 ns MD simulations with sodium placed in location 1 or 2.
FIGURE 2
FIGURE 2
GlyT1 and GlyT2 alignment and mutant expression. (A) Alignment of the amino acid sequences of TM2 and TM10 of rat NSS transporters using the ClustalW program. (B,C) Structural alignment of modeled GlyT1 and GlyT2 showing GlyT2 Glu250 and Glu650 and GlyT1 Glu89 and Met475 in stick representation. (D,E) Surface expression of GlyT2 (D) and GlyT1 (E) mutants assessed by surface biotinylation. T, total transporter; B, biotinylated transporter; TfRc, transferrin receptor as loading control.
FIGURE 3
FIGURE 3
Sodium dependence of glycine transport by GlyT2 and GlyT1 substitution mutants. COS7 cells expressing the indicated transporters were assayed for glycine transport in the presence of increasing extracellular NaCl concentrations (isotonic substitution by choline chloride). Control glycine transport by wild type GlyT2 and GlyT1 were 2.0 ± 0.06 and 5.49 ± 0.26 nmol glycine/mg protein/10 min, respectively. (A,D) Representative experiments are shown that were repeated at least three times performed in triplicate. Glycine transport has been Vmax normalized. Experimental data were fitted to the Hill equation. (B–F) EC50 for sodium and Hill coefficient were determined and analyzed by one-way ANOVA with Dunnett’s post hoc test, comparing with wild-type GlyT1 and GlyT2. p > 0.05; p < 0.05; ∗∗p < 0.01; ∗∗∗p < 0.001; ∗∗∗∗p < 0.0001. For mutants nonsaturated at 150 mM NaCl, determinations up to 300 mM NaCl were performed.
FIGURE 4
FIGURE 4
Glycine-associated currents of GlyT2 and GlyT1 substitution mutants at different external sodium concentrations. (A–D) Inward currents recorded at a holding potential of –60 mV elicited by application of 1 mM glycine at the indicated sodium concentrations (extracellular NaCl concentrations isotonically substituted by choline chloride) in four representative oocytes expressing the indicated transporters.
FIGURE 5
FIGURE 5
Sodium dependence of glycine-evoked steady-state currents in the oocytes expressing GlyT2 and GlyT1 wild-type and mutants. (A–D) At least six oocytes expressing the indicated transporters were voltage-clamped at the specified clamping potentials over the range of –150 and –10 mV and glycine-induced currents at increasing external sodium concentrations (choline substitution) were measured to estimate the EC50 (E) and Hill coefficient (F). At each potential glycine-induced currents were averaged and normalized to those at –150 mV. Data were analyzed by paired t-test, comparing with wild-type GlyT1 or wild-type GlyT2. ∗∗p < 0.01; ∗∗∗p < 0.001; ∗∗∗∗p < 0.0001.
FIGURE 6
FIGURE 6
Glycine-induced steady-state currents and charge-to-flux ratios by wild-type GlyTs and mutant transporters. (A–D) Glycine-induced currents: the membrane voltage of oocytes expressing the indicated transporters was stepped from a holding potential of –60 mV to voltages between –150 to 30 mV in –20 mV increments. Currents in 100 mM NaCl recording solution were subtracted from those in the same medium supplemented with 1 mM Gly. At each potential glycine-induced currents were averaged and normalized to those at –150 mV. These currents were then plotted against the corresponding potential (millivolt). The data are the mean ± SEM (error bars) of at least four different oocytes. Wherever error bars are not visible, the error was smaller than the size of the symbols. The mean currents at –150 mV induced by 1 mM glycine were –67.6 ± 6.7 nA in GlyT2, –34.8 ± 2.7 nA in GlyT2-E650M, –132.1 ± 19.2 nA in GlyT1, and –77.6 ± 23.9 in GlyT1-M475E. The rectification degree has been estimated as the ratio of the slopes of the linear regression fit of the three current values at the most negative and most positive potentials in the I/V curves. The calculated rectification degree at 100 mM NaCl are 4 (GlyT2), 1.75 (GlyT2-E650M), 1.3 (GlyT1), and 1 (GlyT1-M475E). (E,F) charge-to-flux ratios: oocytes expressing the indicated transporters were voltage-clamped at –60 mV (E) or –100 mV (F) in 100 mM NaCl recording solution and the current induced by 30 μM radioactive glycine (0.4 Ci/mmol) was measured for 1 min. The charge moved during this time was obtained by integrating the current over time (Clampfit v. 10.3). The ratio was determined by calculating the moles of charge and dividing by the moles of radiolabeled substrate taken up as determined from scintillation counting after correction by the values for non-injected oocytes. The data are given in mean ± SEM (error bars) of at least four different oocytes. ∗∗∗∗p < 0.0001 one-way ANOVA with Bonferroni’s multiple comparison test, p < 0.05 Mann–Whitney test.
FIGURE 7
FIGURE 7
Reversal potential of wild-type and GlyT2-E650M mutant-mediated currents as a function of the external Na+ concentration. (A,B) GlyT2 oocytes injected with 18 nM of glycine and NaCl: current-voltage relationships (A) and ERev plotted as a function of the log [Na+]o (B). (C,D) GlyT2-E650M oocytes injected with 18 nM of glycine: current-voltage relationships (C) and ERev plotted as a function of the log [Na+]o (D). Linear regression equation is presented in the graphs.
FIGURE 8
FIGURE 8
Lithium dependence of glycine transport of wild-type GlyTs and mutant transporters. (A,B) COS7 cells expressing wild-type GlyT2 or GlyT2-E650M (A) or wild-type GlyT1 or GlyT1-M475E (B) were assayed for 3[H]-glycine transport in HBS containing 30 mM NaCl concentration in every point and the indicated increased LiCl concentration up to 150 mM that was reached by isotonic supplementation with choline chloride. p < 0.05 Mann–Whitney test.
FIGURE 9
FIGURE 9
Chloride dependence of glycine-induced steady-state currents and glycine transport by wild-type GlyTs and mutant transporters. (A,B) Glycine-induced currents: the membrane voltage of oocytes expressing the indicated transporters was stepped from a holding potential of –60 mV to voltages between –150 to 30 mV in –20 mV increments. Currents in 100 mM NaCl recording solution (A) or in chloride-free solution (described in material and methods) (B) were subtracted from those in the same medium supplemented with 1 mM Gly. At each potential glycine-induced currents were averaged and normalized to those at –150 mV. (C,D) COS7 cells expressing the indicated transporters were assayed for glycine transport in the presence of increasing extracellular NaCl concentrations (isotonic substitution by sodium gluconate). Control glycine transport by wild-type GlyT2 and GlyT1 was 3.3 ± 0.3 and 2.6 ± 0.3 nmol glycine/mg protein/10 min, respectively. Representative experiments are shown repeated at least in three separated experiments performed in quadruplicate. Experimental data were fitted to the Michaelis–Menten equation.

References

    1. Altschul S. F., Gish W., Miller W., Myers E. W., Lipman D. J. (1990). Basic local alignment search tool. J. Mol. Biol. 215 403–410. 10.1016/S0022-2836(05)80360-2 - DOI - PubMed
    1. Aragon C., Lopez-Corcuera B. (2003). Structure, function and regulation of glycine neurotransporters. Eur. J. Pharmacol. 479 249–262. 10.1016/j.ejphar.2003.08.074 - DOI - PubMed
    1. Arribas-Gonzalez E., Alonso-Torres P., Aragon C., Lopez-Corcuera B. (2013). Calnexin-assisted biogenesis of the neuronal glycine transporter 2 (GlyT2). PLoS One 8:e63230. 10.1371/journal.pone.0063230 - DOI - PMC - PubMed
    1. Arribas-Gonzalez E., de Juan-Sanz J., Aragon C., Lopez-Corcuera B. (2015). Molecular basis of the dominant negative effect of a glycine transporter 2 mutation associated with hyperekplexia. J. Biol. Chem. 290 2150–2165. 10.1074/jbc.M114.587055 - DOI - PMC - PubMed
    1. Arribas-González E., de Juan-Sanz J., Aragón C., López-Corcuera B. (2015). Molecular basis of the dominant negative effect of a glycine transporter 2 mutation associated with hyperekplexia. J. Biol. Chem. 290 2150–2165. 10.1074/jbc.M114.587055 - DOI - PMC - PubMed