. 2018 Sep 26:9:2227.
doi: 10.3389/fimmu.2018.02227. eCollection 2018.

Acute Myeloid Leukemia Cells Express ICOS Ligand to Promote the Expansion of Regulatory T Cells

Affiliations

Acute Myeloid Leukemia Cells Express ICOS Ligand to Promote the Expansion of Regulatory T Cells

Yixiang Han et al. Front Immunol. .

Abstract

CD4+CD25+Foxp3+ regulatory T cells (Tregs) accumulate in bone marrow microenvironment in acute myeloid leukemia (AML). However, little is known about how the tumor environment including tumor cells themselves affects this process. Here we demonstrated that AML cells expressed inducible T-cell costimulator ligand (ICOSL) that can provide costimulation through ICOS for the conversion and expansion of Tregs sustaining high Foxp3 and CD25 expression as well as a suppressive function. TNF-a stimulation up-regulated the expression of ICOSL. Furthermore, both the conversion and expansion of CD4+CD25+Foxp3+ T cells and CD4+ICOS+Foxp3+ T cells were induced by co-culture with AML cells overexpressed ICOSL. CD4+CD25+ICOS+ T cells possessed stronger ability to secrete IL-10 than CD4+CD25+ICOS- T cells. The mechanism by which IL-10 promoted the proliferation of AML cells was dependent on the activation of the Akt, Erk1/2, p38, and Stat3 signaling pathways. Blockade of ICOS signaling using anti-ICOSL antibody impaired the generation of Tregs and retarded the progression of an AML mice model injected with C1498 cells. The expression of ICOSL of patient AML cells and ICOS+ Tregs were found to be predictors for overall survival and disease-free survival in patients with AML, with ICOS+ Treg cell subset being a stronger predictor than total Tregs. These results suggest that ICOSL expression by AML cells may directly drive Treg expansion as a mechanism of immune evasion and ICOS+ Treg cell frequency is a better prognostic predictor in patients with AML.

Keywords: acute myeloid leukemia; inducible T-cell costimulator; inducible T-cell costimulator ligand; interleukin-10; regulatory T cells.


Figures
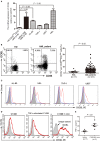
Figure 1
Figure 1
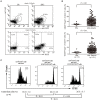
The expression of ICOSL in acute myeloid leukemia. (A) The mRNA expression of ICOSL in CD45dimCD33+ cells isolated from healthy donors, patient AML cells, and four AML cell lines HL-60, THP-1, U937, and HEL were determined and expressed as mean ± SEM representing at least three independent experiments. ANOVA was used to determine the differences between the groups. (B) Representative plots (left panel) and statistical data (right panel) showed that the expression of ICOSL in SSCdimCD45dimcells isolated from bone marrow of 11 healthy donors and 121 patients with AML. Unpaired t-test was used to determine the difference. (C) Treatment with TNF-a 50 ng/ml for 48 h induced the expression of ICOSL in HL-60, HEL, THP-1, and U937 cells. Overlay histograms showing antibody stains with (solid red) or without (solid blue) TNF-a stimulation and isotype stains (filled gray) are representatives of three independent experiments. (D) Treatment with murine TNF-α 50 ng/ml for 48 h induced the expression of ICOSL in C1498 cells. The expression of ICOSL was increased on day 5 when C1498-EGFP cells were injected in vivo. Overlay histograms showing antibody stains (solid red) and isotype stains (filled gray) are representatives of three independent experiments. (E) The plasma levels of TNF-α were determined by ELISA on day 5 in C57BL/6 mice intravenously injected with or without C1498 cells (5 × 10⁶/mouse). Unpaired t-test was used to determine the difference.
Figure 2
Figure 2
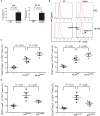
The frequencies and function of ICOS+ Tregs in patients with AML. (A,B) Representative plots (left panel) and statistical data (right panel) showed that the frequencies of CD4+CD25+FoxP3+ cells and CD4+FoxP3+ICOS+ cells in 11 healthy donors and 121 patients with AML. Unpaired t-test was used to determine the difference. (C) The CD4+CD25highICOS+ cells and CD4+CD25highICOS cells were sorted from bone marrow mononuclear cells of patients with AML using flow cytometry, and then incubated for 5 days with PBMCs treated with 20 μg/ml mitomycin and CFSE-labeled CD4+CD25 T cells, with stimulation with plate-coated anti-CD3 (1 μg/ml) and soluble anti-CD28 (3 μg/ml) and IL-2 (20 ng/ml). The cell division was measured by levels of CFSE dilution by flow cytometry. Histograms were representatives of four independent experiments and ANOVA was used to determine the differences.
Figure 3
Figure 3
The effect of ICOSL in AML cells on Treg induction. (A,B) AML cell lines HL-60 and HEL were transduced to constitutively express full-length human ICOSL. Meanwhile, these two cell lines were transduced with the empty vector. The mRNA expression of ICOSL was determined and unpaired t-test was used to determine the difference. Overlay histograms showing cell surface protein expression of ICOSL with antibody stains (solid red) and isotype stains (filled gray) were representatives of three independent experiments. (C) CD4+ CD25+Foxp3+ cells and CD4+ICOS+Foxp3+ cells were significantly increased when CD4+ T cells co-cultured with HL-60 cells overexpressed ICOSL for 5 days. (D) Anti-ICOSL antibody reduced the expansion of CD4+CD25+Foxp3+ cells and CD4+ICOS+Foxp3+ cells in CD4+ T cells co-cultured with HEL cells for 5 days. Data were expressed as mean ± SEM representing four independent experiments and AVONA was used to determine the differences.
Figure 4
Figure 4
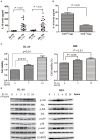
IL-10 promotes the proliferation of AML cells. (A) IL-10 levels were increased in plasma and bone marrow plasma in 20 AML patients compared with 10 healthy donors. Unpaired t-test was used to determine the differences. (B) The CD4+CD25highICOS+ cells and CD4+CD25highICOS cells were sorted and cultured in 200 μl X-VIVO™ 15 supplemented with 20 ng/ml IL-2 for 2 days, and the supernatants were subsequently collected and the levels of IL-10 were determined using a commercial ELISA kits. Data were expressed as mean ± SEM representing four independent experiments and unpaired t-test was used to determine the difference. (C) Treatment with IL-10 for 24 h promoted the proliferation of HL-60 cells and HEL cells in a dose-dependent manner. Data were expressed as mean ± SEM representing five independent experiments and ANOVA was used to determine the differences. (D) IL-10 promoted the phosphorylation of Akt, Erk1/2, p38, and Stat3. Images shown were representatives of three independent experiments.
Figure 5
Figure 5
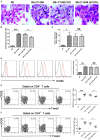
Blockade of ICOS signaling by anti-ICOSL mAb retards the progression of C1498-injected AML mice by impairing the generation of Tregs. (A,B) Representative images and statistical data about immature leucocyte cells were shown using Wright-stained bone marrow smears from 5 mice each group. The scale bars are10 μm, and arrows indicate immature leucocyte cells. ANOVA was used to determine the differences. (C) The mRNA expression of ICOSL of bone marrow mononuclear cells were determined using qRT-PCR in 5 mice each group. ANOVA was used to determine the differences. (D) Histograms showing the expression of ICOSL of bone marrow mononuclear cells were representatives of 5 mice each group. The black lines indicate isotype control, and the red lines indicate the expression of ICOSL. ANOVA was used to determine the differences. (E) The frequencies of CD4+CD25+Foxp3+ cells was significantly increased in the bone marrow microenvironment of C1498-injected mice and anti-ICOSL mAb dramatically reduced the generation of CD4+CD25+Foxp3+ cells in bone marrow. (F) Blockade of ICOS signaling by anti-ICOSL mAb reduced the generation of CD4+ICOS+Foxp3+ cells in bone marrow of C57B6/L mice elicited by injection of C1498 cells. Representative images and statistical data were shown for 5 mice each group. ANOVA was used to determine the differences. *P < 0.05, **P < 0.01, ***P < 0.001, NS stands for not significant.
Figure 6
Figure 6
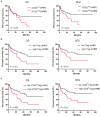
Increased expression of ICOSL in patient AML cells, increased frequencies of Tregs and ICOS+ Tregs predict poor survival in AML patients. Kaplan-Meier curves for overall survival and disease-free survival were assessed in ICOSL expression of patient AML cells (A), frequencies of Tregs (B) and ICOS+ Tregs (C), in bone marrow microenvironment of 121 patients with AML. The log-rank method was used to test for differences in survival.

References

    1. Maynadie M, Girodon F, Manivet-Janoray I, Mounier M, Mugneret F, Bailly F, et al. . Twenty-five years of epidemiological recording on myeloid malignancies: data from the specialized registry of hematologic malignancies of Cote d'Or (Burgundy, France). Haematologica (2011) 96:55–61. 10.3324/haematol.2010.026252 - DOI - PMC - PubMed
    1. Konopleva MY, Jordan CT. Leukemia stem cells and microenvironment: biology and therapeutic targeting. J Clin Oncol. (2011) 29:591–9. 10.1200/JCO.2010.31.0904 - DOI - PMC - PubMed
    1. Campbell DJ, Koch MA. Phenotypical and functional specialization of FOXP3+ regulatory T cells. Nat Rev Immunol. (2011) 11:119–30. 10.1038/nri2916 - DOI - PMC - PubMed
    1. Ooi JD, Petersen J, Tan YH, Huynh M, Willett ZJ, Ramarathinam SH, et al. . Dominant protection from HLA-linked autoimmunity by antigen-specific regulatory T cells. Nature (2017) 545:243–7. 10.1038/nature22329 - DOI - PMC - PubMed
    1. Cai S, Hou J, Fujino M, Zhang Q, Ichimaru N, Takahara S, et al. . iPSC-derived regulatory dendritic cells inhibit allograft rejection by generating alloantigen-specific regulatory T cells. Stem Cell Rep. (2017) 8:1174–89. 10.1016/j.stemcr.2017.03.020 - DOI - PMC - PubMed

Publication types

MeSH terms