

Renal Energy Metabolism Following Acute Dichloroacetate and 2,4-Dinitrophenol Administration: Assessing the Cumulative Action with Hyperpolarized [1-13C]Pyruvate MRI
- PMID: 30320210
- PMCID: PMC6173791
- DOI: 10.18383/j.tom.2018.00022
Renal Energy Metabolism Following Acute Dichloroacetate and 2,4-Dinitrophenol Administration: Assessing the Cumulative Action with Hyperpolarized [1-13C]Pyruvate MRI
Abstract
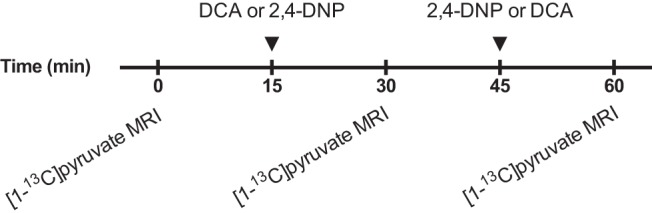
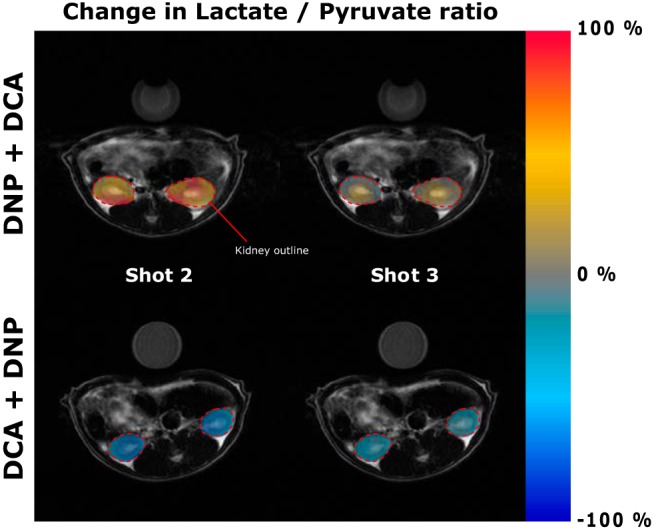
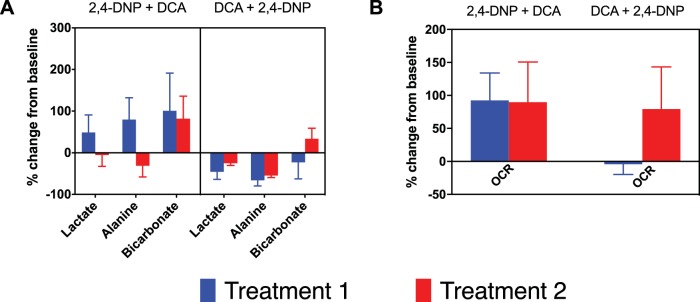
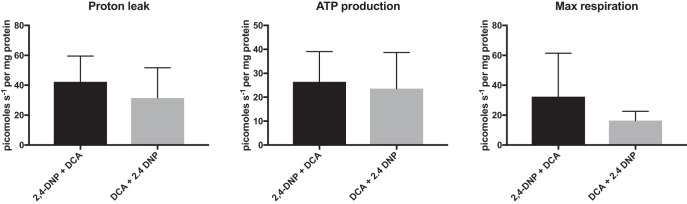
Numerous patient groups receive >1 medication and as such represent a potential point of improvement in today's healthcare setup, as the combined or cumulative effects are difficult to monitor in an individual patient. Here we show the ability to monitor the pharmacological effect of 2 classes of medications sequentially, namely, 2,4-dinitrophenol, a mitochondrial uncoupler, and dichloroacetate, a pyruvate dehydrogenase kinase inhibitor, both targeting the oxygen-dependent energy metabolism. We show that although the 2 drugs target 2 different metabolic pathways connected ultimately to oxygen metabolism, we could distinguish the 2 in vivo by using hyperpolarized [1-13C]pyruvate magnetic resonance imaging. A statistically significantly different pyruvate dehydrogenase flux was observed by reversing the treatment order of 2,4-dinitrophenol and dichloroacetate. The significance of this study is the demonstration of the ability to monitor the metabolic cumulative effects of 2 distinct therapeutics on an in vivo organ level using hyperpolarized magnetic resonance imaging.
Keywords: 2,4-DNP; DCA; MRI; hyperpolarization; metabolism.
Conflict of interest statement
Conflict of Interest: The authors have no conflict of interest to declare.
Figures
Similar articles
-
Enhancing Metabolic Imaging of Energy Metabolism in Traumatic Brain Injury Using Hyperpolarized [1-13C]Pyruvate and Dichloroacetate.Metabolites. 2021 May 24;11(6):335. doi: 10.3390/metabo11060335. Metabolites. 2021. PMID: 34073714 Free PMC article.
-
Multi-modality imaging to assess metabolic response to dichloroacetate treatment in tumor models.Oncotarget. 2016 Dec 6;7(49):81741-81749. doi: 10.18632/oncotarget.13176. Oncotarget. 2016. PMID: 28082726 Free PMC article.
-
Volumetric spiral chemical shift imaging of hyperpolarized [2-(13) c]pyruvate in a rat c6 glioma model.Magn Reson Med. 2016 Mar;75(3):973-84. doi: 10.1002/mrm.25766. Epub 2015 May 6. Magn Reson Med. 2016. PMID: 25946547 Free PMC article.
-
Studies of Metabolism Using (13)C MRS of Hyperpolarized Probes.Methods Enzymol. 2015;561:1-71. doi: 10.1016/bs.mie.2015.04.001. Epub 2015 Jun 19. Methods Enzymol. 2015. PMID: 26358901 Review.
-
Hyperpolarized (13)C Magnetic Resonance and Its Use in Metabolic Assessment of Cultured Cells and Perfused Organs.Methods Enzymol. 2015;561:73-106. doi: 10.1016/bs.mie.2015.04.006. Epub 2015 Jun 14. Methods Enzymol. 2015. PMID: 26358902 Free PMC article. Review.
References
-
- Aukland K, Krog J. Renal oxygen tension. Nature. 1960;188:671. - PubMed
-
- Brownlee M. Biochemistry and molecular cell biology of diabetic complications. Nature. 2001;414:813–820. - PubMed
-
- Fine LG, Orphanides C, Norman JT. Progressive renal disease: the chronic hypoxia hypothesis. Kidney Int Suppl. 1998;65:S74–S78. - PubMed
-
- Williamson JR, Chang K, Frangos M, Hasan KS, Ido Y, Kawamura T, Nyengaard JR, van den Enden M, Kilo C, Tilton RG. Hyperglycemic pseudohypoxia and diabetic complications. Diabetes. 1993;42:801–813. - PubMed
LinkOut - more resources
Full Text Sources
