. 2018 Oct 9;3(5):e00137-18.
doi: 10.1128/mSystems.00137-18. eCollection 2018 Sep-Oct.

Fecal Microbiota Transplantation Beneficially Regulates Intestinal Mucosal Autophagy and Alleviates Gut Barrier Injury

Affiliations

Fecal Microbiota Transplantation Beneficially Regulates Intestinal Mucosal Autophagy and Alleviates Gut Barrier Injury

Saisai Cheng et al. mSystems. .

Abstract

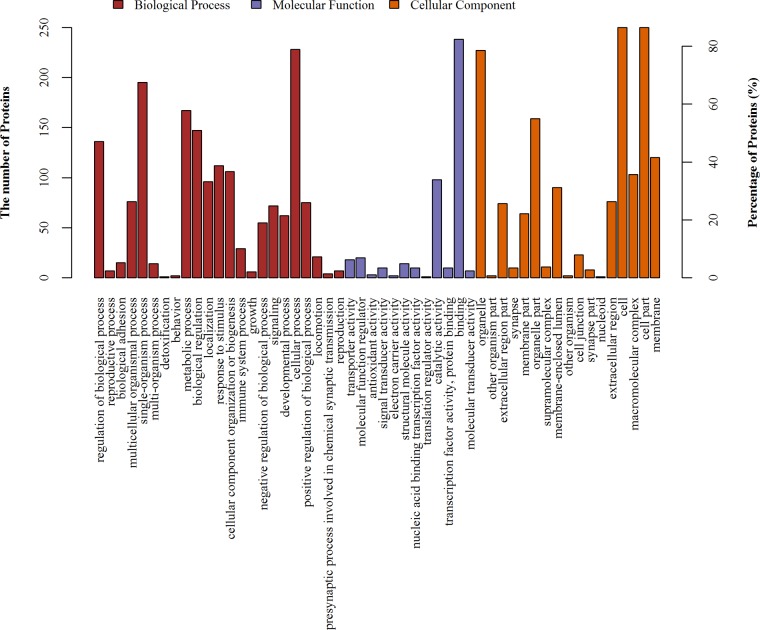
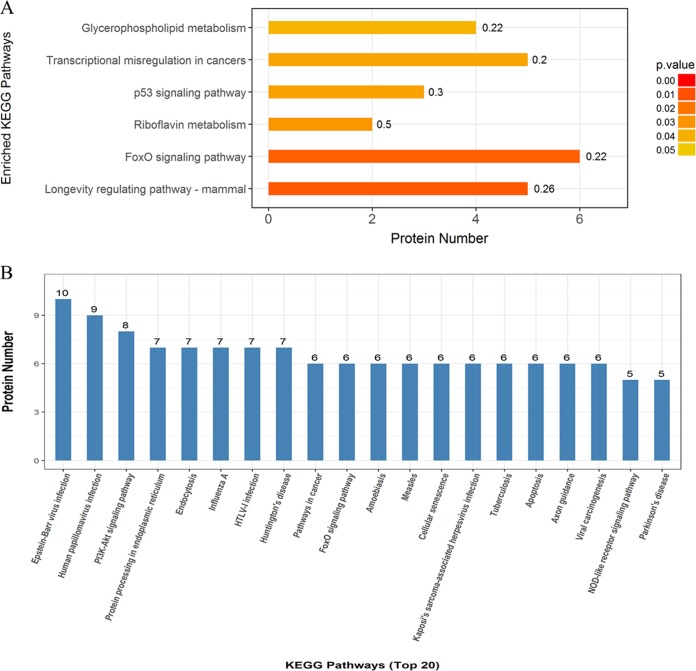
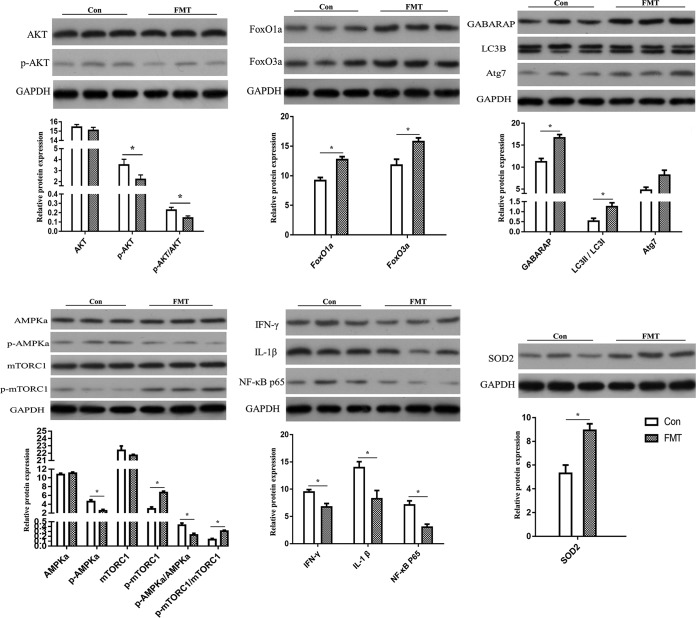
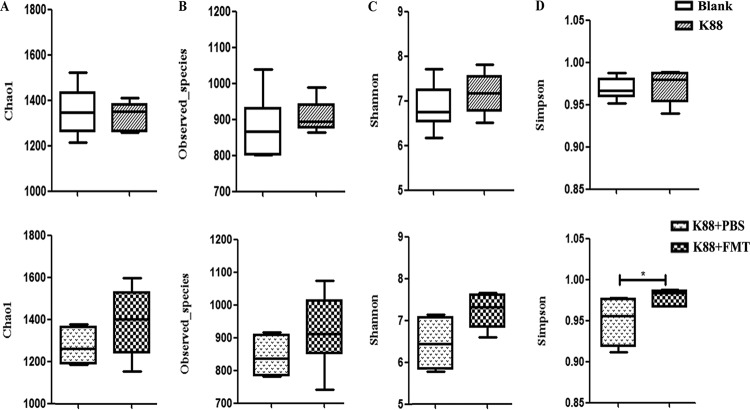
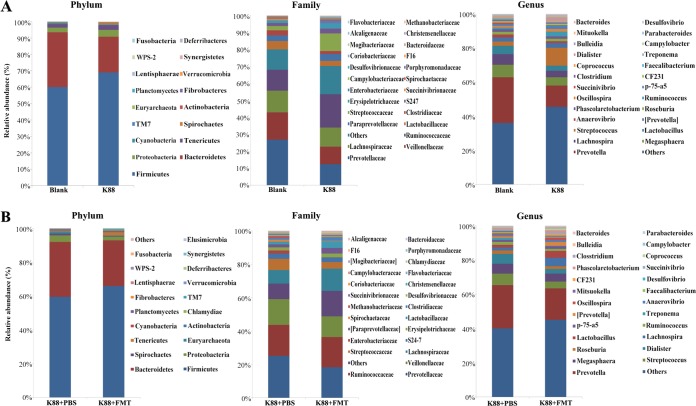
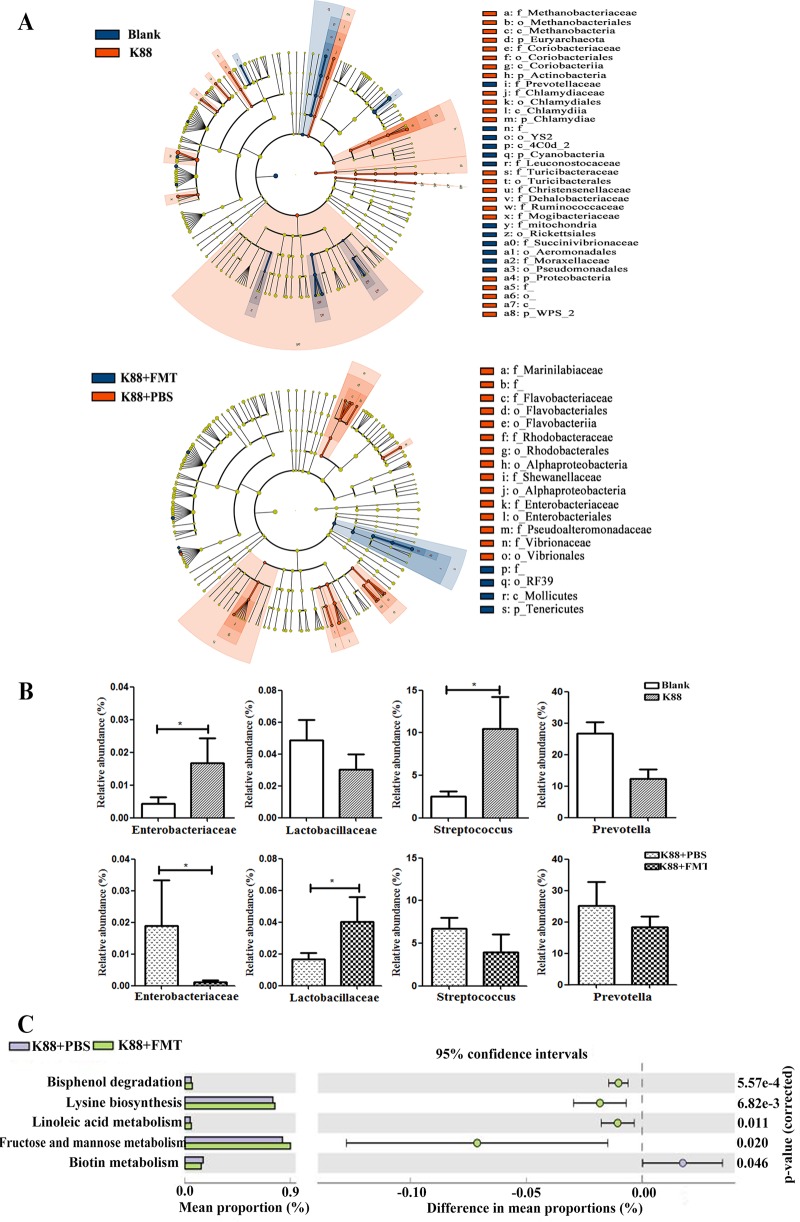
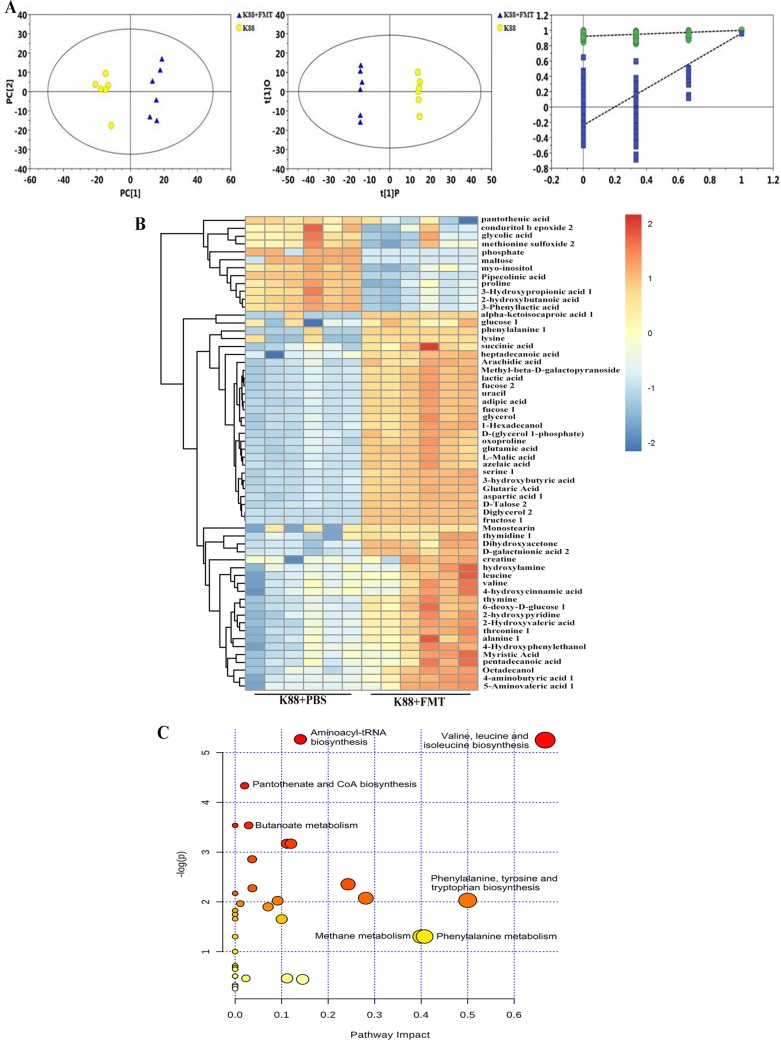
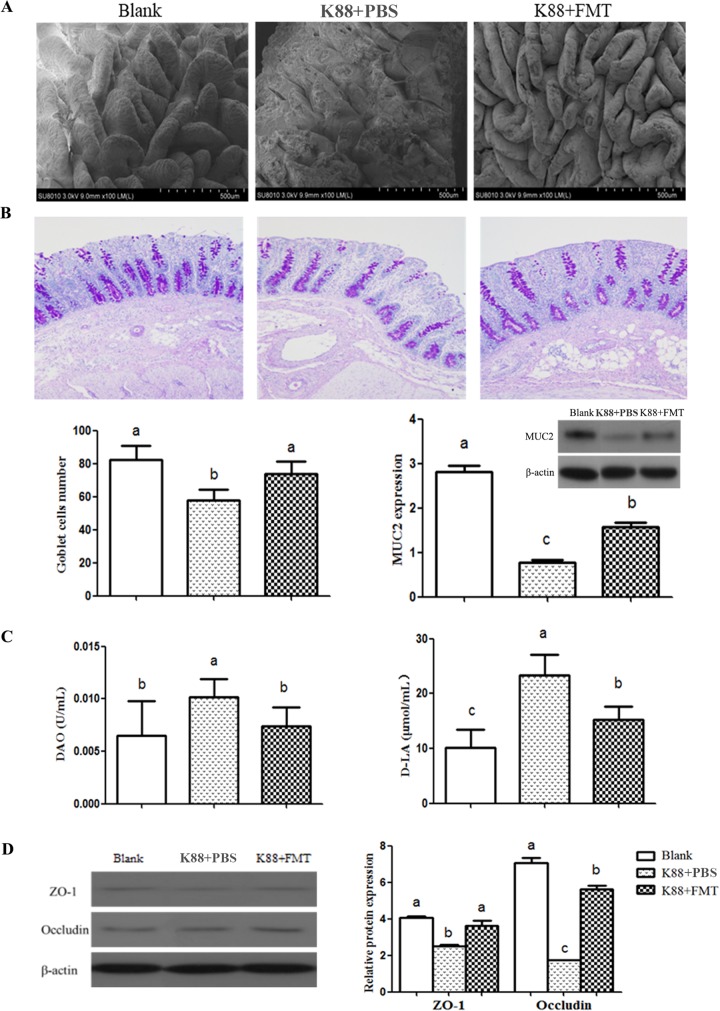
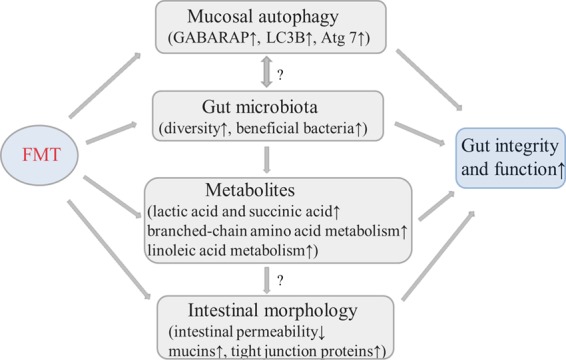
Fecal microbiota transplantation (FMT) is one of the most effective ways to regulate the gut microbiota. Here, we investigated the effect of exogenous fecal microbiota on gut function from the perspective of analysis of the mucosal proteomes in a piglet model. A total of 289 differentially expressed proteins were annotated with 4,068 gene ontology (GO) function entries in the intestinal mucosa, and the levels of autophagy-related proteins in the forkhead box O (FoxO) signaling pathway were increased whereas the levels of proteins related to inflammation response were decreased in the recipient. Then, to assess the alleviation of epithelial injury in the Escherichia coli K88-infected piglets following FMT, intestinal microbiome-metabolome responses were determined. 16S rRNA gene sequencing showed that the abundances of beneficial bacteria, such as Lactobacillus and Succinivibrio, were increased whereas those of Enterobacteriaceae and Proteobacteria bacteria were decreased in the infected piglets following FMT. Metabolomic analysis revealed that levels of 58 metabolites, such as lactic acid and succinic acid, were enhanced in the intestinal lumen and that seven metabolic pathways, such as branched-chain amino acid metabolism pathways, were upregulated in the infected piglets following FMT. In concordance with the metabolome data, results of metagenomics prediction analysis also demonstrated that FMT modulated the metabolic functions of gut microbiota associated with linoleic acid metabolism. In addition, intestinal morphology was improved, a result that coincided with the decrease of intestinal permeability and the enhancement of mucins and mucosal expression of tight junction proteins in the recipient. Taken together, the results showed that FMT triggered intestinal mucosal protective autophagy and alleviated gut barrier injury through alteration of the gut microbial structure. IMPORTANCE The gut microbiota plays a crucial role in human and animal health, and its disorder causes multiple diseases. Over the past decade, FMT has gained increasing attention due to the success in treating Clostridium difficile infection (CDI) and inflammatory bowel disease (IBD). Although FMT appears to be effective, how FMT functions in the recipient remains unknown. Whether FMT exerts this beneficial effect through a series of changes in the host organism caused by alteration of gut microbial structure is also not known. In the present study, newborn piglets and E. coli K88-infected piglets were selected as models to explore the interplay between host and gut microbiota following FMT. Our results showed that FMT triggered intestinal mucosal autophagy and alleviated gut barrier injury caused by E. coli K88. This report provides a theoretical basis for the use of FMT as a viable therapeutic method for gut microbial regulation.

Keywords: autophagy; fecal microbiota transplantation; gut barrier; gut microbiota; piglets.


Figures

FIG 1
FIG 1
GO distribution analysis of differentially expressed proteins in the mucosa. The horizontal coordinate axis indicates the enriched GO functional classifications.
FIG 2
FIG 2
Pathway-based analysis of the differentially expressed proteins in colonic mucosa. (A) Top six pathways with significant differences. The color gradient represents the P values; the closer the color is to red, the smaller the P value is and the higher the significance level of the corresponding KEGG pathway enrichment is. (B) Top 20 pathways for enrichment of differentially expressed proteins. HTLV-1, human T-lymphotropic virus type 1.
FIG 3
FIG 3
Western blot analysis of the differentially expressed proteins and selected key proteins. The results of statistical analysis are shown below the protein expression map. Values are means ± standard errors of the means. *, P < 0.05 (n = 3). Con, control.
FIG 4
FIG 4
Richness and diversity of colonic microbiota. (A) Chao 1 index. (B) Observed-species. (C) Shannon index. (D) Simpson index. Values are means ± standard errors of the means. *, P < 0.05 (n = 6).
FIG 5
FIG 5
Relative abundances of colonic microbiota at the phylum, family, and genus levels. (A) Relative abundances of intestinal microbiota at three different levels in the piglets left uninfected of infected with E. coli K88 (n = 6). (B) Relative abundances of colonic microbiota at three different levels in the infected piglets treated with or without exogenous fecal microbiota (n = 6).
FIG 6
FIG 6
Structural changes and functional metagenomics prediction analysis of colonic microbiota. (A) Cladogram of enriched taxa based on LEfSe determinations revealing significant differences in microbial communities between the blank and K88 groups and the K88-plus-PBS and K88-plus-FMT groups (n = 6), respectively. Bacterial taxa with an LDA score of >2 were selected as biomarker taxa (p, phylum level; c, class level; o, order level; f, family level; g, genus level). (B) Bar graphs of the relative abundances of the members of selected bacterial families in the four groups (n = 6). (C) Functional metagenomics prediction of gut microbiota by PICRUSt with significant differences. The significant levels of the relative abundances are shown as error bars in the figure.
FIG 7
FIG 7
Statistical comparison of metabolites and analysis of differential metabolites and key metabolic pathways. (A) PCA score plot, OPLS-DA score plot, and permutation test plot of PLS-DA derived from the GC-TOF/MS metabolite profiles. Blue represents the infected piglets treated with exogenous fecal microbiota, and yellow represents the infected piglets without exogenous fecal microbiota intervention. The green circle represents the R2 value, the blue square represents the Q2 value, the green line represents the regression line of R2, and the blue line represents the regression line of Q2. (B) Heat map of hierarchical clustering analysis. The light blue boxes indicate an expression ratio less than the mean, and the dark red boxes denote an expression ratio greater than the mean. Tree clusters and their shorter Euclidean distances indicate higher similarities. (C) Metabolic pathway analysis of biomarker metabolites. The x axis represents the pathway impact, and the y axis represents the pathway enrichment. Larger sizes and darker colors represent higher pathway enrichment levels and higher pathway impact values, respectively.
FIG 8
FIG 8
Intestinal morphology and barrier analysis of piglets. (A) The morphology of jejunum villi observed by scanning electron microscope. (B) The PAS staining of goblet cells (100×), the number of goblet cells and relative protein expression of MUC2 in colonic mucosa. (C) DAO activity and d-LA content in serum. (D) Relative levels of protein expression of ZO-1 and occludin in the colonic mucosa. Data are expressed as means ± standard deviations (SD). *, P < 0.05 (n = 3). The letters a, b, and c represent the level of statistical significance of the difference between the groups. Identical letters indicate that the difference is not significant; different letters indicate that the difference is significant.
FIG 9
FIG 9
Integrative diagram showing the main results obtained in the current work. The up arrows (↑) indicate increasing effects, and the down arrow (↓) indicates decreasing effects. The question marks (?) indicate possible relationships to be further explored in future studies.

Similar articles

Cited by

References

    1. Shade A, Peter H, Allison SD, Baho DL, Berga M, Burgmann H, Huber DH, Langenheder S, Lennon JT, Martiny JBH, Matulich KL, Schmidt TM, Handelsman J. 2012. Fundamentals of microbial community resistance and resilience. Front Microbiol 3:417. doi:10.3389/fmicb.2012.00417. - DOI - PMC - PubMed
    1. Tremaroli V, Backhed F. 2012. Functional interactions between the gut microbiota and host metabolism. Nature 489:242–249. doi:10.1038/nature11552. - DOI - PubMed
    1. Kamada N, Seo SU, Chen GY, Nunez G. 2013. Role of the gut microbiota in immunity and inflammatory disease. Nat Rev Immunol 13:321–335. doi:10.1038/nri3430. - DOI - PubMed
    1. Jones RM, Neish AS. 2017. Redox signaling mediated by the gut microbiota. Free Radic Biol Med 105:41–47. doi:10.1016/j.freeradbiomed.2016.10.495. - DOI - PubMed
    1. Deretic V, Levine B. 2009. Autophagy, immunity, and microbial adaptations. Cell Host Microbe 5:527–549. doi:10.1016/j.chom.2009.05.016. - DOI - PMC - PubMed

LinkOut - more resources