. 2018 Oct 4:1:160.
doi: 10.1038/s42003-018-0169-5. eCollection 2018.

Activation of oxytocin neurons in the paraventricular nucleus drives cardiac sympathetic nerve activation following myocardial infarction in rats

Affiliations

Activation of oxytocin neurons in the paraventricular nucleus drives cardiac sympathetic nerve activation following myocardial infarction in rats

Ranjan K Roy et al. Commun Biol. .

Abstract

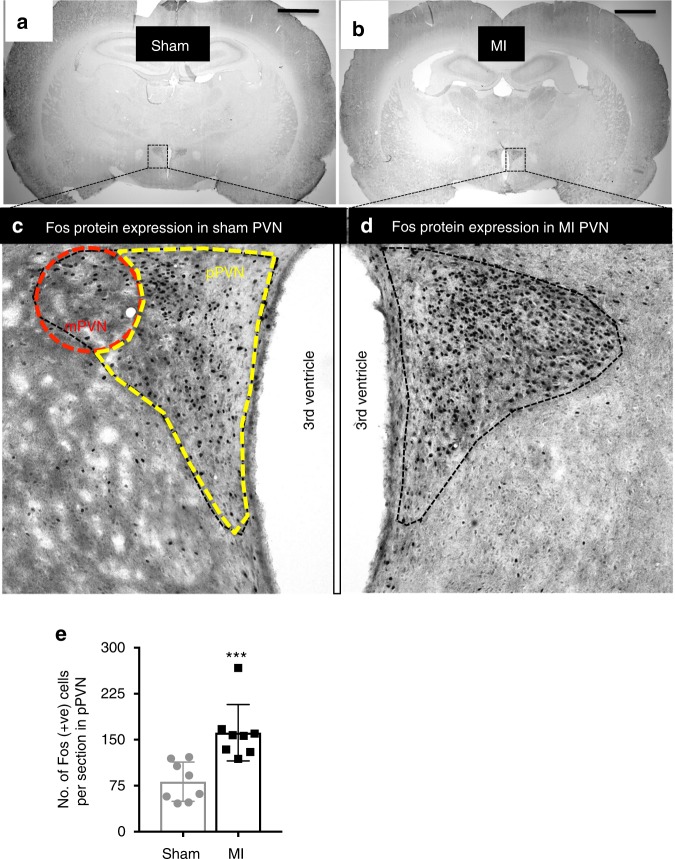
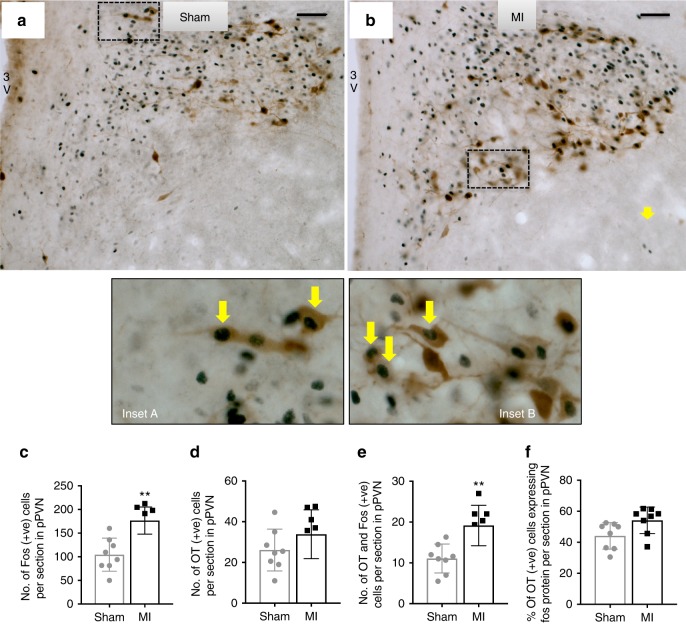
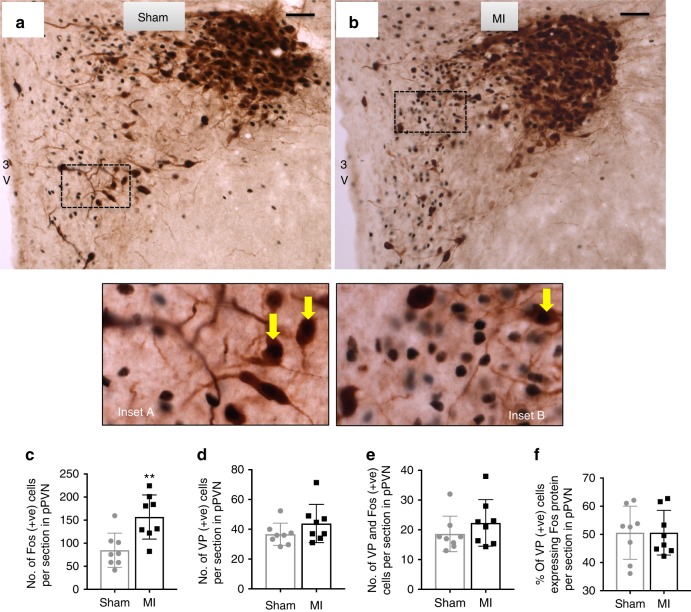
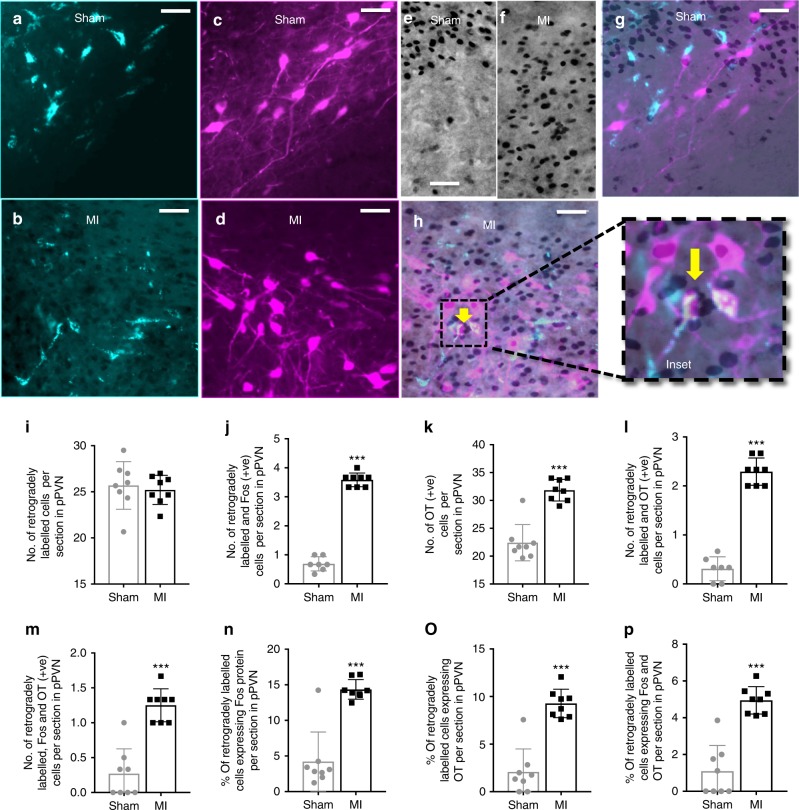
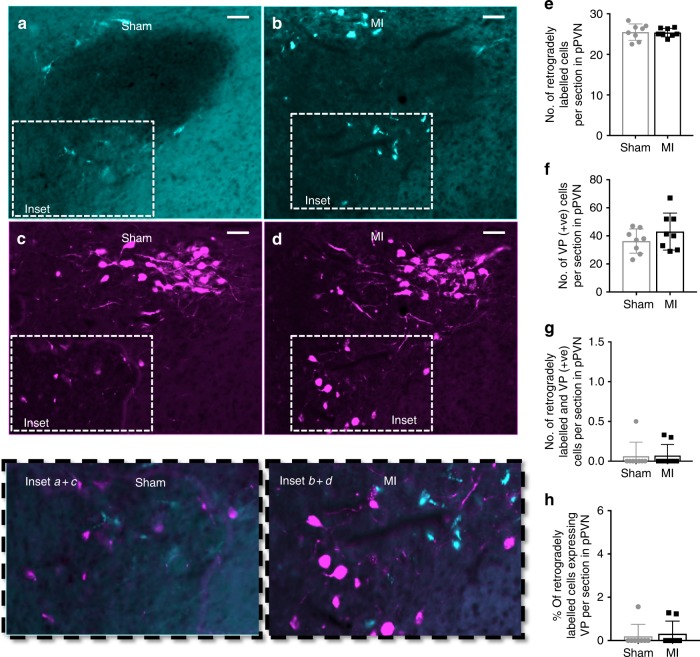
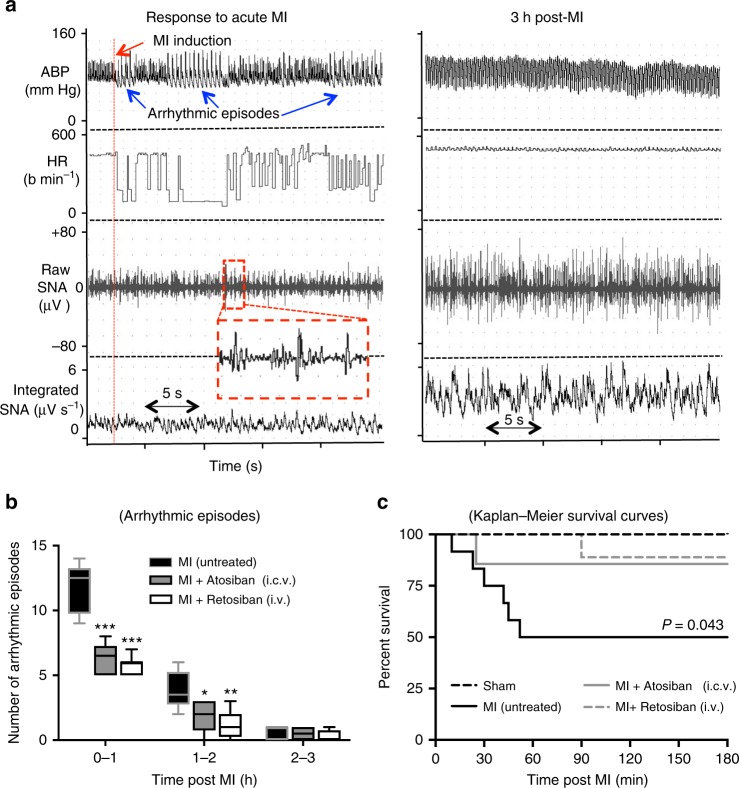
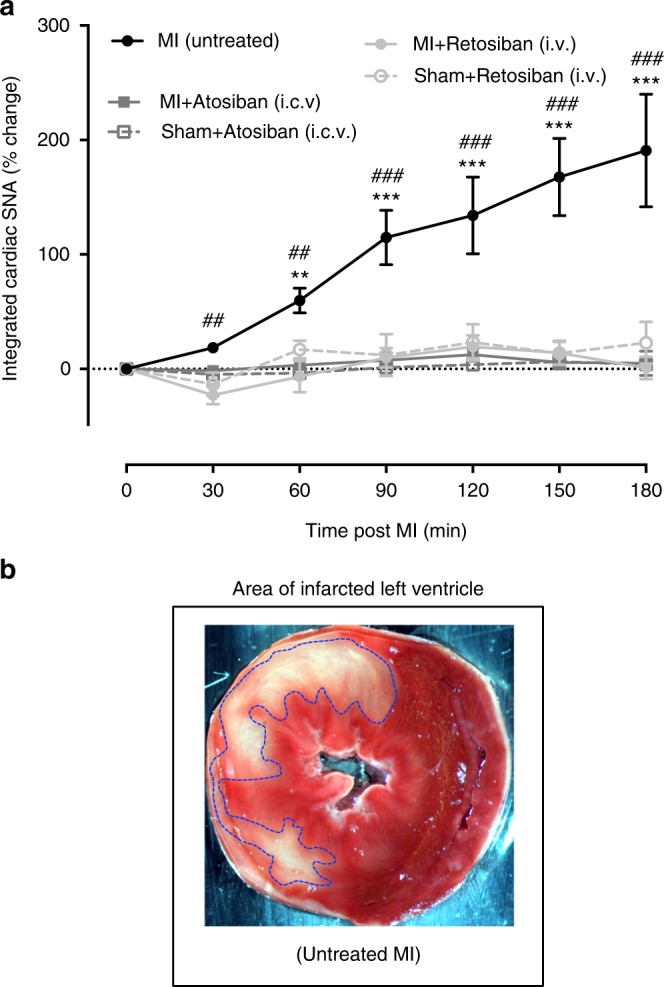
Myocardial infarction (MI) initiates an increase in cardiac sympathetic nerve activity (SNA) that facilitates potentially fatal arrhythmias. The mechanism(s) underpinning sympathetic activation remain unclear. Some neuronal populations within the hypothalamic paraventricular nucleus (PVN) have been implicated in SNA. This study elucidated the role of the PVN in triggering cardiac SNA following MI (left anterior descending coronary artery ligation). By means of c-Fos, oxytocin, and vasopressin immunohistochemistry accompanied by retrograde tracing we showed that MI activates parvocellular oxytocin neurons projecting to the rostral ventral lateral medulla. Central inhibition of oxytocin receptors using atosiban (4.5 µg in 5 µl, i.c.v.), or retosiban (3 mg/kg, i.v.), prevented the MI-induced increase in SNA and reduced the incidence of ventricular arrhythmias and mortality. In conclusion, pre-autonomic oxytocin neurons can drive the increase in cardiac SNA following MI and peripheral administration of an oxytocin receptor blocker could be a plausible therapeutic strategy to improve outcomes for MI patients.


Conflict of interest statement

The authors declare no competing interests.

Figures

Fig. 1
Fig. 1
Parvocellular and magnocellular divisions of the PVN. Photomicrographs of coronal sections through the brain at the level of the paraventricular nucleus (PVN) following sham (a) or acute myocardial infarction (MI; b). c, d High magnification of the PVN, illustrating the division of the parvocellular (yellow) and magnocellular (ref) regions. Black staining indicates c-Fos-positive nuclei. e A bar graph quantifying the number of c-Fos-positive cells in the parvocellular division of the PVN for sham (n = 8) and MI rats (n = 8). All data are presented as mean ± SEM. ***P < 0.001 vs sham, unpaired t-test. Scale bars = 50 μm
Fig. 2
Fig. 2
Parvocellular PVN oxytocin neuronal activation following acute MI. Representative photomicrographs of coronal sections of the PVN following a sham or b acute myocardial infarction (MI). Black staining indicates c-Fos-positive nuclei, brown staining indicates oxytocin-positive cytoplasm, and black surrounded by brown staining indicates co-localization of c-Fos protein with oxytocin (yellow arrows). Insets a, b High-power magnification of the dashed-boxes taken from the low magnification micrographs. The bar graphs (mean ± SEM) show the number of: c c-Fos-positive cells, d oxytocin-positive cells, e cells co-localized with oxytocin+c-Fos-protein, and f percentage of oxytocin-positive cells expressing c-Fos protein per section in bilateral parvocellular division of the PVN (pPVN). **P< 0.01 signficant difference between MI rats (n = 8) and sham rats (n = 8; unpaired t-test). Scale bars = 50 μm. 3V third ventricle, pPVN parvocellular paraventricular nucleus
Fig. 3
Fig. 3
Parvocellular PVN vasopressin neuronal activation following acute MI. Representative photomicrographs of coronal sections through the brain at the level of the PVN following a sham or b acute myocardial infarction (MI). Black staining indicates c-Fos-positive nuclei, brown staining indicates vasopressin-positive cytoplasm, and black nuclei surrounded by brown staining indicates co-localization of c-Fos protein with vasopressin (yellow arrows). Insets a, b High-power magnification of the dashed-boxes taken from the low magnification micrographs. The bar graphs (mean ± SEM) show the number of: c c-Fos-positive cells, d vasopressin-positive cells, e cells co-localized with vasopressin+c-Fos-protein, and f percentage of oxytocin-positive cells expressing c-Fos protein per section in bilateral parvocellular division of the PVN. **P< 0.01 significant difference between MI rats (n = 8) and sham rats (n = 8; unpaired t-test). Scale bars = 50 μm. 3V third ventricle, pPVN parvocellular paraventricular nucleus
Fig. 4
Fig. 4
Retrograde labeling of rostral ventrolateral medulla-projecting pPVN oxytocin neurons. Representative photomicrographs of coronal sections through the brain at the level of the PVN showing: a, b fluorescently stained retrogradely labeled cells and c, d fluorescently stained oxytocin-positive cells, e, f Bright-field c-Fos-positive cells and g, h the co-localization of retrograde label, oxytocin, and c-Fos-protein (yellow arrow) for MI rats (n = 8) and sham rats (n = 8). Inset: high-power magnification showing a close-up of neurons co-labeled for c-Fos + OT + retrograde tracer. Bar graphs (mean ± SEM) present the number of I retrogradely labeled cells, j retrogradely labeled + c-Fos-positive cells, k oxytocin-positive cells, l retrogradely labeled + oxytocin-positive cells, m retrogradely labeled + c-Fos-positive + oxytocin-positive cells, as well as the proportion (%) of n retrogradely labeled cells expressing c-Fos protein, o retrogradely labeled cells expressing oxytocin, and p retrogradely labeled cells expressing c-Fos and oxytocin, per section in the left parvocellular division of the PVN. ***P< 0.001 significant difference between MI rats (n = 8) and sham rats (n = 8; unpaired t-test). Scale bars = 25 μm. pPVN parvocellular paraventricular nucleus
Fig. 5
Fig. 5
Retrograde labeling of rostral ventrolateral medulla-projecting pPVN vasopressin neurons. Representative photomicrographs of coronal sections through the brain at the level of the PVN showing: a, b retrogradely labeled cells (fluorescent green), c, d vasopressin-positive cells (fluorescent red;) and (inset a + b; inset c + d) the co-localization of retrograde label and vasopressin protein. The bar graphs (mean ± SEM) present the number of e retrogradely labeled cells, f vasopressin-positive cells, g the number of retrogradely labeled + vasopressin-positive cells, as well as h percentage of retrogradely labeled cells expressing vasopressin, per section in the left parvocellular division of the PVN. There was no difference in the number of fluorescently stained cells (red and green) in MI rats (n = 8) compared to sham rats (n = 8; unpaired t-test). Scale bars = 50 μm. pPVN parvocellular paraventricular nucleus
Fig. 6
Fig. 6
Effect of atosiban (i.c.v.) and retosiban (i.v.) on arrhythmia and mortality following acute MI. a A typical ‘Chart’ recording showing an example of arrhythmic episodes within the first minute following LAD coronary occlusion (i.e., myocardial infarction (MI)), and the subsequent increase in cardiac SNA at 180 min post MI. The inset (red box) shows a close-up view of several impulse profiles. b The incidence of arrhythmic episodes (mean ± SEM) each hour for consecutive 3 h following MI in untreated MI rats (Untreated; n = 6), or rats treated with atosiban (MI + atosiban, 4.5 µg in 5 µl i.c.v. n = 6) or retosiban (MI + retosiban, 3 mg/kg, i.v. n = 8). Both atosiban and retosiban significantly reduced the incidence of arrhythmic episodes following acute MI, compared to saline-treated MI rats (*P< 0.05, **P< 0.01, ***P< 0.001, unpaired t-test). c Kaplan–Meier survival analysis showing a greater mortality rate in MI + saline rats (n = 12) compared to MI + retosiban rats (n = 9; P = 0.043) and MI + atosiban rats (n = 7; NS) within 3 h of the MI. None of the sham rats (n = 6) died during the experiment. SNA sympathetic nerve activity
Fig. 7
Fig. 7
Effect of atosiban (i.c.v.) and retosiban (i.v.) on cardiac sympathetic nerve activity following acute MI. a Changes in cardiac sympathetic nerve activity (% increase in cardiac SNA – of integrated area of the raw nerve signal) in SHAM rats treated with atosiban (4.5 µg in 5 µl i.c.v. n = 6) or retosiban (3 mg/kg, i.v. n = 6), or untreated MI rats (n = 6), or M -rats treated with atosiban (i.c.v. n = 6) or retosiban (3 mg kg−1, i.v. n = 8). There was a significant main effect of TIME (F(6, 90) = 10.96, P< 0.0001, two-way RM ANOVA), TREATMENT (F(2, 15) = 12.37, P= 0.0007, two-way RM ANOVA), and a significant TIME × TREATMENT interaction (F(12, 90) = 5.69, P< 0.0001, two-way RM ANOVA). *P< 0.05, ***P< 0.001 vs pre-MI (time zero), #P< 0.05, ###P< 0.001 vs MI + retosiban and vs MI + atosiban, Bonferroni’s post hoc test. All data are presented as mean ± SEM. b Representative transverse section of a heart slice stained with tetrazolium chloride (TTC) as a quantitative means of assessing of infarct size. The viable myocardium absorbs the TTC stain and forms a reddish pink pigment. In contrast, the infarcted myocardium remains unstained pale-white (encircled by blue dashed line)

Similar articles

Cited by

References

    1. Jardine DL, et al. Increased cardiac sympathetic nerve activity following acute myocardial infarction in a sheep model. J. Physiol. 2005;565:325–333. doi: 10.1113/jphysiol.2004.082198. - DOI - PMC - PubMed
    1. Keating MT, Sanguinetti MC. Molecular and cellular mechanisms of cardiac arrhythmias. Cell. 2001;104:569–580. doi: 10.1016/S0092-8674(01)00243-4. - DOI - PubMed
    1. Kaye DM, et al. Adverse consequences of high sympathetic nervous activity in the failing human heart. JACC. 1995;26:1257–1263. doi: 10.1016/0735-1097(95)00332-0. - DOI - PubMed
    1. Graham LN, Smith PA, Stoker JB, Mackintosh AF, Mary DASG. Time course of sympathetic neural hyperactivity after uncomplicated acute myocardial infarction. Circulation. 2002;106:793–797. doi: 10.1161/01.CIR.0000025610.14665.21. - DOI - PubMed
    1. Hall TM, Gordon C, Roy R, Schwenke DO. Delayed coronary reperfusion is ineffective at impeding the dynamic increase in cardiac efferent sympathetic nerve activity following myocardial ischemia. Basic Res. Cardiol. 2016;111:1–9. doi: 10.1007/s00395-016-0556-3. - DOI - PubMed