

High-density element concentrations in fish from subtidal to hadal zones of the Pacific Ocean
- PMID: 30320235
- PMCID: PMC6180415
- DOI: 10.1016/j.heliyon.2018.e00840
High-density element concentrations in fish from subtidal to hadal zones of the Pacific Ocean
Abstract
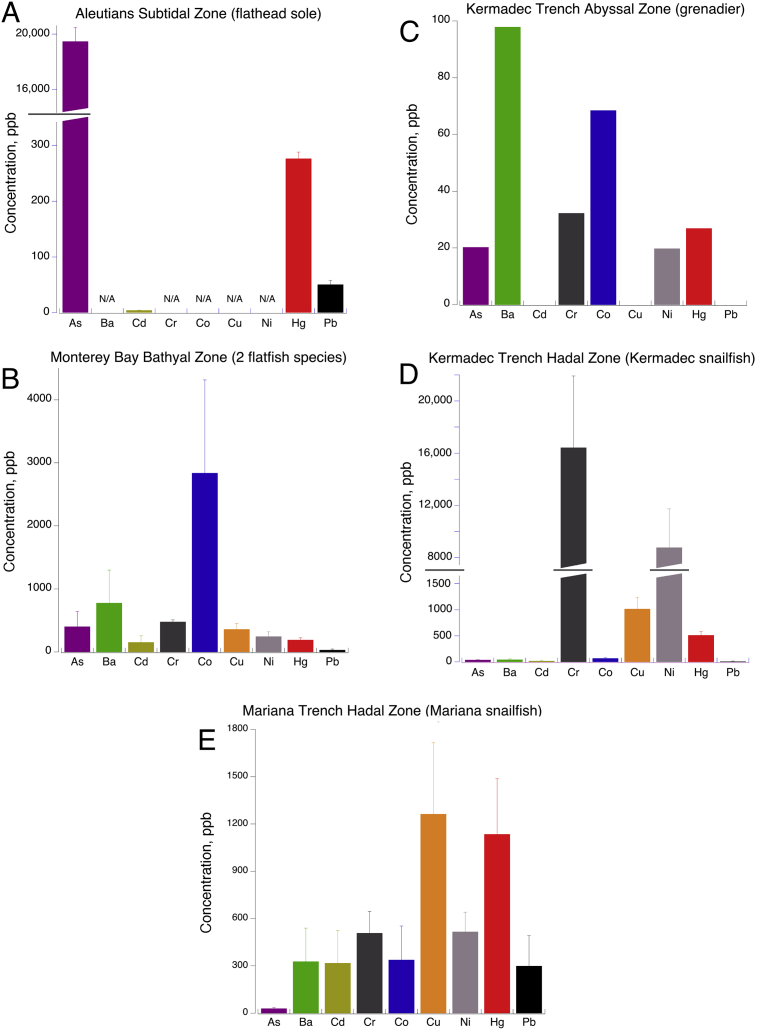
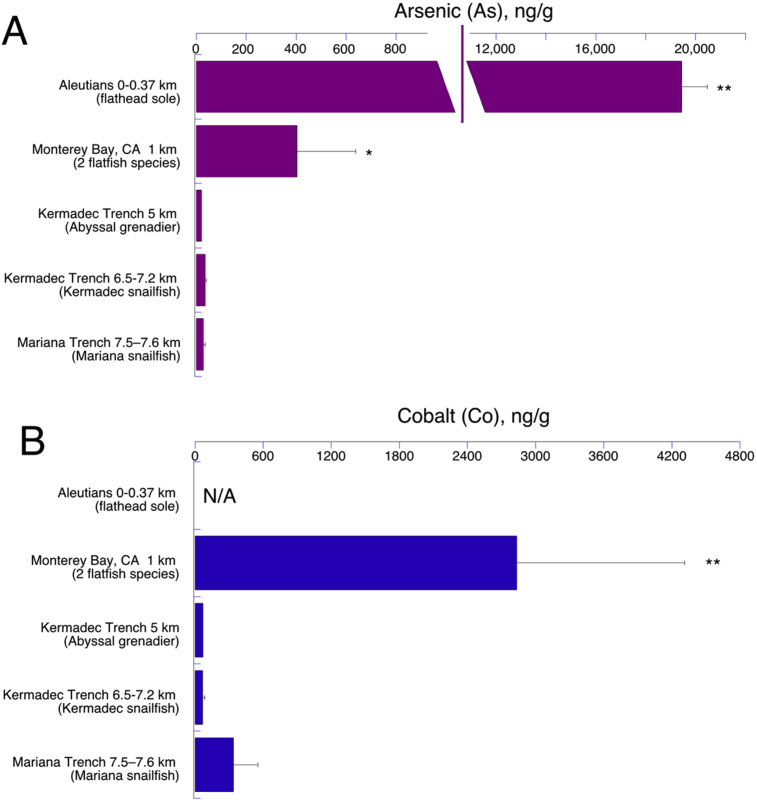
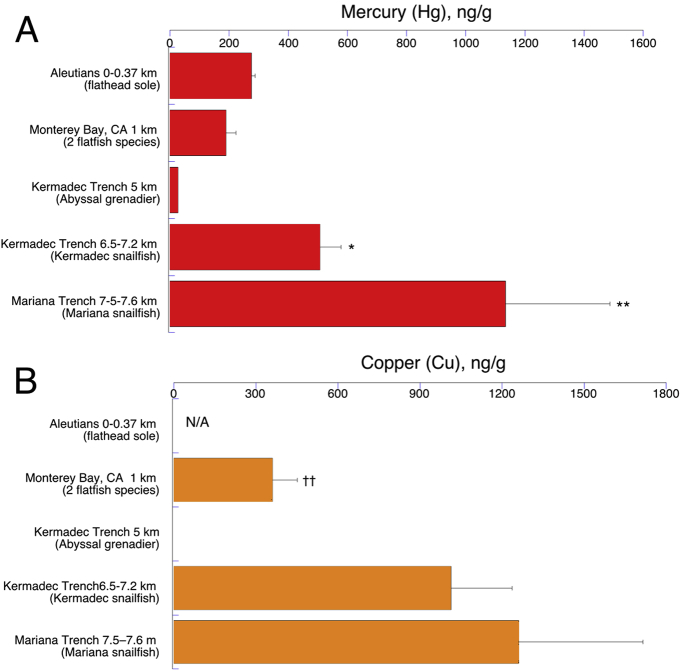
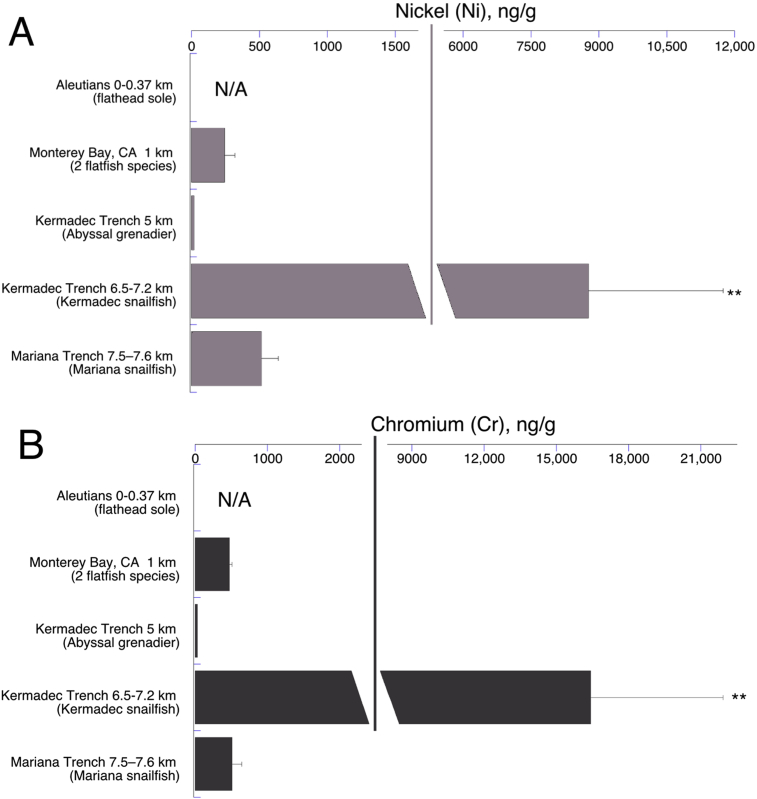
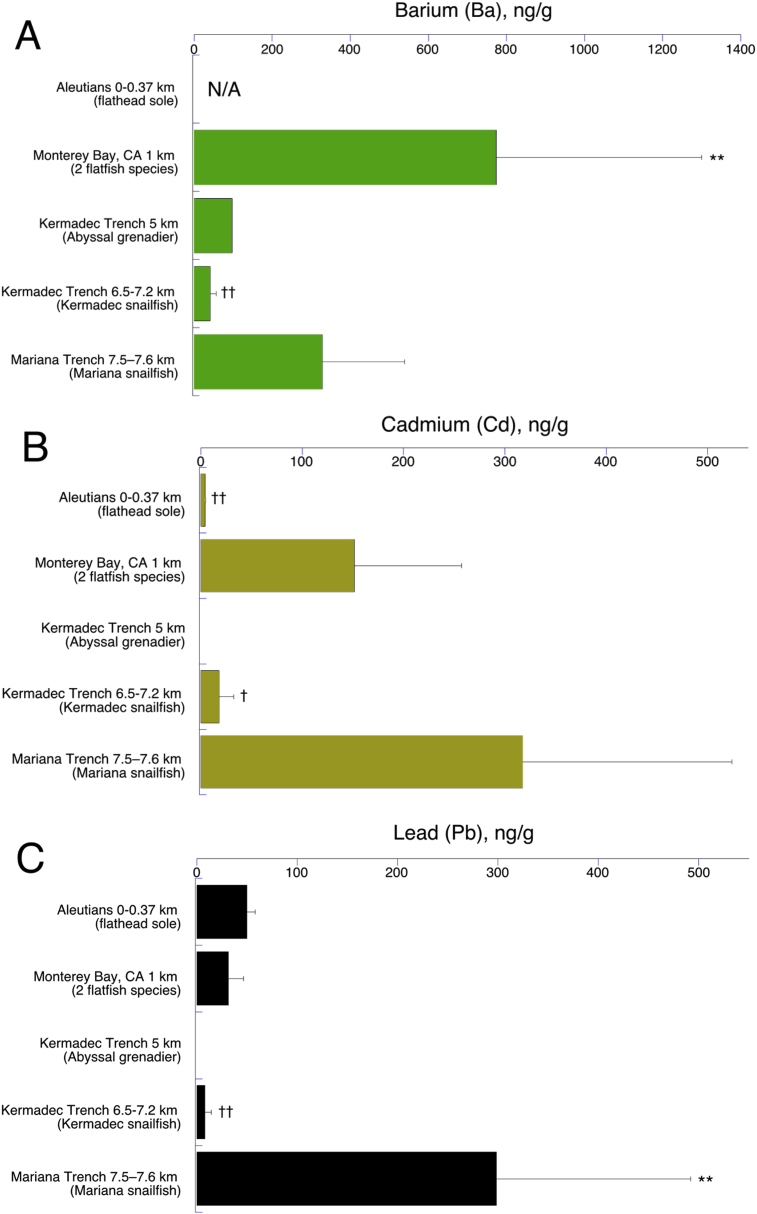
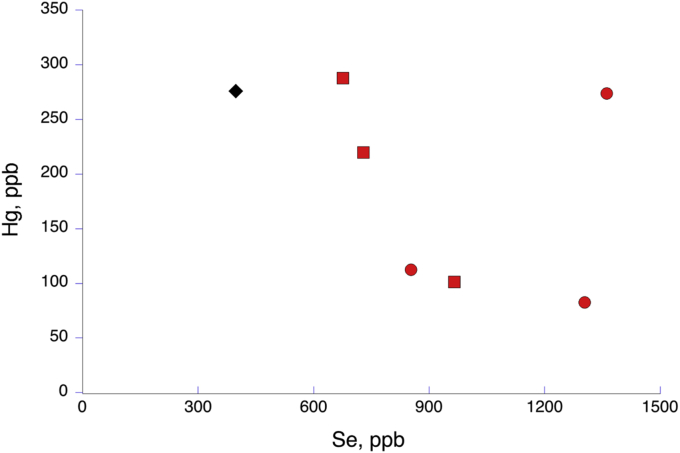
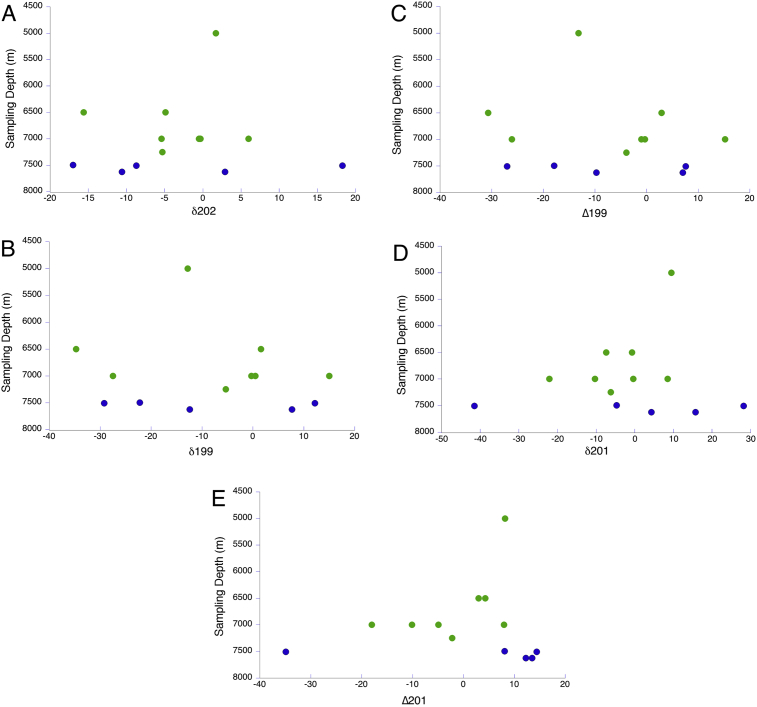
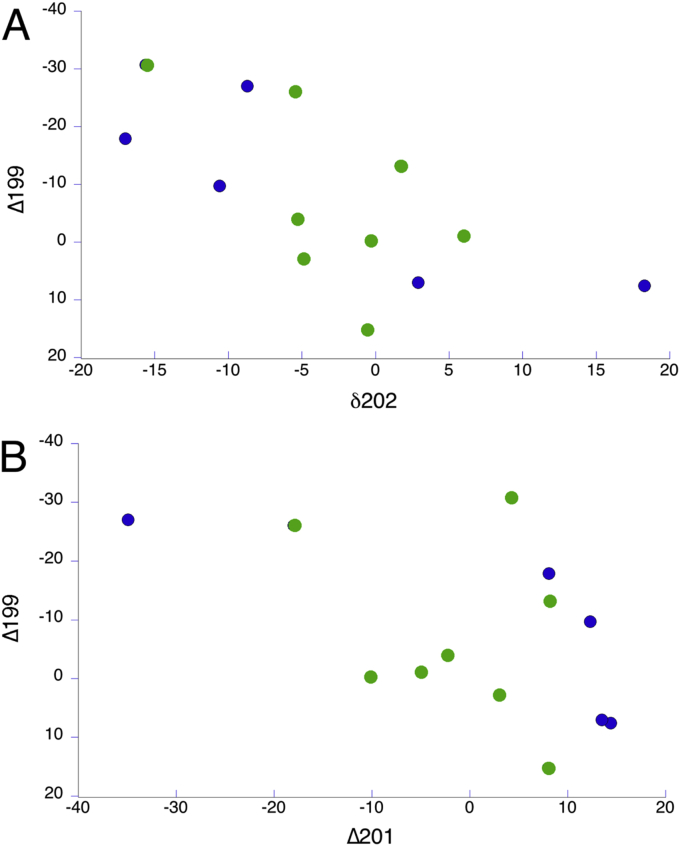
Anthropogenic use of high density, toxic elements results in marine pollution which is bio-accumulating throughout marine food webs. While there have been several studies in various locations analyzing such elements in fish, few have investigated patterns in these elements and their isotopes in terms of ocean depth, and none have studied the greatest depth zones. We used a flame atomic absorption spectrophotometer-hydride system and an inductively coupled plasma-mass spectrometer to determine concentrations of the high-density elements arsenic (As), cadmium (Cd), chromium (Cr), cobalt (Co), copper (Cu), lead (Pb), mercury (Hg), nickel (Ni), selenium (Se), plus the light-metal barium (Ba), in fish ranging from bathyal (1000 m in Monterey Bay) to upper hadal zones (6500-7626 m in the Kermadec and Mariana Trenches) in the Pacific Ocean. Five species of fish-including the Mariana Trench snailfish, the world's deepest known fish newly discovered-were analyzed for patterns in total element concentration, depth of occurrence, Se:Hg ratio, plus mercury isotopes in the deepest species. Co and As levels decreased with depth. In the Mariana Trench, Pb, Hg, Cd, and Cu were higher than in all other samples, and higher in those plus Ba than in the Kermadec Trench. The latter samples had far higher Ni and Cr levels than all others. Mercury relative isotope analysis showed no depth trends in the deepest species. Se:Hg showed a large molar excess of Se in bathyal flatfish species. These patterns indicate that exposures to pollutants differ greatly between habitats including trenches of similar depths.
Keywords: Biogeoscience; Earth sciences; Environmental science; Geochemistry; Oceanography.
Figures
Similar articles
-
Mercury isotopes identify near-surface marine mercury in deep-sea trench biota.Proc Natl Acad Sci U S A. 2020 Nov 24;117(47):29292-29298. doi: 10.1073/pnas.2012773117. Epub 2020 Nov 16. Proc Natl Acad Sci U S A. 2020. PMID: 33199629 Free PMC article.
-
Trace Elemental Analysis of the Exoskeleton, Leg Muscle, and Gut of Three Hadal Amphipods.Biol Trace Elem Res. 2022 Mar;200(3):1395-1407. doi: 10.1007/s12011-021-02728-9. Epub 2021 May 21. Biol Trace Elem Res. 2022. PMID: 34018124
-
Geology, environment, and life in the deepest part of the world's oceans.Innovation (Camb). 2021 May 1;2(2):100109. doi: 10.1016/j.xinn.2021.100109. eCollection 2021 May 28. Innovation (Camb). 2021. PMID: 34557759 Free PMC article. Review.
-
Pseudoliparis swirei sp. nov.: A newly-discovered hadal snailfish (Scorpaeniformes: Liparidae) from the Mariana Trench.Zootaxa. 2017 Nov 28;4358(1):161-177. doi: 10.11646/zootaxa.4358.1.7. Zootaxa. 2017. PMID: 29245485
-
Mercury (Hg), Lead (Pb), Cadmium (Cd), Selenium (Se), and Arsenic (As) in Liver, Kidney, and Feathers of Gulls: A Review.Rev Environ Contam Toxicol. 2019;247:85-146. doi: 10.1007/398_2018_16. Rev Environ Contam Toxicol. 2019. PMID: 30413976 Review.
Cited by
-
Assessment of metal concentrations in oysters and shrimp from Atlantic Coast of the Democratic Republic of the Congo.Heliyon. 2019 Dec 24;5(12):e03049. doi: 10.1016/j.heliyon.2019.e03049. eCollection 2019 Dec. Heliyon. 2019. PMID: 32083201 Free PMC article.
-
Genomic Characteristics and Potential Metabolic Adaptations of Hadal Trench Roseobacter and Alteromonas Bacteria Based on Single-Cell Genomics Analyses.Front Microbiol. 2020 Jul 24;11:1739. doi: 10.3389/fmicb.2020.01739. eCollection 2020. Front Microbiol. 2020. PMID: 32793171 Free PMC article.
-
Microbiomes in the Challenger Deep slope and bottom-axis sediments.Nat Commun. 2022 Mar 21;13(1):1515. doi: 10.1038/s41467-022-29144-4. Nat Commun. 2022. PMID: 35314706 Free PMC article.
-
Impact of dumpsite compost on heavy metal accumulation in some cultivated plants.BMC Res Notes. 2025 Jan 17;18(1):20. doi: 10.1186/s13104-025-07083-9. BMC Res Notes. 2025. PMID: 39819793 Free PMC article.
-
Ecogenomics reveals viral communities across the Challenger Deep oceanic trench.Commun Biol. 2022 Oct 4;5(1):1055. doi: 10.1038/s42003-022-04027-y. Commun Biol. 2022. PMID: 36192584 Free PMC article.
References
-
- ATSDR (Agency for Toxic Substances and Disease Registry) Centers for Disease Control; Atlanta, GA: 2004. Toxicological Profile for Copper.https://www.atsdr.cdc.gov/toxprofiles/tp.asp?id=206&tid=37
-
- Albare'de F., Telouk P., Blichert-Toft J., Boye M., Agranier A., Nelson B. Precise and accurate isotopic measurements using multiple-collector ICPMS. Geochim. Cosmochim. Acta. 2004;68:2725–2744.
-
- Bergquist B.A., Blum J.D. Mass-dependent and -independent fractionation of Hg isotopes by photo-reduction in aquatic systems. Science. 2007;318:417–420. - PubMed
-
- Blum J.D., Erel Y. vol. 5. Elsevier; New York: 2003. Radiogenic isotopes in weathering and hydrology; pp. 365–392. (Treatise on Geochemistry). 12.
LinkOut - more resources
Full Text Sources
Molecular Biology Databases
Research Materials
