. 2018 Sep 30;3(9):10733-10742.
doi: 10.1021/acsomega.8b01499. Epub 2018 Sep 6.

Reporter Selection for Nanotags in Multiplexed Surface Enhanced Raman Spectroscopy Assays

Affiliations

Reporter Selection for Nanotags in Multiplexed Surface Enhanced Raman Spectroscopy Assays

Maria Sánchez-Purrà et al. ACS Omega. .

Abstract

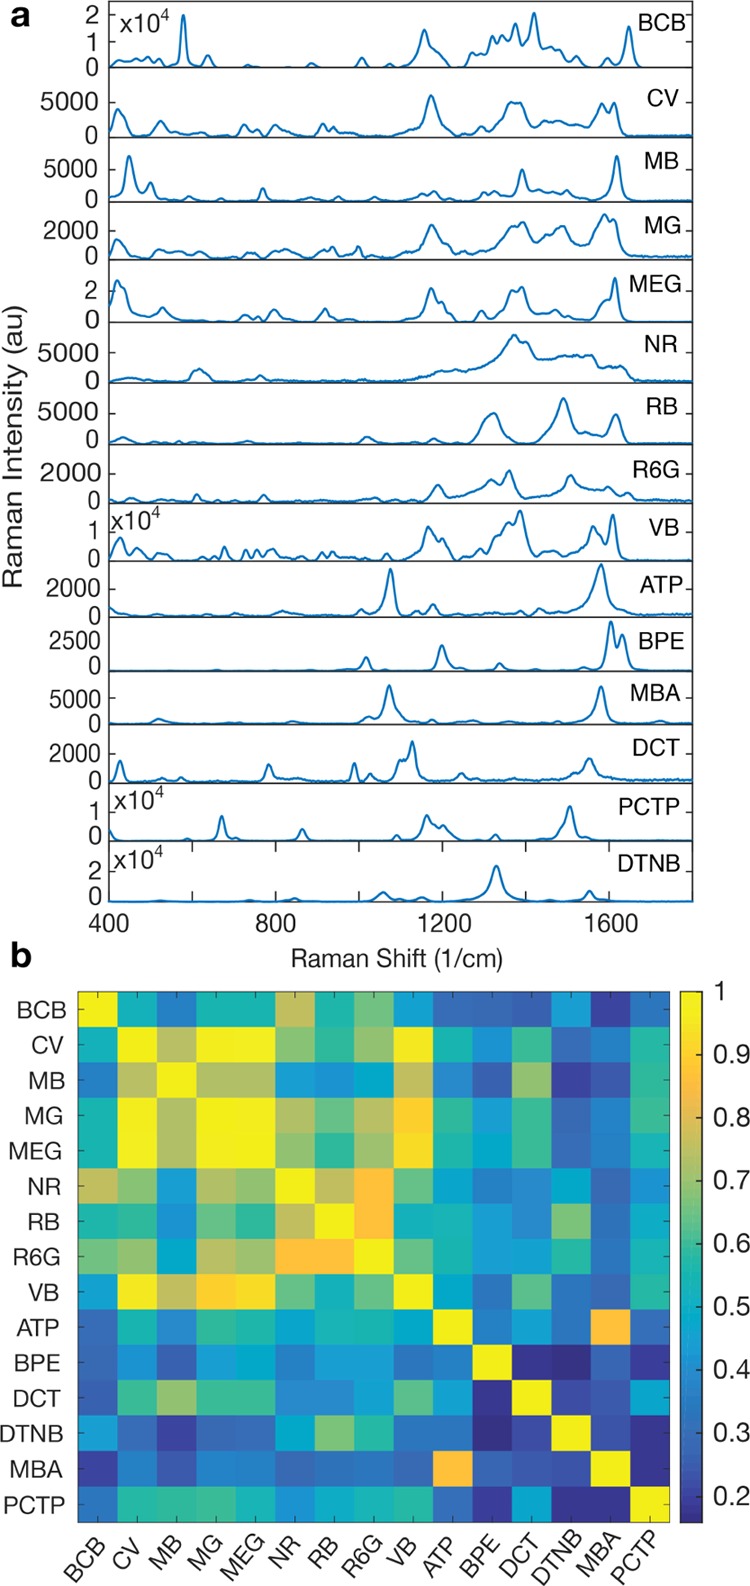
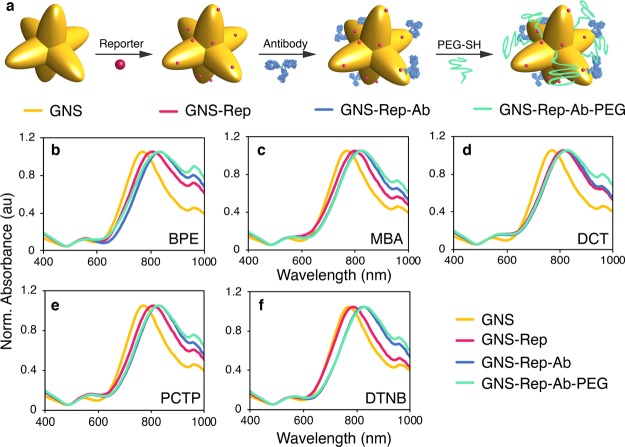
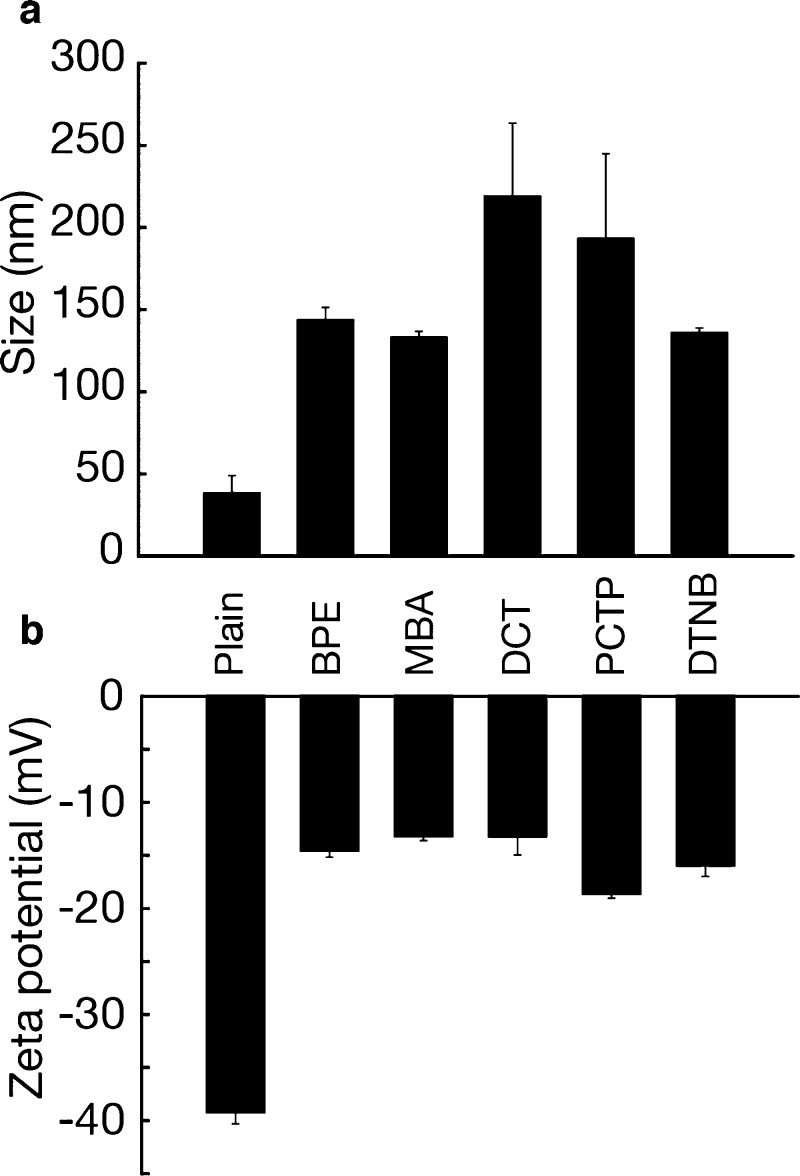
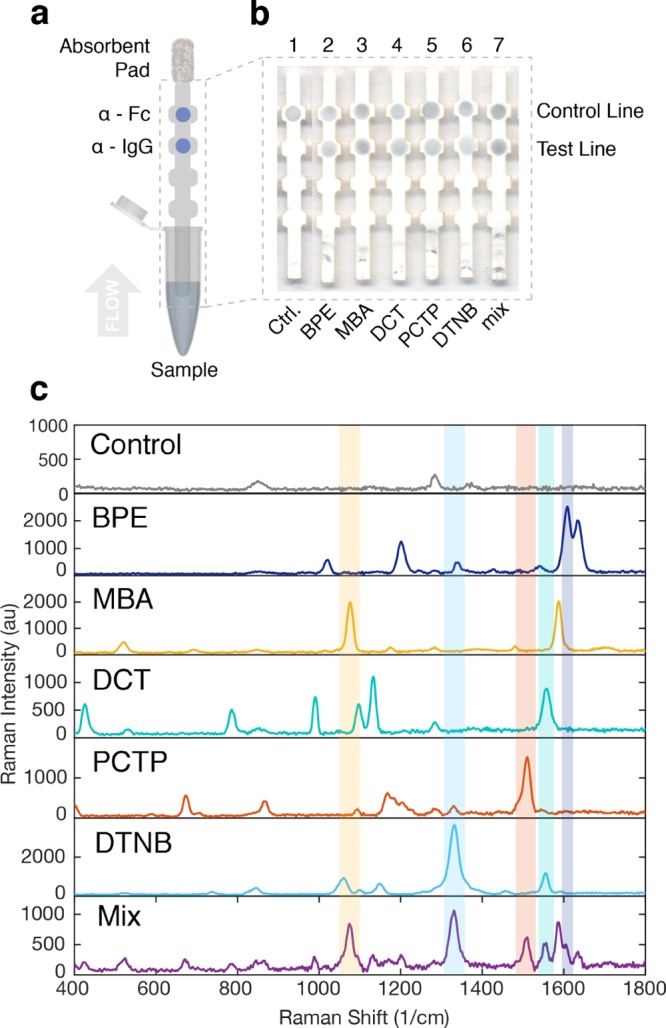
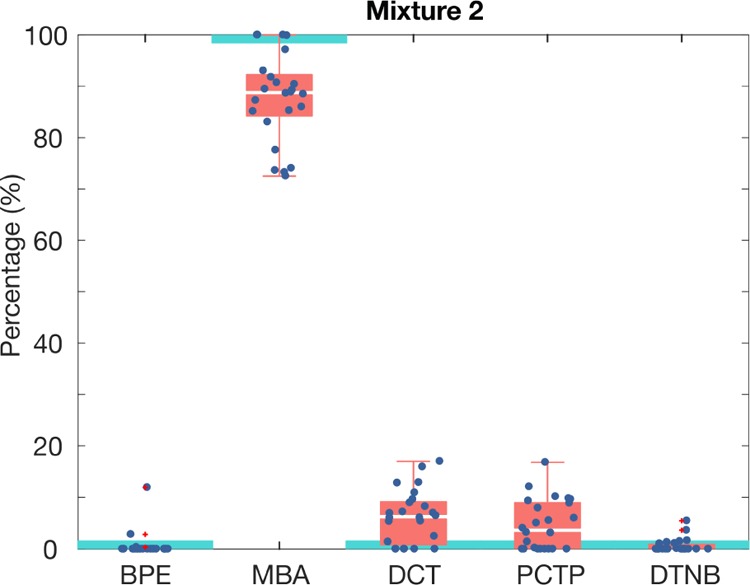
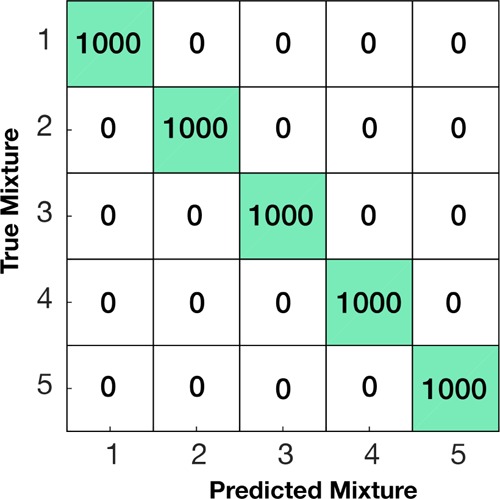
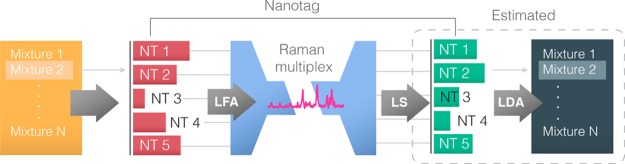
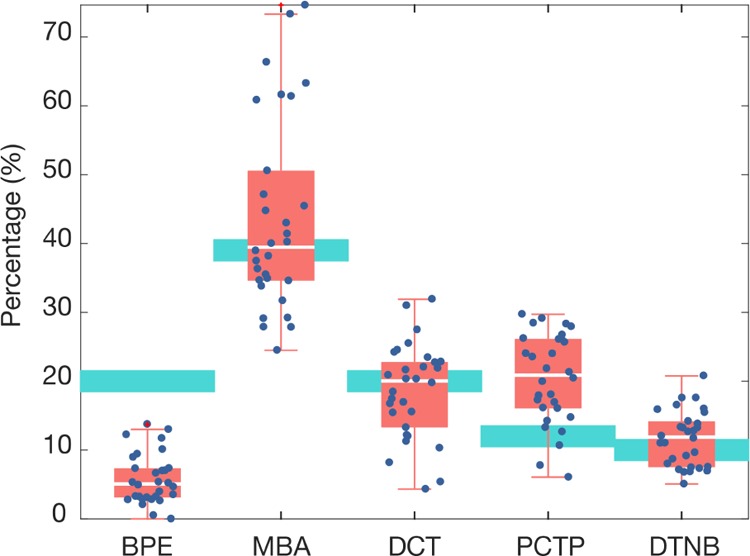
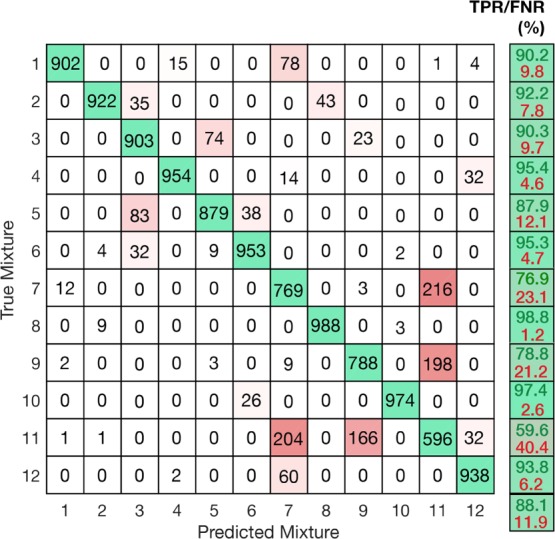
We report a quantitative evaluation of the choice of reporters for multiplexed surface-enhanced Raman spectroscopy (SERS). An initial library consisted of 15 reporter molecules that included commonly used Raman dyes, thiolated reporters, and other small molecules. We used a correlation matrix to downselect Raman reporters from the library to choose five candidates: 1,2-bis(4-pyridyl)ethylene, 4-mercaptobenzoic acid, 3,5-dichlorobenzenthiol, pentachlorothiophenol, and 5,5'-dithiobis(2-nitrobenzoic acid). We evaluated the ability to distinguish the five SERS reporters in a dipstick immunoassay for the biomarker human IgG. Raman nanotags, or gold nanostars conjugated to the five reporters and anti-human IgG polyclonal antibodies were constructed. A linear discriminant analysis approach was used to evaluate the separation of the nanotag spectra in mixtures of fixed ratios.


Conflict of interest statement

The authors declare no competing financial interest.

Figures

Figure 1
Figure 1
Characterization of plain GNS. (a) Optical absorption of plain GNS. (b) TEM images of plain GNSs (scale bar = 100 nm).
Figure 2
Figure 2
SERS signal of selected reporters on GNS. (a) SERS spectra of the 15 selected Raman reporters. (b) Correlation matrix built from the SERS spectra. The color bar indicates the level of overlapping signals, where 1 (yellow) means 100% overlap and 0 (dark blue) means 0% overlap. Name legend: brilliant cresyl blue (BCB), crystal violet (CV), methylene blue (MB), malachite green isocyanate (MG), methylene green (MEG), neutral red (NR), rose bengal (RB), rhodamine 6G (R6G), victoria blue (VB), 4-aminothiophenol (ATP), BPE, MBA, 3,5-dichlorobenzenthiol (DCT), pentachlorothiophenol (PCTP), and 5,5′-dithiobis(2-nitrobenzoic acid) (DTNB).
Figure 3
Figure 3
(a) Preparation of SERS-encoded conjugates (“nanotags”). Normalized optical spectra of plain nanostars (GNS; yellow), after encoding with Raman reporter (GNS–Rep; pink), after antibody conjugation (GNS–Rep–Ab; blue) and after PEG backfill addition (GNS–Rep–Ab–PEG; green) for (b) BPE, (c) MBA, (d) DCT, (e) PCTP, and (f) DTNB.
Figure 4
Figure 4
Characterization of antibody-conjugated GNS. (a) DH and (b) zeta potential of anti-IgG-conjugated GNS (error bars are measurements of n = 5 ± standard deviation).
Figure 5
Figure 5
Use of nanotags in a sandwich immunoassay for IgG. (a) Dipstick flow immunoassay scheme. (b) Resulting strips from running individual nanotags with the five reporters (strips 2–6) and strip from the mixture of all nanotags (strip 7). Strip 1 is the negative control. (c) SERS spectra of the negative control, the five nanotags and the mixture (mix).
Figure 6
Figure 6
Nanotag ratio estimation for an assay run with an individual nanotag using the LS algorithm where MBA was present at 100% and all other reporters were at 0% (mixture 2). Each data point represents the individual SERS intensities for a region of the test area. Red boxes show 50% of the data between the second (lower limit) and the third quartile (upper limit), and the median (white line). Whiskers indicate the value of the maximum and the minimum. SERS intensities were measured for 30 regions in a test area. Light blue boxes represent the real ratio of reporter in the mixture.
Figure 7
Figure 7
Confusion matrix of the individual tests using the LDA classifier.
Figure 8
Figure 8
Diagram of the approach followed to identify the mixture present in a sample based on the nanotag ratio.
Figure 9
Figure 9
Nanotag ratio estimation using LS algorithm for mixture 5 which had BPE 20%, MBA 39%, DCT 20%, PCTP 12%, and DTNB 10%. Each data point represents the individual SERS intensities for a region of the test area. Red boxes show 50% of the data between the second (lower limit) and the third quartile (upper limit), and the median (white line). Whiskers indicate the value of the maximum and the minimum. SERS intensities were measured for 30 regions in a test area. Light blue boxes represent the real ratio of reporter in the mixture.
Figure 10
Figure 10
Confusion matrix of the 12 mixtures tested as defined by Table 1 using LDA classifier.

Similar articles

Cited by

References

    1. Lu X.; Rycenga M.; Skrabalak S. E.; Wiley B.; Xia Y. Chemical Synthesis of Novel Plasmonic Nanoparticles. Annu. Rev. Phys. Chem. 2009, 60, 167–192. 10.1146/annurev.physchem.040808.090434. - DOI - PubMed
    1. Zeman E. J.; Schatz G. C. An Accurate Electromagnetic Theory Study of Surface Enhancement Factors for Silver, Gold, Copper, Lithium, Sodium, Aluminum, Gallium, Indium, Zinc, and Cadmium. J. Phys. Chem. 1987, 91, 634–643. 10.1021/j100287a028. - DOI
    1. Reguera J.; Langer J.; de Aberasturi D. J.; Liz-Marzán L. M. Anisotropic Metal Nanoparticles for Surface Enhanced Raman Scattering. Chem. Soc. Rev. 2017, 46, 3866–3885. 10.1039/c7cs00158d. - DOI - PubMed
    1. Fabris L. Gold-Based Sers Tags for Biomedical Imaging. J. Opt. 2015, 17, 114002.10.1088/2040-8978/17/11/114002. - DOI
    1. Vo-Dinh T.; Liu Y.; Fales A. M.; Ngo H.; Wang H.-N.; Register J. K.; Yuan H.; Norton S. J.; Griffin G. D. Sers Nanosensors and Nanoreporters: Golden Opportunities in Biomedical Applications. Wiley Interdiscip. Rev.: Nanomed. Nanobiotechnol. 2014, 7, 17–33. 10.1002/wnan.1283. - DOI - PubMed