. 2018 Sep 30;3(9):11742-11757.
doi: 10.1021/acsomega.8b01379. Epub 2018 Sep 24.

Conformational Sampling of Macrocyclic Drugs in Different Environments: Can We Find the Relevant Conformations?

Affiliations

Conformational Sampling of Macrocyclic Drugs in Different Environments: Can We Find the Relevant Conformations?

Vasanthanathan Poongavanam et al. ACS Omega. .

Abstract

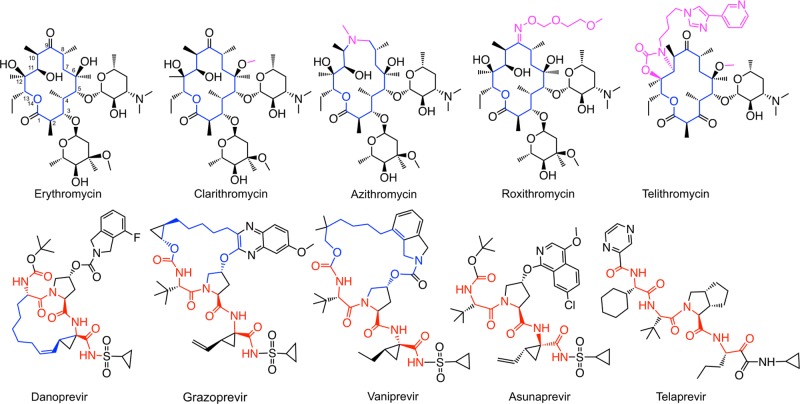
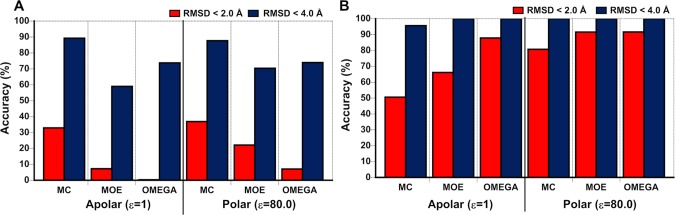
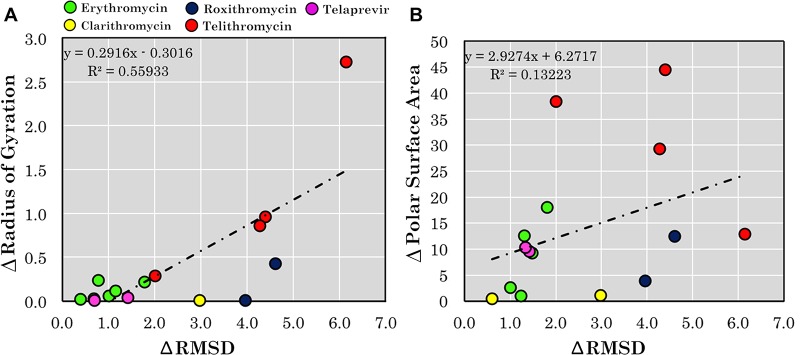
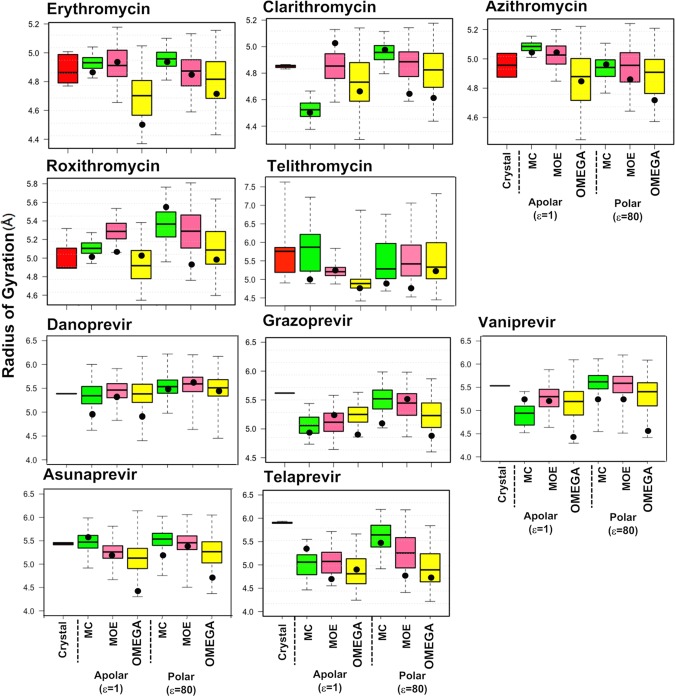
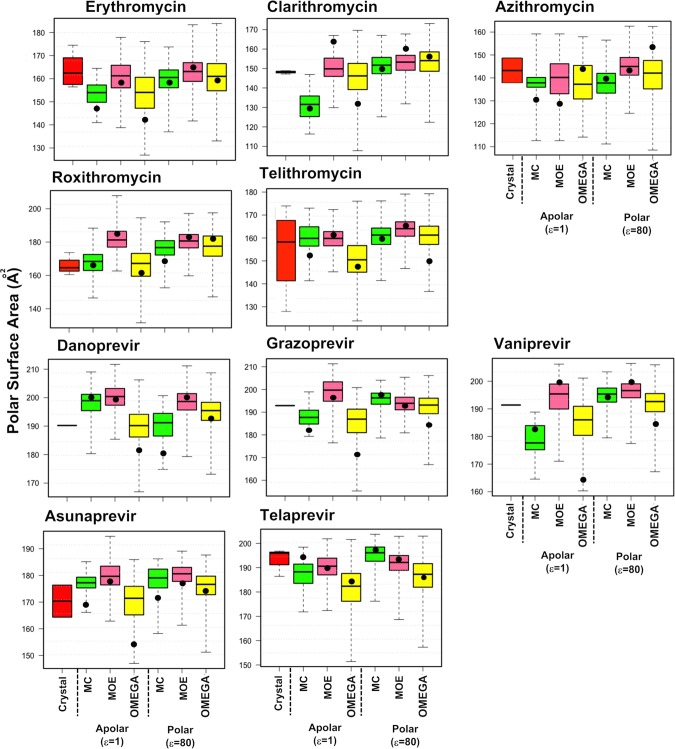
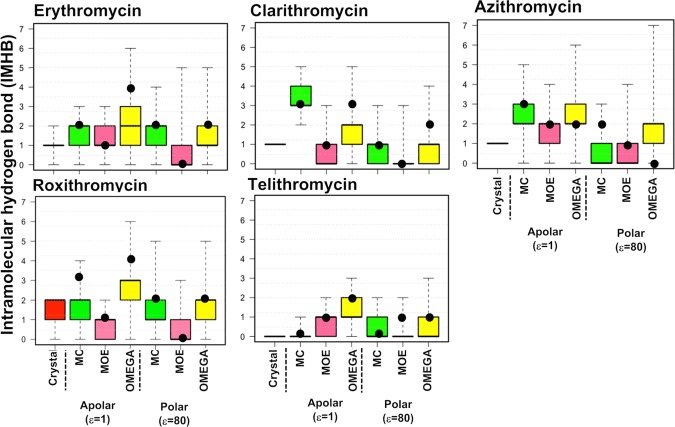
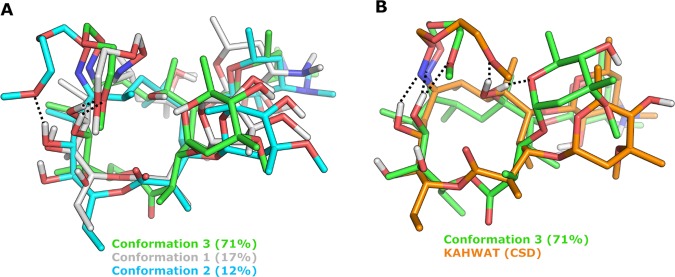
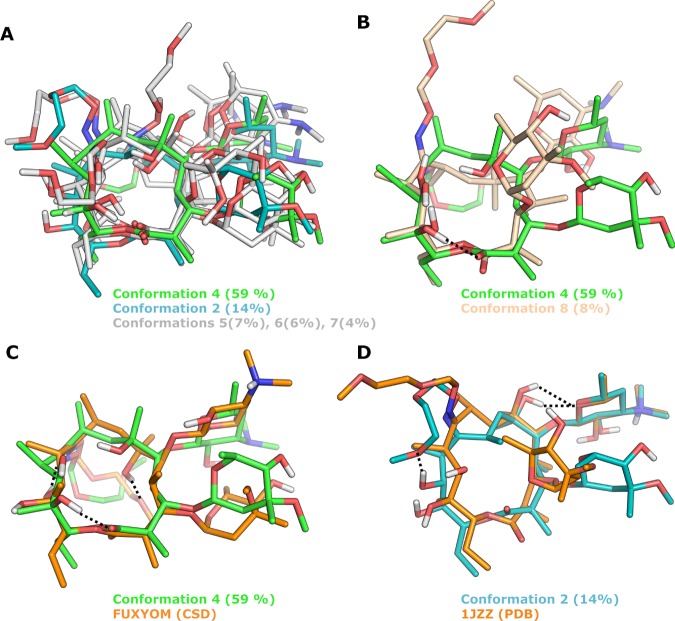
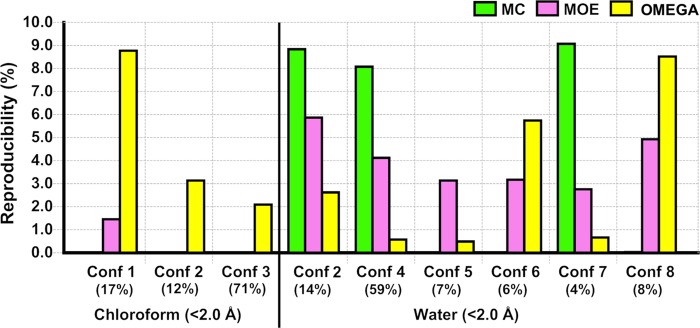
Conformational flexibility is a major determinant of the properties of macrocycles and other drugs in beyond rule of 5 (bRo5) space. Prediction of conformations is essential for design of drugs in this space, and we have evaluated three tools for conformational sampling of a set of 10 bRo5 drugs and clinical candidates in polar and apolar environments. The distance-geometry based OMEGA was found to yield ensembles spanning larger structure and property spaces than the ensembles obtained by MOE-LowModeMD (MOE) and MacroModel (MC). Both MC and OMEGA but not MOE generated different ensembles for polar and apolar environments. All three conformational search methods generated conformers similar to the crystal structure conformers for 9 of the 10 compounds, with OMEGA performing somewhat better than MOE and MC. MOE and OMEGA found all six conformers of roxithromycin that were identified by NMR in aqueous solutions, whereas only OMEGA sampled the three conformers observed in chloroform. We suggest that characterization of conformers using molecular descriptors, e.g., the radius of gyration and polar surface area, is preferred to energy- or root-mean-square deviation-based methods for selection of biologically relevant conformers in drug discovery in bRo5 space.


Conflict of interest statement

The authors declare no competing financial interest.

Figures

Figure 1
Figure 1
Structures of erythronolides and HCV NS3/4A protease inhibitors used in this study. Important structural differences amongst the erythronolides are shown in pink. Peptide backbones are indicated in red for the protease inhibitors, nonpeptidic atoms forming part of the macrocycles are in blue.
Figure 2
Figure 2
Overlays of the different conformations found in the crystalline state of each erythronolide. Overlays were generated by alignment of the heavy atoms in the macrocyclic core only for each erythronolide. The color used for the protein data bank (PDB) and Cambridge Structural Database (CSD) codes match those of the carbon atoms in the corresponding structures.
Figure 3
Figure 3
MC, MOE, and OMEGA compared in terms of how accurately crystal structures are reproduced. (A) Accuracy in reproducing the crystal structure(s) of the 10 drugs and clinical candidates by the predicted minimum energy conformer (MEC) of each compound. (B) Accuracy in reproducing the crystal structure(s) by the conformer most similar to the crystal structure (the minimum RMSD conformer, MRC) for the 10 compounds. Both accuracies are given with RMSD cutoff of <2 and <4 Å for each of the three methods in apolar and polar environments, respectively. They were calculated from the data in Tables S1 and S2 in the Supporting Information.
Figure 4
Figure 4
Differences in (A) radius of gyration (Rgyr) and (B) polar surface area (PSA) plotted vs differences in RMSD for drugs and clinical candidates in the dataset that have three or more conformations. The crystal structure in which each of the five compounds adopts a conformation having the minimum Rgyr or 3D PSA, respectively, was chosen as reference. The reference value was then subtracted from the Rgyr and 3D PSA values, respectively, of the other conformations, and the differences were plotted vs the differences in RMSD.
Figure 5
Figure 5
Radius of gyration (Rgyr) calculated for the erythronolides and HCV NS3/4A protease inhibitors. For each compound, Rgyr has been calculated for the conformation(s) adopted in the crystal structures and for the conformational ensembles generated by MC (green), MOE (pink), and OMEGA (yellow) in apolar and polar environments. Rgyr was calculated using the MOE software. Box plots show minimum and maximum values as whiskers; the boxes span the 25th–75th percentile range, and the MECs are indicated as black circles. Figure S2 shows these data plotted with a fixed scale for Rgyr for all 10 compounds.
Figure 6
Figure 6
Polar surface area (PSA) calculated for the erythronolides and HCV NS3/4A protease inhibitors. For each compound, PSA has been calculated for the conformation(s) adopted in the crystal structures and for the conformational ensembles generated by MC (green), MOE (pink), and OMEGA (yellow) in apolar and polar environments. PSA was calculated on the basis of the surface area of the molecule that arises from oxygen and nitrogen atoms, plus their attached hydrogen atoms, using the Schrödinger software., Box plots show minimum and maximum values as whiskers; the boxes span the 25th–75th percentile range, and the MECs are indicated as black circles. Figure S3 shows these data plotted with a fixed scale for PSA for all 10 compounds.
Figure 7
Figure 7
Number of IMHBs in the crystal structures and in the conformational ensembles generated by MC (green), MOE (pink), and OMEGA (yellow) in apolar and polar environments for the erythronolides. IMHBs were calculated using the Schrödinger software., Box plots show minimum and maximum values as whiskers; the boxes span the 25th–75th percentile range, and the MECs are indicated as black circles.
Figure 8
Figure 8
Solution ensemble of roxithromycin in CDCl3, as determined by NAMFIS analysis, and comparison to one of the crystal structures of roxithromycin. (A) An overlay of the three conformations found in CDCl3 with the most populated one indicated in green (number 3). The conformation also found in D2O is indicated in blue (number 2). (B) Overlay of the most populated conformation (number 3, green) and the most similar crystal structure (CSD KAHWAT, orange); RMSD = 1.82 Å. Hydrogen bonds to the oxime side chain of roxithromycin are indicated by black dotted lines, whereas nonpolar hydrogen atoms have been omitted for clarity.
Figure 9
Figure 9
Solution ensemble of roxithromycin in D2O, as determined by NAMFIS analysis and comparisons to two of the crystal structures of roxithromycin. (A, B) Overlays of the six conformations found in D2O, with the most populated one in green (number 4). For clarity, conformation 4 has been compared to four of the conformations in (A) and to one of the most different ones in (B). (C) Overlay of the most populated conformation (number 4, green) and the most similar crystal structure (CSD FUXYOM, orange); RMSD = 2.93 Å. (D) Overlay of solution conformation 2, with the crystal structure (PDB 1JZZ, orange) that is most similar to any of the six solution conformations; RMSD = 2.02 Å. Hydrogen bonds to the oxime side chain of roxithromycin are indicated by black dotted lines in (C) and (D), and nonpolar hydrogen atoms have been omitted for clarity in (A)–(D).
Figure 10
Figure 10
Ability of conformations in the ensembles generated by MC, MOE, and OMEGA to reproduce the solution ensembles of roxithromycin in chloroform and water, as determined by NMR spectroscopy. Reproducibilities have been determined as the frequency of conformations found within an RMSD cutoff of <2 Å of each of the solution conformations. The population (in %) of each solution conformation, as determined by NMR spectroscopy, is stated below the number of the conformation.
Figure 11
Figure 11
Radius of gyration (Rgyr), polar surface area (PSA), and intramolecular hydrogen bonding (IMHB) for roxithromycin. The descriptors have been calculated for the conformations observed in the three crystal structures of roxithromycin, for the conformations adopted in apolar (CDCl3) and polar (D2O) solutions, as determined by NMR spectroscopy, and for the median conformations in the ensembles obtained by conformational sampling (CS) using MC (green), MOE (pink), and OMEGA (yellow) in apolar and polar environments. The population (in %) of each solution conformation, as determined by NMR spectroscopy, is stated adjacent to the corresponding descriptor values. The most populated conformations are indicated in red.

References

    1. Surade S.; Blundell T. L. Structural biology and drug discovery of difficult targets: the limits of ligandability. Chem. Biol. 2012, 19, 42–50. 10.1016/j.chembiol.2011.12.013. - DOI - PubMed
    1. Perola E.; Herman L.; Weiss J. Development of a rule-based method for the assessment of protein druggability. J. Chem. Inf. Model. 2012, 52, 1027–1038. 10.1021/ci200613b. - DOI - PubMed
    1. Hopkins A. L.; Groom C. R. The druggable genome. Nat. Rev. Drug Discovery 2002, 1, 727–730. 10.1038/nrd892. - DOI - PubMed
    1. Rask-Andersen M.; Masuram S.; Schiöth H. B. The druggable genome: evaluation of drug targets in clinical trials suggests major shifts in molecular class and indication. Annu. Rev. Pharmacol. Toxicol. 2014, 54, 9–26. 10.1146/annurev-pharmtox-011613-135943. - DOI - PubMed
    1. Giordanetto F.; Kihlberg J. Macrocyclic drugs and clinical candidates: what can medicinal chemists learn from their properties?. J. Med. Chem. 2014, 57, 278–295. 10.1021/jm400887j. - DOI - PubMed