. 2018 Oct 1;2(4):481-512.
doi: 10.1162/netn_a_00046. eCollection 2018.

Variability and stability of large-scale cortical oscillation patterns

Affiliations

Variability and stability of large-scale cortical oscillation patterns

Roy Cox et al. Netw Neurosci. .

Abstract

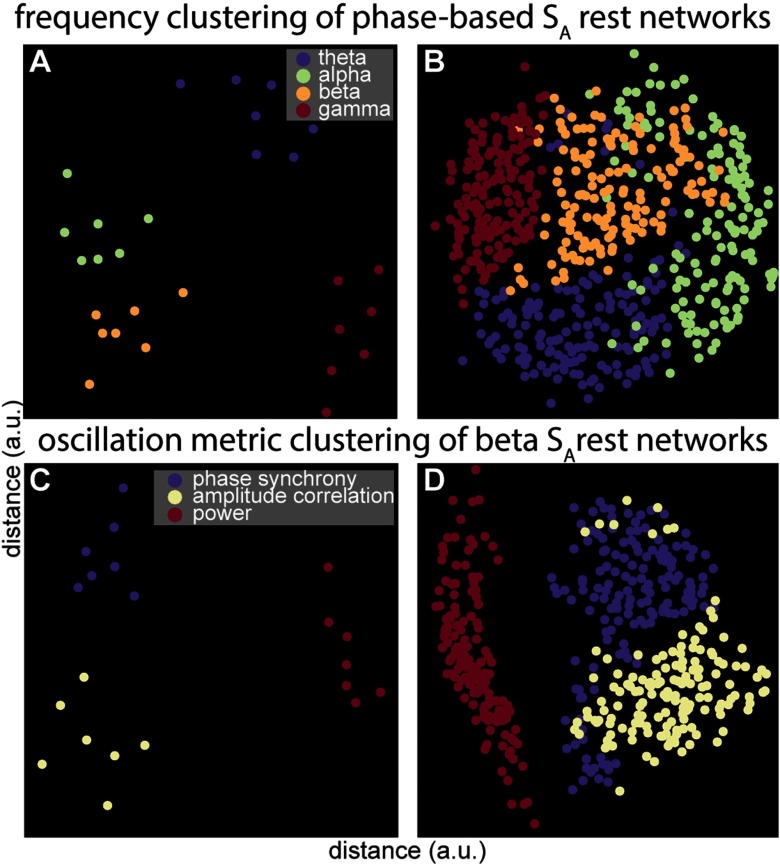
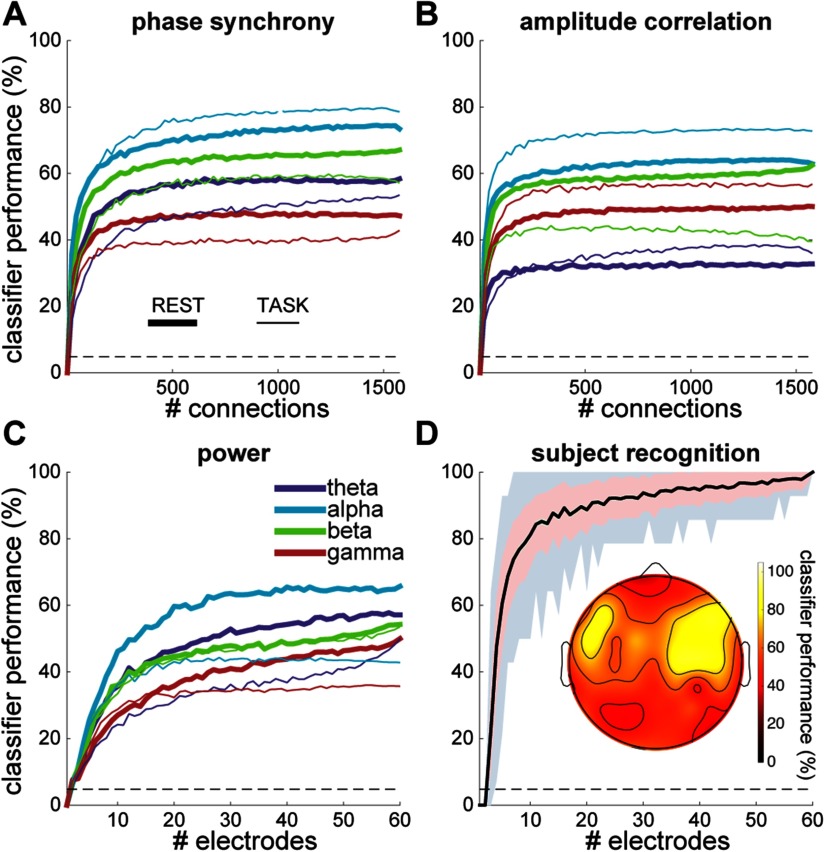
Individual differences in brain organization exist at many spatiotemporal scales and underlie the diversity of human thought and behavior. Oscillatory neural activity is crucial for these processes, but how such rhythms are expressed across the cortex within and across individuals is poorly understood. We conducted a systematic characterization of brain-wide activity across frequency bands and oscillatory features during rest and task execution. We found that oscillatory profiles exhibit sizable group-level similarities, indicating the presence of common templates of oscillatory organization. Nonetheless, well-defined subject-specific network profiles were discernible beyond the structure shared across individuals. These individualized patterns were sufficiently stable to recognize individuals several months later. Moreover, network structure of rhythmic activity varied considerably across distinct oscillatory frequencies and features, indicating the existence of several parallel information processing streams embedded in distributed electrophysiological activity. These findings suggest that network similarity analyses may be useful for understanding the role of large-scale brain oscillations in physiology and behavior.

Keywords: EEG; Functional connectivity; Individual differences; Networks; Oscillations.


Conflict of interest statement

Competing Interests: The authors have declared that no competing interests exist.

Figures

Figure 1.
Figure 1.. Protocol overview. SA and SB were separated by 2 hr, whereas SC took place after 3–8 months. In SA, encoding and recall blocks were separated by rest periods. In SB, additional recall blocks were interspersed with rest. Finally, in SC, subjects completed an additional memory task as well as a viewing control task with no memory component. EEG from rest and task blocks (solid boxes), but not recall blocks (dashed), was analyzed. During encoding, 36 stimuli were presented, one at a time, at unique grid locations. During retrieval, subjects were cued by presentation of a learned stimulus to the right of the grid, and attempted to identify its previous grid location.
Figure 2.
Figure 2.. Connectivity maps of phase-based alpha networks. Absolute phase synchrony in the alpha band for three example subjects (rows), during three rest and three task segments across SA and SC (columns). Strength of connectivity is indicated by both line thickness and color, with stronger connections in white/yellow, and weaker connections in orange/black. For visualization purposes, only connections between the median + 2 SD and maximum connection strength are shown for each map (range indicated on color bar). White dashed circles indicate networks used to illustrate network similarity in Figure 3A–C.
Figure 3.
Figure 3.. Similarity of phase-based alpha networks. Example scatterplots show network similarity between (A) a single subject’s restA1 and restA2 segments; (B) the same subject’s restA1 and taskA1 segments; and (C) restA1 from the same subject and the corresponding restA1 of a second subject (selected networks indicated in Figure 2 with dashed circles). Every dot denotes the connection strength between a pair of electrodes (1,578 in total) for two separate data segments: the Pearson correlation coefficient (R) constitutes the degree of network similarity. Axes indicate z-scored connectivity strength, and blue lines reflect least-squares fit. Note that as a result of the large number of network elements even modest associations have very low p values. (D) Single-subject network similarity matrix of all 20 data segments. Small green and red squares reflect network comparisons of panels A and B, respectively. Large black squares indicate similarity of within-session rest or task networks. Large blue square indicates similarity within SA, which is further illustrated in (E), which contains the 7 rest and 2 task SA segments for all subjects. Clearly visible is the diagonal band showing high within-subject similarity. The off-diagonal pattern demonstrates the generally much greater between-subject similarity of rest-rest and task-task networks compared with rest-task networks. Specifically, the larger red/orange squares indicate relatively enhanced between-subject similarity of rest networks, whereas darker bands signify reduced rest-task similarity. Very small red squares positioned on intersecting dark bands indicate increased task-task similarity. For both D and E, diagonal elements (indicating self-similarity) were set to zero.
Figure 4.
Figure 4.. Within-subject similarity of rest and task segments in SA. (Top) Similarity (Pearson’s R) of rest segment networks based on amplitude correlation in the beta band. (A) Observed within-subject similarity values (orange bars) are much higher than for the null distribution generated by resampling across subjects (1,000 permutations; dashed red line: mean of null distribution; dotted black line: maximum value in distribution). (B) Multidimensional scaling plot shows similarity between networks for same network type as in A as distances between dots, using the correlation distance (1–R) as the distance metric. Each color represents a single individual. Dots of the same color are generally clustered together, reflecting high intraindividual network similarity. For visualization purposes only 6 subjects are plotted, although clustering is equally present when including all 21 subjects. (Bottom) Similarity between task and rest segments for theta phase synchrony networks. Each subject’s similarity score across behavioral states was compared with its own null distribution (created by assessing network similarity between that subject’s task segments and rest segments randomly selected from the entire population). Distributions for two subjects (C and D) show much higher within-subject similarity between rest and task structure (orange bars) than expected by chance (1,000 permutations). (E) Distance plot for rest-task similarity, as presented in C and D. Smaller dots indicate rest networks (as above) and larger dots signify task networks. For several subjects, their two task segments are close to their seven rest segments, indicating a close correspondence between network structures across behavioral states. At the same time, task networks from different subjects tend to cluster together to the right of the plot, suggesting group-level differences between task and rest networks. Again, only six subjects are plotted for visualization purposes.
Figure 5.
Figure 5.. Frequency- and oscillation metric-specific clustering of SA resting-state networks. Single-subject-level (A) and group-level (B) frequency clustering of phase-based networks indicating greater similarity of within-frequency than between-frequency oscillatory profiles. Single-subject-level (C) and group-level (D) oscillation metric clustering in the beta range. Note how power topographies are distinctly different from both phase- and amplitude-based network profiles.
Figure 6.
Figure 6.. Data segment classification and subject recognition accuracy as a function of number of included connections and electrodes. Percentage of data segments accurately classified as a function of number of included connections for rest and task segments in different frequency bands, for phase synchrony (A) and amplitude correlation (B). For visualization purposes, A and B data were smoothed with a moving average window of size 11 and downsampled by a factor 21. Dashed gray lines indicate chance level performance. (C) Similar to A and B for power as a function of number of included electrodes. (D) Subject recognition as a function of electrode array size (electrodes plus connections among them), including all oscillation metrics, frequency bands, and behavioral states. Black line indicates average, pink shading standard deviation, and gray shading range of minimum and maximum values across 100 iterations. Inset: topographical map displaying subject recognition for searchlight analysis.

Similar articles

Cited by

References

    1. Ainsworth M., Lee S., Cunningham M. O., Traub R. D., Kopell N. J., & Whittington M. A. (2012). Rates and rhythms: A synergistic view of frequency and temporal coding in neuronal networks. Neuron, 75(4), 572–583. 10.1016/j.neuron.2012.08.004 - DOI - PubMed
    1. Akam T., & Kullmann D. M. (2014). Oscillatory multiplexing of population codes for selective communication in the mammalian brain. Nature Reviews Neuroscience, 15(2), 111–122. 10.1038/nrn3668 - DOI - PMC - PubMed
    1. Arnulfo G., Hirvonen J., Nobili L., Palva S., & Palva J. M. (2015). Phase and amplitude correlations in resting-state activity in human stereotactical EEG recordings. NeuroImage, 112, 114–127. 10.1016/j.neuroimage.2015.02.031 - DOI - PubMed
    1. Aru J., Aru J., Priesemann V., Wibral M., Lana L., Pipa G., … Vicente R. (2014). Untangling cross-frequency coupling in neuroscience. Current Opinion in Neurobiology, 31, 51–61. 10.1016/j.conb.2014.08.002 - DOI - PubMed
    1. Baker A. P., Brookes M. J., Rezek I. A., Smith S. M., Behrens T., Smith P. J. P., & Woolrich M. (2014). Fast transient networks in spontaneous human brain activity. eLife, 2014(3), 1–18. 10.7554/eLife.01867 - DOI - PMC - PubMed

LinkOut - more resources