

STI Risk Perception in the British Population and How It Relates to Sexual Behaviour and STI Healthcare Use: Findings From a Cross-sectional Survey (Natsal-3)
- PMID: 30320305
- PMCID: PMC6180228
- DOI: 10.1016/j.eclinm.2018.08.001
STI Risk Perception in the British Population and How It Relates to Sexual Behaviour and STI Healthcare Use: Findings From a Cross-sectional Survey (Natsal-3)
Abstract
Background: We investigated how STI risk perception relates to behavioural STI risk and STI healthcare (sexual health clinic attendance/chlamydia testing) in the British population.
Methods: Natsal-3, a national probability-sample survey undertaken 2010-12, included 8397 sexually-active 16-44 year-olds. Participants rated their risk of STIs (excluding HIV) given their current sexual lifestyle. Urine from a randomly-selected sub-sample of participants (n = 4550) was tested for prevalent STIs (Chlamydia trachomatis, Neisseria gonorrhoeae, Mycoplasma genitalium, Trichomonas vaginalis).
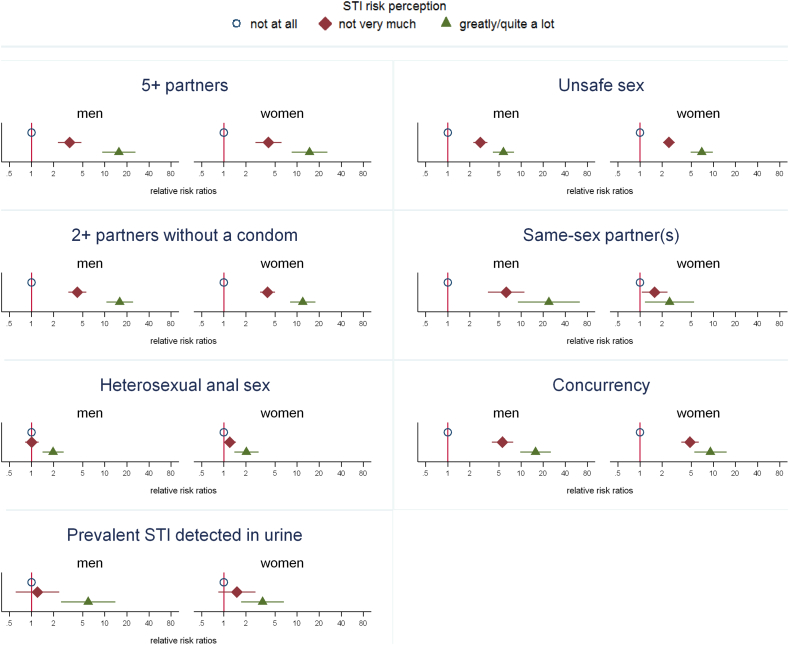
Findings: Most men (64% (95% CI: 62-66)) and women (73% (72-74)) rated themselves as not at all at risk of STIs, 30% (29-32) men and 23% (22-25) women self-rated as not very much, and 5% (5-6) men and 3% (3-4) women as greatly/quite a lot at risk. Although those reporting STI risk behaviours were more likely to perceive themselves as at risk, > 70% men and > 85% women classified as having had unsafe sex in the past year, and similar proportions of those with a prevalent STI, perceived themselves as not at all or not very much at risk. Increased risk perception was associated with greater STI healthcare-use (past year), although not after adjusting for sexual behaviour, indicating in a mediation analysis that risk perception was neither necessary or sufficient for seeking care Furthermore, 58% (48-67) men and 31% (22-41) women who had unsafe sex (past year) and rated themselves as greatly/quite a lot at risk had neither attended nor tested.
Interpretation: Many people at risk of STIs in Britain underestimated their risk, and many who correctly perceived themselves to be at risk had not recently accessed STI healthcare. Health promotion needs to address this mismatch and ensure that people access healthcare appropriate to their needs.
Figures
Similar articles
-
[Investigation of the Frequency of Neisseria gonorrhoeae, Chlamydia trachomatis, Trichomonas vaginalis and Mycoplasma genitalium in Men Living with HIV in Terms of Sociodemographic Characteristics and Behavioral Risk Factors].Mikrobiyol Bul. 2023 Jul;57(3):378-389. doi: 10.5578/mb.20239931. Mikrobiyol Bul. 2023. PMID: 37462302 Turkish.
-
Prevalence, risk factors, and uptake of interventions for sexually transmitted infections in Britain: findings from the National Surveys of Sexual Attitudes and Lifestyles (Natsal).Lancet. 2013 Nov 30;382(9907):1795-806. doi: 10.1016/S0140-6736(13)61947-9. Epub 2013 Nov 26. Lancet. 2013. PMID: 24286785 Free PMC article.
-
Sexual health clinic attendance and non-attendance in Britain: findings from the third National Survey of Sexual Attitudes and Lifestyles (Natsal-3).Sex Transm Infect. 2018 Jun;94(4):268-276. doi: 10.1136/sextrans-2017-053193. Epub 2017 Sep 29. Sex Transm Infect. 2018. PMID: 28974552 Free PMC article.
-
Examining the potential public health benefit of offering STI testing to men in amateur football clubs: evidence from cross-sectional surveys.BMC Public Health. 2015 Jul 17;15:676. doi: 10.1186/s12889-015-1951-7. BMC Public Health. 2015. PMID: 26184413 Free PMC article.
-
The Ballseye programme: a mixed-methods programme of research in traditional sexual health and alternative community settings to improve the sexual health of men in the UK.Southampton (UK): NIHR Journals Library; 2016 Dec. Southampton (UK): NIHR Journals Library; 2016 Dec. PMID: 27997089 Free Books & Documents. Review.
Cited by
-
Distance as explanatory factor for sexual health centre utilization: an urban population-based study in the Netherlands.Eur J Public Health. 2021 Dec 1;31(6):1241-1248. doi: 10.1093/eurpub/ckab177. Eur J Public Health. 2021. PMID: 34590688 Free PMC article.
-
Significant Associations between Chlamydia trachomatis and Neisseria gonorrhoeae Infections in Human Immunodeficiency Virus-Infected Pregnant Women.Infect Dis Obstet Gynecol. 2022 Jun 17;2022:7930567. doi: 10.1155/2022/7930567. eCollection 2022. Infect Dis Obstet Gynecol. 2022. PMID: 35754526 Free PMC article.
-
Web-Based Risk Prediction Tool for an Individual's Risk of HIV and Sexually Transmitted Infections Using Machine Learning Algorithms: Development and External Validation Study.J Med Internet Res. 2022 Aug 25;24(8):e37850. doi: 10.2196/37850. J Med Internet Res. 2022. PMID: 36006685 Free PMC article.
-
Correlates of time to clinical presentation for symptomatic individuals with gonorrhoea in South China: results from a cross-sectional study.BMJ Open. 2022 Mar 4;12(3):e052586. doi: 10.1136/bmjopen-2021-052586. BMJ Open. 2022. PMID: 35246417 Free PMC article.
-
Help-seeking for genitourinary symptoms: a mixed methods study from Britain's Third National Survey of Sexual Attitudes and Lifestyles (Natsal-3).BMJ Open. 2019 Oct 30;9(10):e030612. doi: 10.1136/bmjopen-2019-030612. BMJ Open. 2019. PMID: 31666264 Free PMC article.
References
-
- Nutbeam D., Harries E., Wise M. 3rd edition. McGraw-Hill; North Ryde: 2010. Theory in a nutshell: a practical guide to health promotion theories.http://www.mheducation.co.uk/9780070278431-emea-theory-in-a-nutshell-a-p... Available from:
-
- Ropeik D. The Perception Gap: recognizing and managing the risks that arise when we get risk wrong. Food Chem Toxicol. 2012;50:1222–1225. - PubMed
-
- Bouyer M., Bagdassarian S., Chaabanne S., Mullet E. Personality correlates of risk perception. Risk Anal. 2001;21:457–466. - PubMed
-
- Buck R., Ferrer R. Emotion, warnings, and the ethics of risk communication. In: Roeser S., Hillerbrand P., Peterson M., editors. Handbook of risk theory. Delft; The Netherlands: 2012.
-
- Ropeik D. Risk Communication: an overlooked tool for improving public health. In: Last J., Wallace R., editors. Public health and preventative medicine. 2007. http://www.dropeik.com/dropeik/pdf/text_book_chapter.pdf Available from:
Grants and funding
LinkOut - more resources
Full Text Sources
Miscellaneous
