. 2019 Jan;41(1):27-42.
doi: 10.3892/or.2018.6780. Epub 2018 Oct 9.

Antitumor effects of arsenic disulfide on the viability, migratory ability, apoptosis and autophagy of breast cancer cells

Affiliations

Antitumor effects of arsenic disulfide on the viability, migratory ability, apoptosis and autophagy of breast cancer cells

Yuxue Zhao et al. Oncol Rep. 2019 Jan.

Erratum in

Abstract

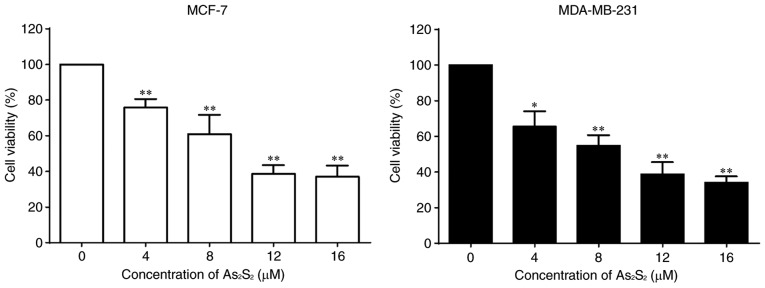
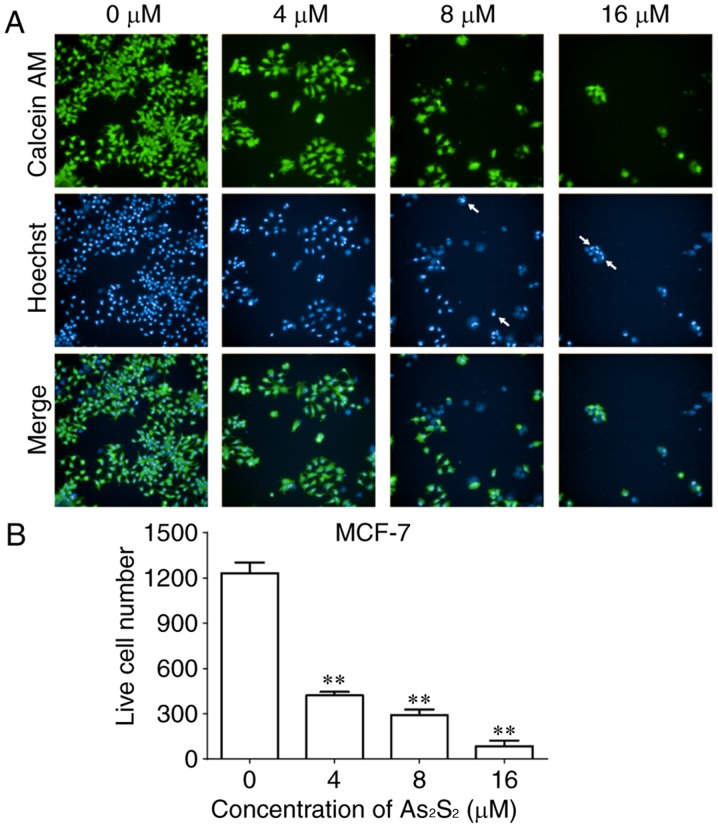
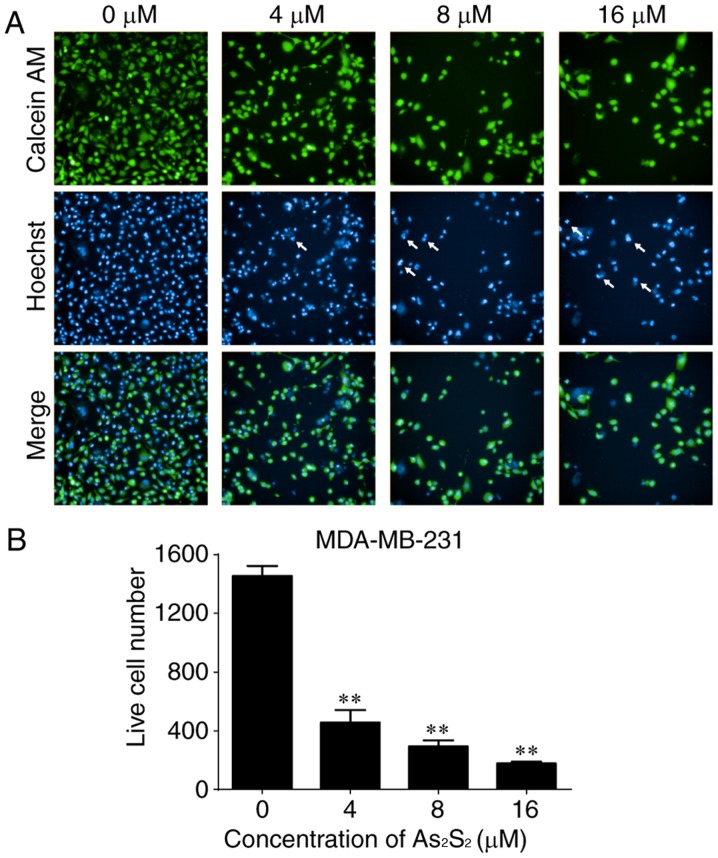
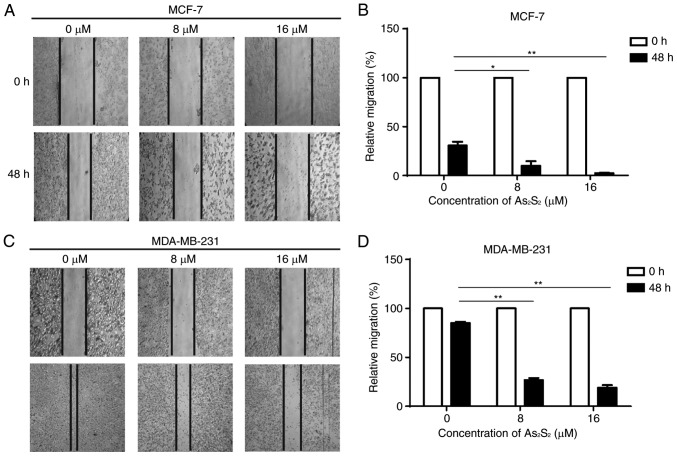
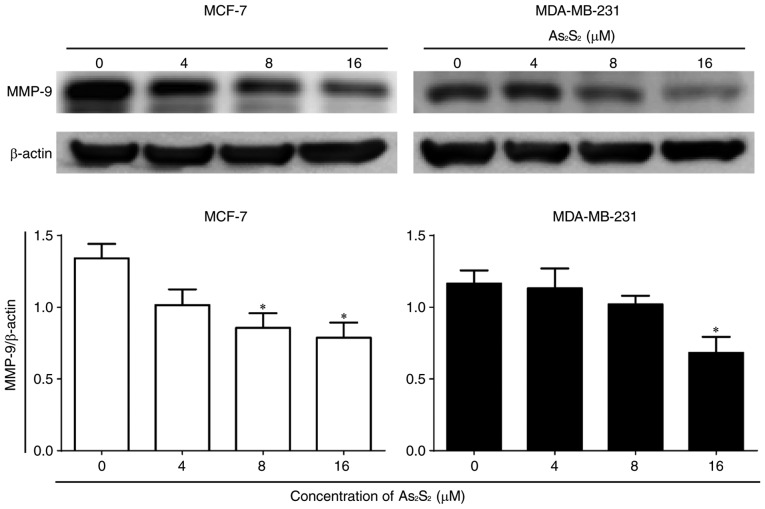
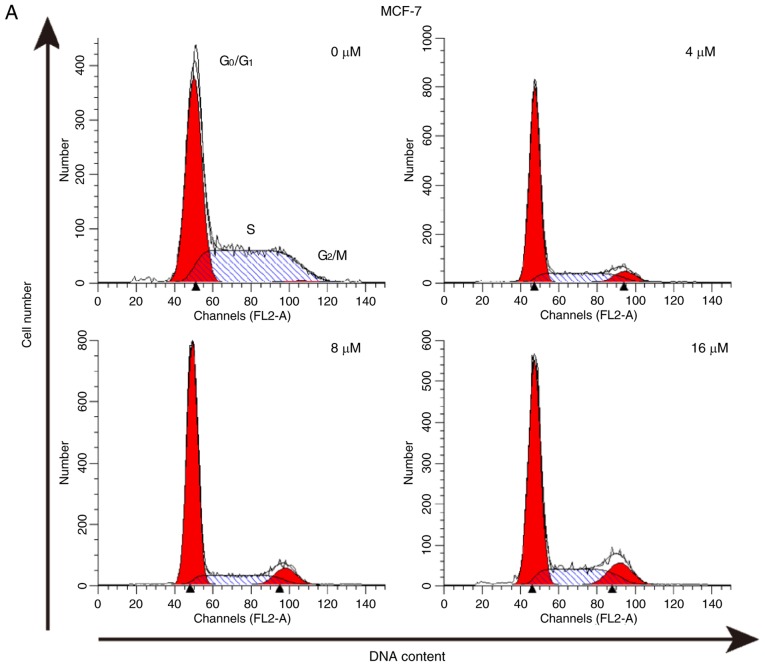
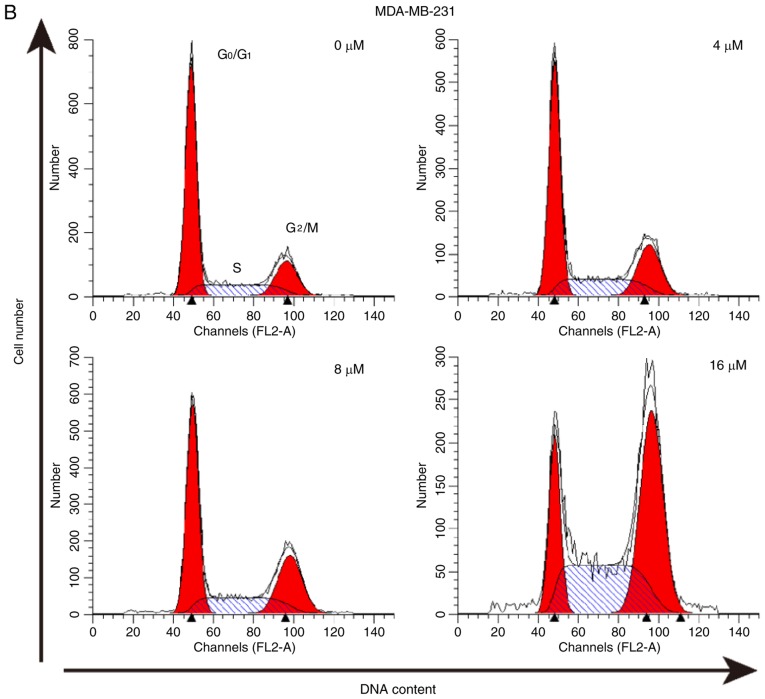
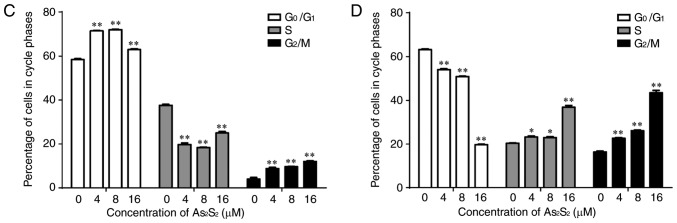
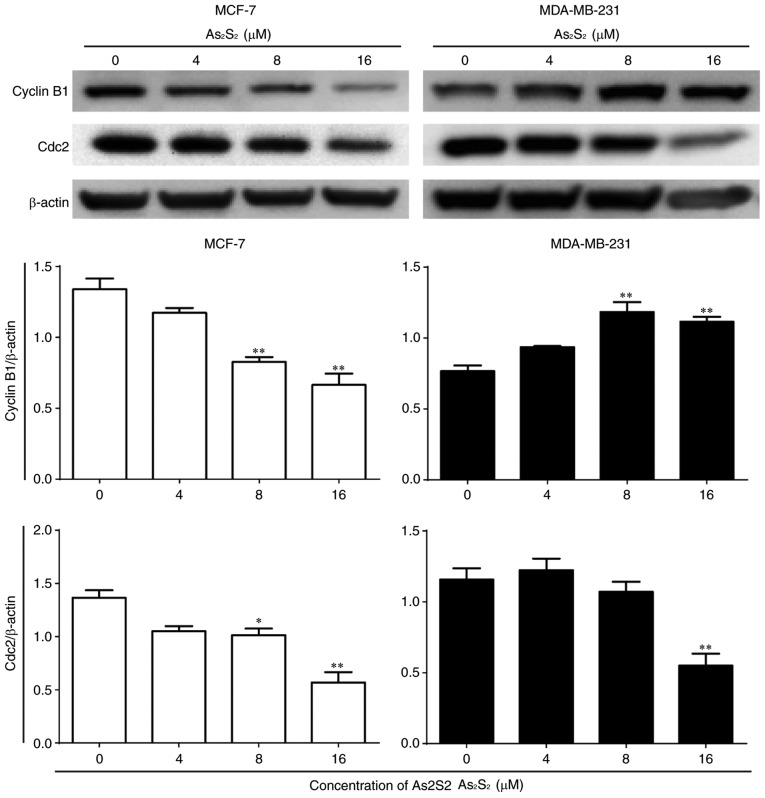
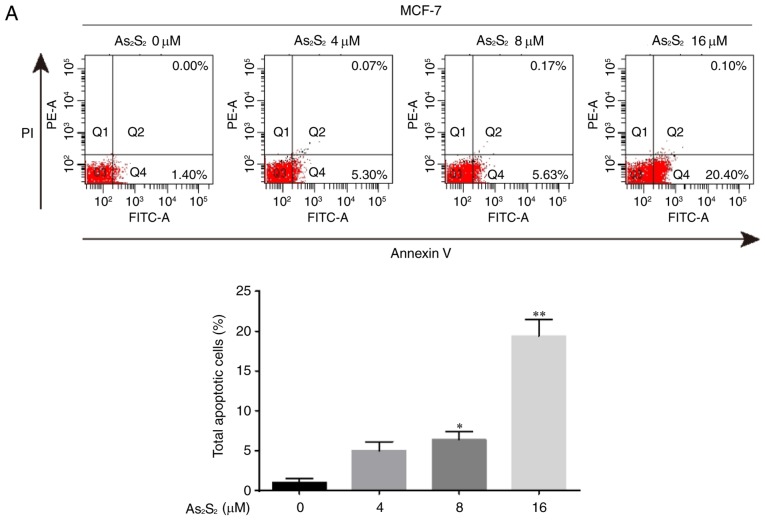
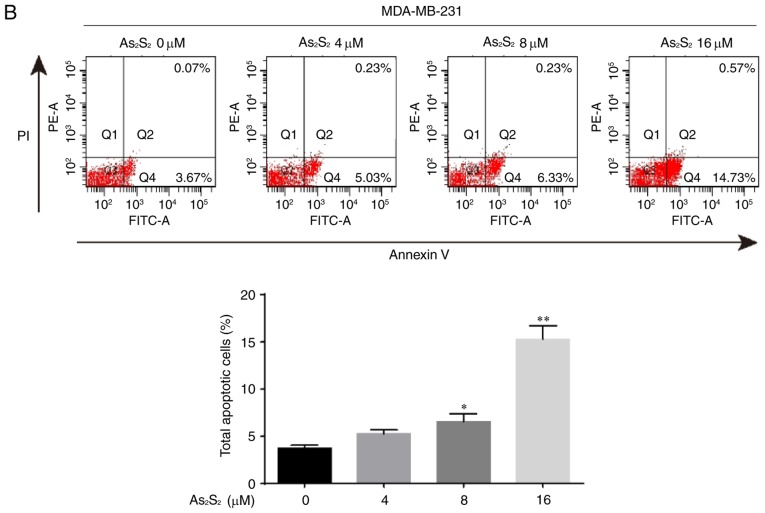
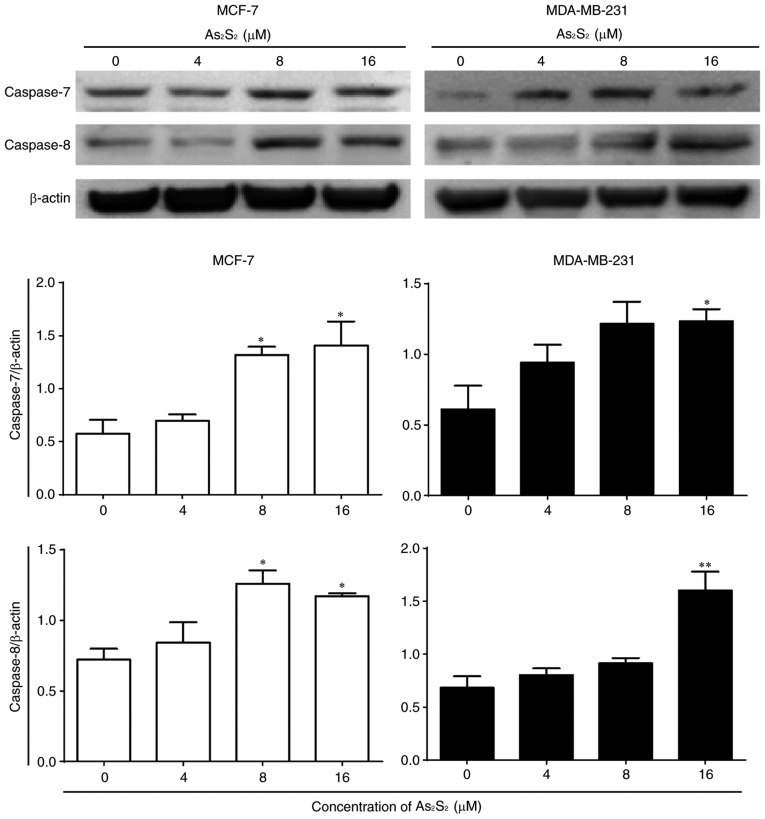
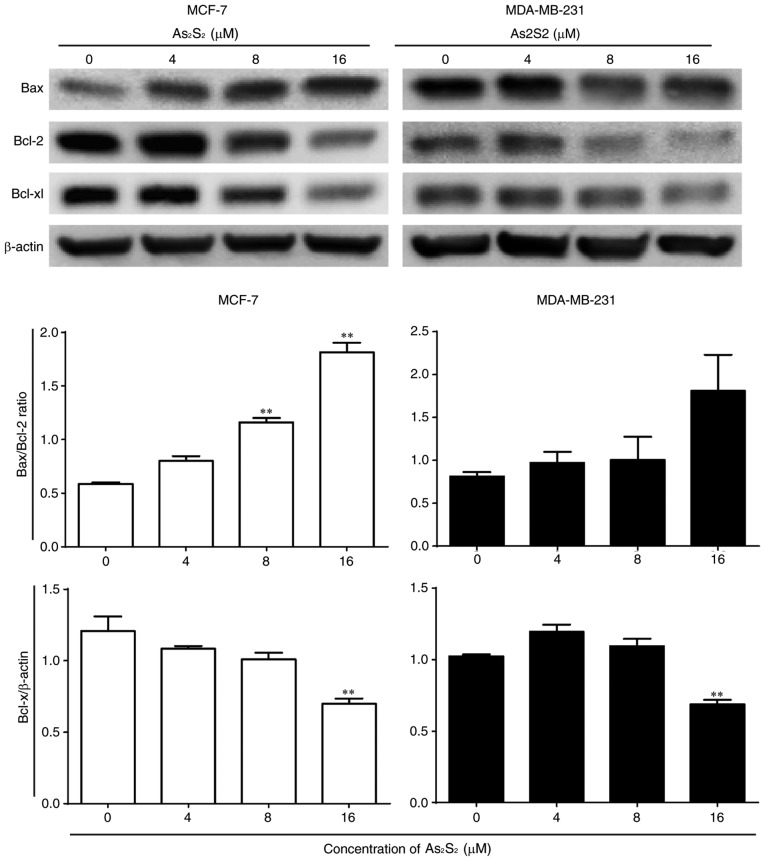
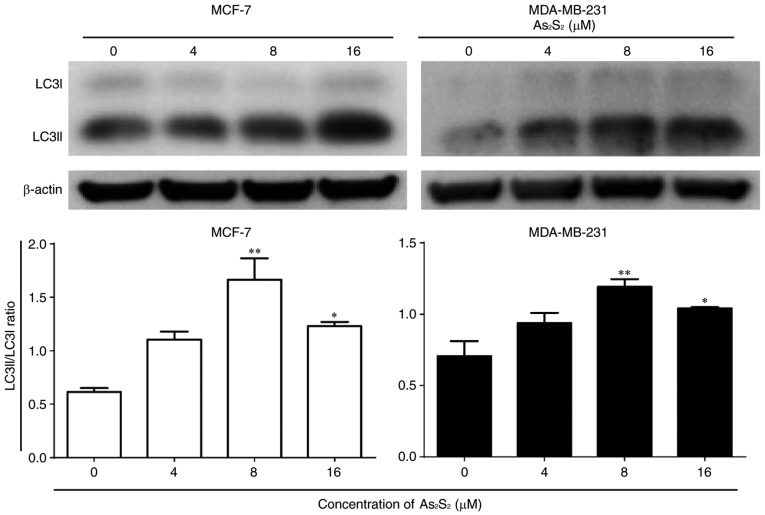
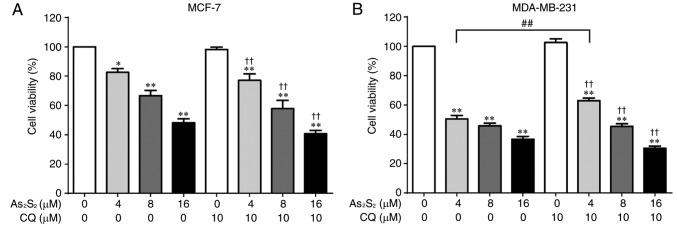
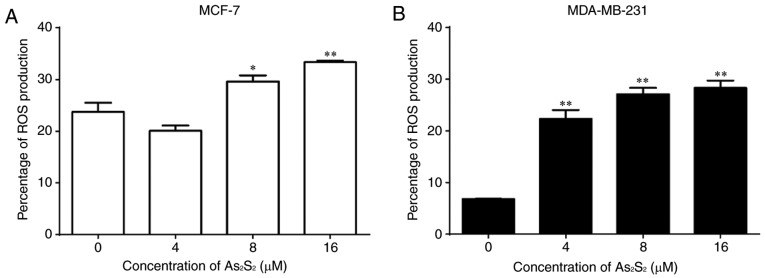
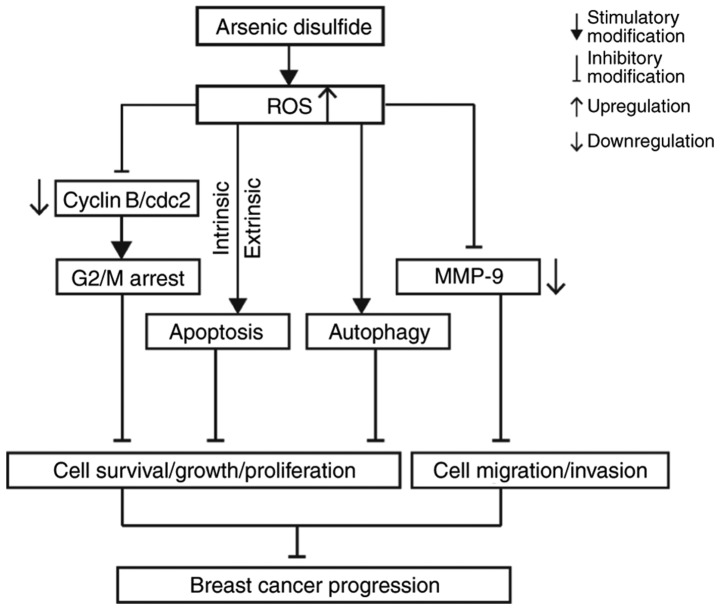
In the present study, the antitumor effects of arsenic disulfide (As2S2) on the proliferative, survival and migratory ability of human breast cancer MCF‑7 and MDA‑MB‑231 cells were investigated, and its potential underlying molecular mechanisms with an emphasis on cell cycle arrest, apoptosis induction, autophagy induction and reactive oxygen species (ROS) generation were determined. The results indicated that As2S2 significantly inhibited the viability, survival and migration of breast cancer cells in a dose‑dependent manner. In addition, it was identified that As2S2 induced cell cycle arrest primarily at G2/M phase in the two breast cancer cell lines by regulating the expression of associated proteins, including cyclin B1 and cell division cycle protein 2. In addition to cell cycle arrest, As2S2 also triggered the induction of apoptosis in cells by activating the expression of pro‑apoptotic proteins, including caspase‑7 and ‑8, as well as increasing the B‑cell lymphoma 2 (Bcl‑2)‑associated X protein/Bcl‑2 ratio, while decreasing the protein expression of anti‑apoptotic B‑cell lymphoma extra‑large. In addition, As2S2 stimulated the accumulation of microtubule‑associated protein 1A/1B‑light chain 3 (LC3)‑II and increased the LC3‑II/LC3‑I ratio, indicating the occurrence of autophagy. As2S2 treatment also inhibited the protein expression of matrix metalloproteinase‑9 (MMP‑9), but increased the intracellular accumulation of ROS in the two breast cancer cell lines, which may assist in alleviating metastasis and attenuating the progression of breast cancer. Taken together, the results of the present study suggest that As2S2 inhibits the progression of human breast cancer cells through the regulation of cell cycle arrest, intrinsic and extrinsic apoptosis, autophagy, MMP‑9 signaling and ROS generation.


Figures

Figure 1.
Figure 1.
As2S2 inhibits the viability of breast cancer cells. MCF-7 and MDA-MB-231 cells were treated with various concentrations (0, 4, 8, 12 and 16 µM) of As2S2 for 48 h, and the cell viability was determined using Cell Counting Kit-8 assays. Results are presented as the mean ± standard error of the mean (n≥3). *P<0.05, **P<0.01 vs. control group (0 µM As2S2).
Figure 2.
Figure 2.
As2S2 induces changes in calcein-AM and Hoechst 33342 staining in MCF-7 cells. MCF-7 cells were seeded at 5,000 cells/well. The cells were treated with serial concentrations of As2S2 (0, 4, 8 and 16 µM) for 48 h. (A) Viable cells exposed to calcein-AM exhibited bright green fluorescence. Hoechst 33342 staining, as a nuclear counterstain, exhibited bright blue fluorescence. Cells with bright fragmented or condensed nuclei (arrows) were identified as those undergoing apoptosis. Merging of calcein-AM- and Hoechst 33342-stained cells exhibited cyan fluorescence. Images were captured and analyzed using a fluorescence microplate reader with a ×20 objective (original magnification, ×200). (B) Quantitative analysis of live MCF-7 cells. Results are presented as the mean ± standard error of the mean (n≥3). **P<0.01 vs. control group (0 µM As2S2). AM, acetoxymethyl ester.
Figure 3.
Figure 3.
As2S2 induces changes in calcein-AM and Hoechst 33342 staining in MDA-MB-231 cells. MDA-MB-231 cells were seeded at 5,000 cells/well. The cells were treated with serial concentrations of As2S2 (0, 4, 8 and 16 µM) for 48 h. (A) Viable cells exposed to calcein-AM exhibited bright green fluorescence. Hoechst 33342 staining as a nuclear counterstain exhibited bright blue fluorescence. Cells with bright fragmented or condensed nuclei (arrows) were identified as those undergoing apoptosis. Merging of calcein-AM- and Hoechst 33332-stained cells exhibited cyan fluorescence. Images were captured and analyzed using a fluorescence microplate reader with a ×20 objective (original magnification, ×200). (B) Quantitative analysis of live MDA-MB-231 cells. Results are presented as the mean ± standard error of the mean (n≥3). **P<0.01 vs. control group (0 µM As2S2). AM, acetoxymethyl ester.
Figure 4.
Figure 4.
Inhibitory effects of As2S2 on the migration of MCF-7 and MDA-MB-231 cells determined using a wound healing assay. MCF-7 and MDA-MB-231 cells were treated with various concentrations (0, 8 and 16 µM) of As2S2 for 48 h, and then the wound areas were observed. (A) Representative images of wounded MCF-7 cells (magnification, ×100). (B) Quantification of relative migration of MCF-7 cells. (C) Representative images of wounded MDA-MB-341 cells (magnification, ×100). (D) Quantification of relative migration of MDA-MB-341 cells. Results are presented as the mean ± standard error of the mean (n≥3). *P<0.05, **P<0.01 vs. control (0 µM As2S2).
Figure 5.
Figure 5.
Effects of As2S2 on the protein expression of MMP-9 in breast cancer cells. MCF-7 and MDA-MB-231 cells were treated with different concentrations of As2S2 (0, 4, 8 and 16 µM) for 48 h. Western blot assays were performed to examine the effects of As2S2 on the expression of MMP-9 in the two cell lines after 48 h of treatment. β-actin was used as an internal control. All images are representative of three independent analyses from three independent cellular preparations. *P<0.05 vs. control (0 µM As2S2).
Figure 6.
Figure 6.
As2S2 triggers cell cycle arrest in breast cancer cells. (A) MCF-7 and (B) MDA-MB-231 cells were treated with various concentrations of As2S2 (0, 4, 8 and 16 µM) for 48 h. The peaks represent G0/G1, S and G2/M phases in the cell cycle. Quantification of the proportions of cells in a given phase of the cell cycle in (C) MCF-7 and (D) MDA-MB-231 cells after 48 h of treatment. Results are expressed as the mean ± standard error of the mean (n≥3). *P<0.05, **P<0.01 vs. control (0 µM As2S2).
Figure 6.
Figure 6.
As2S2 triggers cell cycle arrest in breast cancer cells. (A) MCF-7 and (B) MDA-MB-231 cells were treated with various concentrations of As2S2 (0, 4, 8 and 16 µM) for 48 h. The peaks represent G0/G1, S and G2/M phases in the cell cycle. Quantification of the proportions of cells in a given phase of the cell cycle in (C) MCF-7 and (D) MDA-MB-231 cells after 48 h of treatment. Results are expressed as the mean ± standard error of the mean (n≥3). *P<0.05, **P<0.01 vs. control (0 µM As2S2).
Figure 7.
Figure 7.
Effects of As2S2 on cell cycle regulators in breast cancer cells. MCF-7 and MDA-MB-231 cells were cultured with various concentrations of As2S2 (0, 4, 8 and 16 µM) for 48 h, and western blot assays were performed to examine the effects of As2S2 on the expression of the key proteins cyclin B1 and Cdc2 in the two cell lines after 48 h of treatment. β-actin was used as an internal control. All images are representative of three independent analyses from three independent cellular preparations. *P<0.05, **P<0.01 vs. control (0 µM As2S2).
Figure 8.
Figure 8.
As2S2 induces apoptosis in breast cancer cells. (A) MCF-7 and (B) MDA-MB-231 cells were treated with different concentrations of As2S2 (0, 4, 8 and 16 µM) for 48 h, followed by staining with Annexin V/PI, and then analyzed by flow cytometry. The cells were assessed for the total number of apoptotic cells, including early-apoptotic (Annexin V+/PI) and late-apoptotic (Annexin V+/PI+) cells. Results are expressed as the mean ± standard error of the mean (n≥3). *P<0.05, **P<0.01 vs. control (0 µM As2S2). PI, propidium iodide; PE, phycoerythrin.
Figure 8.
Figure 8.
As2S2 induces apoptosis in breast cancer cells. (A) MCF-7 and (B) MDA-MB-231 cells were treated with different concentrations of As2S2 (0, 4, 8 and 16 µM) for 48 h, followed by staining with Annexin V/PI, and then analyzed by flow cytometry. The cells were assessed for the total number of apoptotic cells, including early-apoptotic (Annexin V+/PI) and late-apoptotic (Annexin V+/PI+) cells. Results are expressed as the mean ± standard error of the mean (n≥3). *P<0.05, **P<0.01 vs. control (0 µM As2S2). PI, propidium iodide; PE, phycoerythrin.
Figure 9.
Figure 9.
Effects of As2S2 on the protein expression of caspase in breast cancer cells. MCF-7 and MDA-MB-231 cells were treated with different concentrations of As2S2 (0, 4, 8 and 16 µM) for 48 h. Western blot assays were performed to examine the effects of As2S2 on the expression of caspase-7 and −8 in the two cell lines after 48 h of treatment. β-actin was used as an internal control. All images are representative of three independent analyses from three independent cellular preparations. *P<0.05, **P<0.01 vs. control (0 µM As2S2).
Figure 10.
Figure 10.
Effects of As2S2 on the expression of Bcl-2 family proteins in breast cancer cells. MCF-7 and MDA-MB-231 cells were treated with different concentrations of As2S2 (0, 4, 8 and 16 µM) for 48 h. Western blot assays were performed to determine the effects of As2S2 on the expression of Bax, Bcl-2 and Bcl-xl in the two cell lines after 48 h of treatment. β-actin was used as an internal control. All images are representative of three independent analyses from three independent cellular preparations. **P<0.01 vs. control (0 µM As2S2). Bcl-2, B-cell lymphoma 2; Bax, Bcl-2-associated X protein; Bcl-xl, B-cell lymphoma extra-large.
Figure 11.
Figure 11.
Effects of As2S2 on the expression of autophagy hallmarks in breast cancer cells. MCF-7 cells were treated with different concentrations of As2S2 (0, 4, 8 and 16 µM) for 48 h. Western blot assays were performed to examine the effects of As2S2 on the expression of the autophagy markers LC3-I and LC3-II in the two cell lines after 48 h of treatment. The ratio of LC3-II to LC3-I was calculated to determine the autophagic level. β-actin was used as an internal control. All images are representative of three independent analyses from three independent cellular preparations. *P<0.05, **P<0.01 vs. control (0 µM As2S2). LC3, microtubule-associated protein 1A/1B-light chain 3.
Figure 12.
Figure 12.
Cell viability in breast cancer cells following autophagy inhibition and As2S2 treatment. (A) MCF-7 and (B) MDA-MB-231 cells were pretreated with 10 µM CQ for 1 h before treatment with various concentrations (0, 4, 8 and 16 µM) of As2S2 for 48 h. Cell viability was determined using Cell Counting Kit-8 assays. Results are presented as the mean ± standard error of the mean (n≥3). *P<0.05, **P<0.01 vs. control (0 µM As2S2 and 0 µM CQ); ††P<0.01 vs. control (0 µM As2S2 and 10 µM CQ); ##P<0.01 vs. respective As2S2 treatment groups in the absence of CQ. CQ, chloroquine diphosphate.
Figure 13.
Figure 13.
Effects of As2S2 on ROS production in breast cancer cells. (A) MCF-7 and (B) MDA-MB-231 cells were treated with different concentrations of As2S2 (0, 4, 8 and 16 µM) for 48 h. Intracellular ROS levels were analyzed using the ROS-responsive dye 2′,7′-dichlorofluorescin diacetate followed by a flow cytometric assay. Results are presented as the mean ± standard error of the mean (n≥3). *P<0.05, **P<0.01 vs. control (0 µM As2S2).
Figure 14.
Figure 14.
Schematic diagram of the potential molecular mechanisms underlying As2S2-hampered carcinoma progression in MCF-7 and MDA-MB-231 cells. ROS, reactive oxygen species; MMP-9, matrix metalloproteinase 9; cdc2, cell division cycle 2.

Similar articles

Cited by

References

    1. Wang H, Liu Z, Gou Y, Qin Y, Xu Y, Liu J, Wu JZ. Apoptosis and necrosis induced by novel realgar quantum dots in human endometrial cancer cells via endoplasmic reticulum stress signaling pathway. Int J Nanomedicine. 2015;10:5505–5512. doi: 10.2147/IJN.S83838. - DOI - PMC - PubMed
    1. Wang L, Zhou GB, Liu P, Song JH, Liang Y, Yan XJ, Xu F, Wang BS, Mao JH, Shen ZX, et al. Dissection of mechanisms of Chinese medicinal formula Realgar-Indigo naturalis as an effective treatment for promyelocytic leukemia. Proc Natl Acad Sci USA. 2008;105:4826–4831. doi: 10.1073/pnas.0712365105. - DOI - PMC - PubMed
    1. Zhang QY, Mao JH, Liu P, Huang QH, Lu J, Xie YY, Weng L, Zhang Y, Chen Q, Chen SJ, et al. A systems biology understanding of the synergistic effects of arsenic sulfide and Imatinib in BCR/ABL-associated leukemia. Proc Natl Acad Sci USA. 2009;106:3378–3383. doi: 10.1073/pnas.0813142106. - DOI - PMC - PubMed
    1. Liu Y, He P, Cheng X, Zhang M. Long-term outcome of 31 cases of refractory acute promyelocytic leukemia treated with compound realgar natural indigo tablets administered alternately with chemotherapy. Oncol Lett. 2015;10:1184–1190. doi: 10.3892/ol.2015.3308. - DOI - PMC - PubMed
    1. Zhang L, Kim S, Ding W, Tong Y, Zhang X, Pan M, Chen S. Arsenic sulfide inhibits cell migration and invasion of gastric cancer in vitro and in vivo. Drug Des Devel Ther. 2015;9:5579–5590. - PMC - PubMed

MeSH terms