. 2019 Mar;20(3):356-371.
doi: 10.1111/mpp.12760. Epub 2018 Nov 22.

An RXLR effector secreted by Phytophthora parasitica is a virulence factor and triggers cell death in various plants

Affiliations

An RXLR effector secreted by Phytophthora parasitica is a virulence factor and triggers cell death in various plants

Guiyan Huang et al. Mol Plant Pathol. 2019 Mar.

Abstract

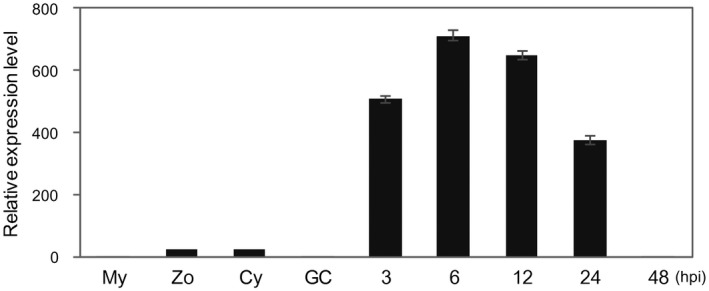
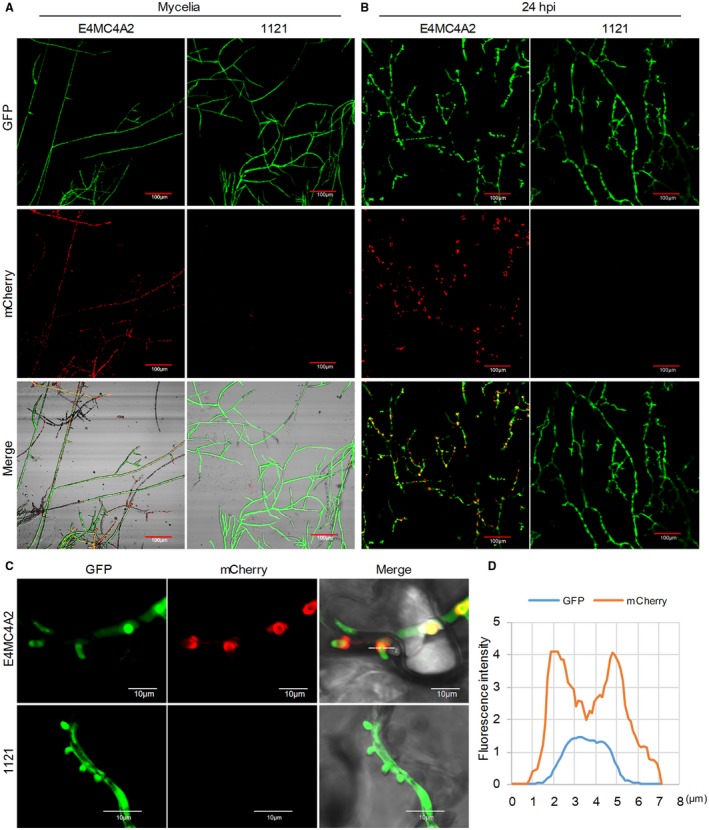
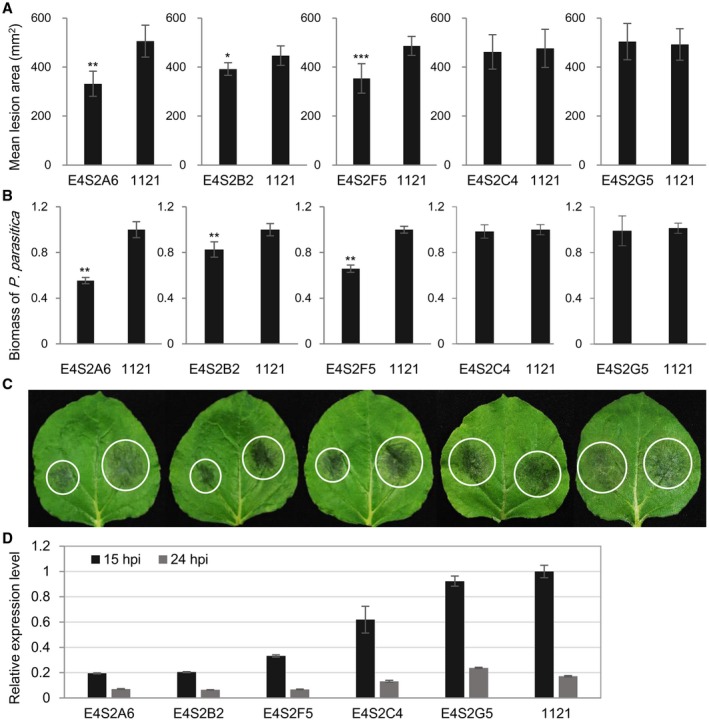
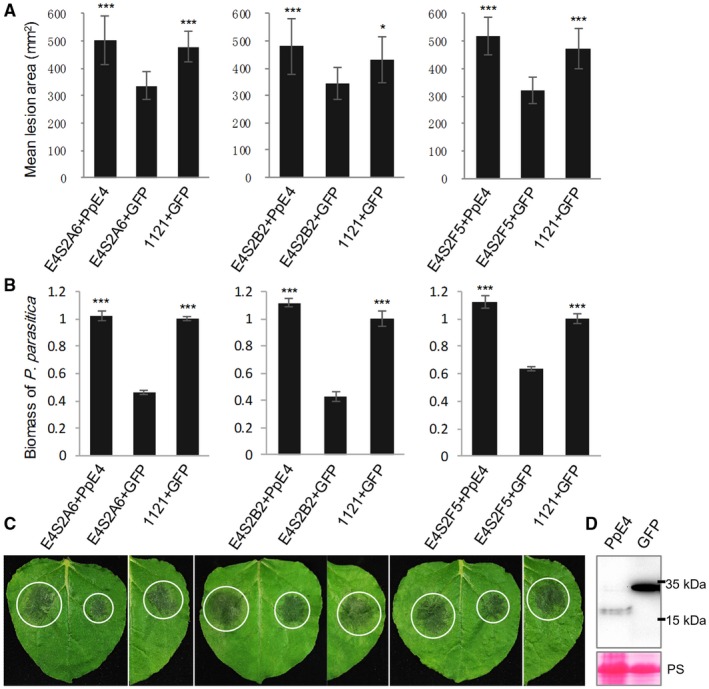
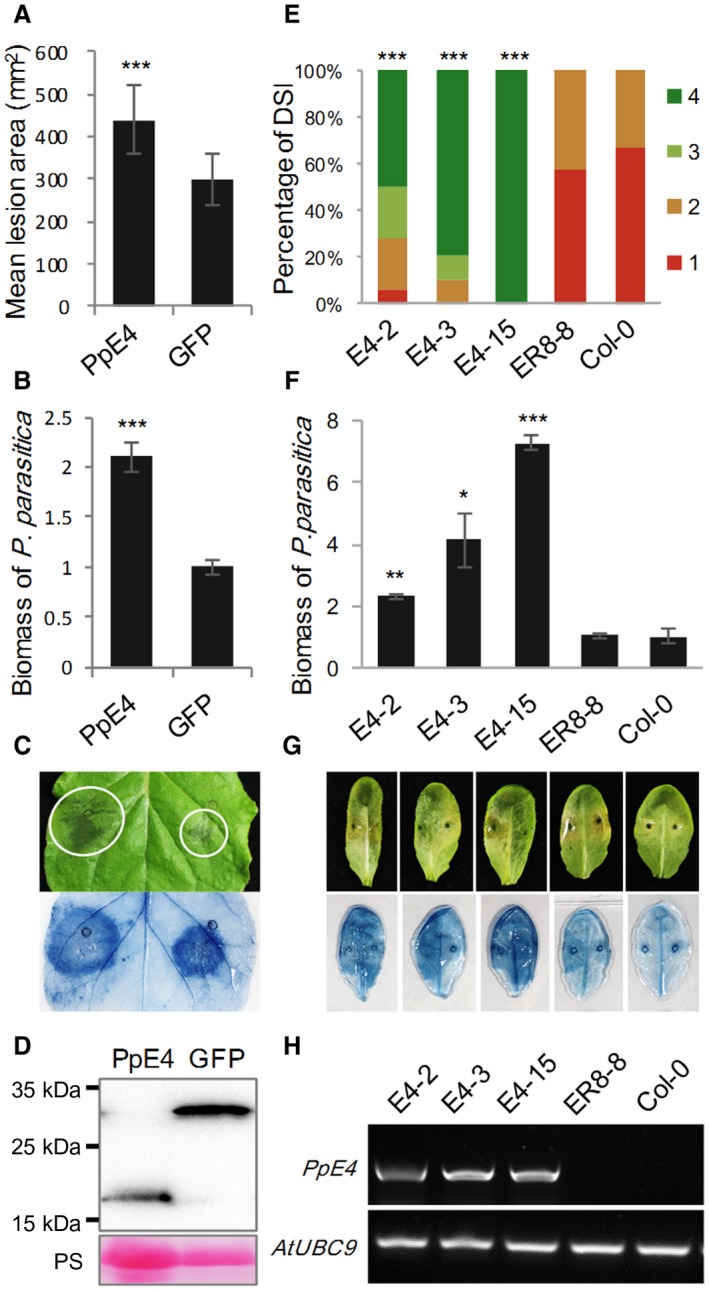
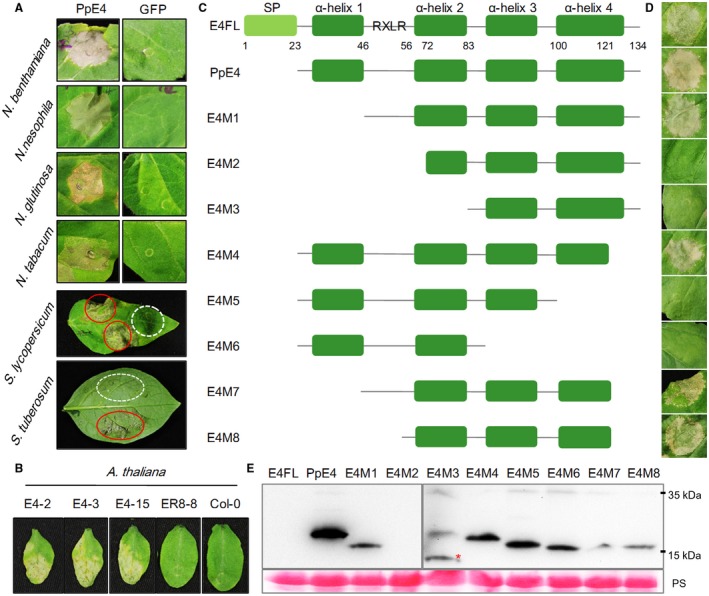
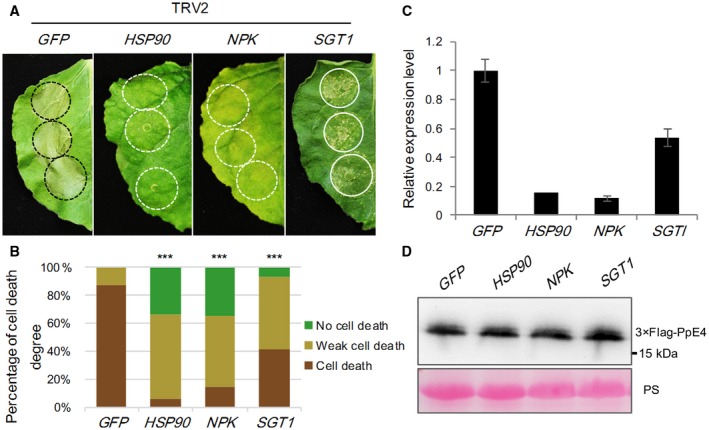
RXLR effectors encoded by Phytophthora species play a central role in pathogen-plant interactions. An understanding of the biological functions of RXLR effectors is conducive to the illumination of the pathogenic mechanisms and the development of disease control strategies. However, the virulence function of Phytophthora parasitica RXLR effectors is poorly understood. Here, we describe the identification of a P. parasitica RXLR effector gene, PPTG00121 (PpE4), which is highly transcribed during the early stages of infection. Live cell imaging of P. parasitica transformants expressing a full-length PpE4 (E4FL)-mCherry protein indicated that PpE4 is secreted and accumulates around haustoria during plant infection. Silencing of PpE4 in P. parasitica resulted in significantly reduced virulence on Nicotiana benthamiana. Transient expression of PpE4 in N. benthamiana in turn restored the pathogenicity of the PpE4-silenced lines. Furthermore, the expression of PpE4 in both N. benthamiana and Arabidopsis thaliana consistently enhanced plant susceptibility to P. parasitica. These results indicate that PpE4 contributes to pathogen infection. Finally, heterologous expression experiments showed that PpE4 triggers non-specific cell death in a variety of plants, including tobacco, tomato, potato and A. thaliana. Virus-induced gene silencing assays revealed that PpE4-induced cell death is dependent on HSP90, NPK and SGT1, suggesting that PpE4 is recognized by the plant immune system. In conclusion, PpE4 is an important virulence RXLR effector of P. parasitica and recognized by a wide range of host plants.

Keywords: Phytophthora parasitica; RXLR effector; cell death; haustoria; virulence.


Figures

Figure 1
Figure 1
The Phytophthora parasitica RXLR effector gene PpE4 is highly expressed during early plant infection. Reverse transcription‐quantitative polymerase chain reaction (RT‐qPCR) was used to quantify the relative PpE4 transcript levels during different stages of P. parasitica development and infection. Nicotiana benthamiana leaves inoculated with P. parasitica zoospores were harvested at different hours post‐inoculation (hpi). Cy, cysts; GC, germinated cysts; My, P. parasitica mycelium grown in carrot broth; Zo, zoospores. The relative expression level of PpE4 in mycelia was given a value of unity. Error bars represent the standard deviation (SD) of three biological replicates.
Figure 2
Figure 2
PpE4 accumulates around haustoria after secretion during Phytophthora parasitica infection. (A) Confocal images of mycelia cultured on 5% carrot juice agar medium. The red fluorescence was distributed throughout the mycelial cytoplasm of E4MC4A2 [a transformant expressing cytoplasmic green fluorescent protein (GFP) and full‐length PpE4 (E4FL)‐mCherry], but was not detected in strain 1121 (stably expressing cytoplasmic GFP). (B) Nicotiana benthamiana leaves infected with E4MC4A2 and 1121 were observed by confocal microscopy at 24 h post‐inoculation (hpi). A strong red fluorescence signal was highly accumulated in haustoria, but not in hyphae, during E4MC4A2 infection, whereas GFP fluorescence was evenly distributed in hyphae. No red fluorescence was observed in strain 1121. (C) A magnified lateral view of haustoria showing red fluorescence focused on the outside of the haustoria base and the GFP signal distributed throughout hyphae and haustoria. (D) The fluorescence intensities of GFP and mCherry across the haustorium indicated by the white line labelled ‘2’ in (C). Identical images were obtained from more than 10 haustoria in three independent biological replicates. [Colour figure can be viewed at wileyonlinelibrary.com]
Figure 3
Figure 3
PpE4‐silenced Phytophthora parasitica transformants exhibit reduced pathogenicity. (A) Mean lesion areas of Nicotiana benthamiana leaves inoculated with PpE4‐silenced transformants and the control strain 1121 at 48 h post‐inoculation (hpi). The transformant and the control strain were inoculated on opposite halves of an N. benthamiana leaf. Error bars represent the standard deviation (SD) of 15 leaves, and asterisks denote significant differences from control strain 1121 (two tailed t‐test: *P < 0.05; **P < 0.01; ***P < 0.001). (B) Biomass of P. parasitica on N. benthamiana leaves determined by quantitative polymerase chain reaction (qPCR). Bars represent PpUBC levels relative to NbFbox levels with SD of three biological replicates. Asterisks denote significant differences from control strain 1121 (two tailed t‐test: **P < 0.01). (C) Representative inoculated leaves. White circles outline the water‐soaked lesions. Similar results were obtained from more than three independent experiments with about 15 leaves for each experiment. (D) PpE4 expression was restored in two transformants E4S2C4 and E4S2G5, whose virulence was not reduced. The subcultured transformants were inoculated onto N. benthamiana leaves and sampled at 15 and 24 hpi. Reverse transcription (RT)‐qPCR was used to determine the PpE4 silencing level. The expression level of PpE4 in strain 1121 sampled at 15 hpi was given a value of unity. Error bars represent the SD of three biological replicates. Two independent experiments were performed with similar results. [Colour figure can be viewed at wileyonlinelibrary.com]
Figure 4
Figure 4
The pathogenicity of PpE4‐silenced Phytophthora parasitica lines is restored by the transient expression of PpE4 in planta. PpE4 and GFP were transiently expressed by agroinfiltration in Nicotiana benthamiana leaves 1 day before inoculation [optical density at 600 nm (OD600) = 0.01]. (A) The lesions formed after the inoculation of PpE4‐silenced lines onto PpE4‐expressing leaves were almost the same size as those formed after the inoculation of 1121 onto GFP‐expressing leaves, whereas the lesions formed by silenced lines inoculated onto GFP‐expressing leaves were significantly smaller. Error bars represent the standard deviation (SD) of 15 leaves, and asterisks denote significant differences from the control group (two‐tailed t‐test: *P < 0.05; ***P < 0.001). (B) Biomass of P. parasitica on N. benthamiana leaves was determined by quantitative polymerase chain reaction (qPCR). Bars represent PpUBC levels relative to NbFbox levels with SD of three biological replicates. Asterisks denote significant differences from silenced lines inoculated onto GFP‐expressing leaves (two‐tailed t‐test: ***P < 0.001). (C) Representative inoculated leaves. White circles outline the water‐soaked lesions. (D) Protein accumulation detected by western blot using anti‐Flag antibody. Protein loading is indicated by Ponceau stain (PS). Similar results were obtained from three independent experiments with more than 15 leaves inoculated for each group in each experiment. [Colour figure can be viewed at wileyonlinelibrary.com]
Figure 5
Figure 5
Heterologous expression of PpE4 renders Nicotiana benthamiana and Arabidopsis more susceptible to Phytophthora parasitica infection. (A) Mean lesion areas were measured at 48 h post‐inoculation (hpi). Agrobacterium tumefaciens strains carrying PpE4 or GFP [optical density at 600 nm (OD600) = 0.01] were infiltrated into different sides of the same leaf, 1 day before inoculation of strain 1121. Error bars represent the standard deviation (SD) of 15 leaves, and asterisks denote significant differences from the green fluorescent protein (GFP) control (two‐tailed t‐test: ***P < 0.001). (B) Quantification of P. parasitica biomass in infected N. benthamiana leaves. Bars represent PpUBC levels relative to NbFbox levels with SD of three biological replicates. Asterisks denote significant differences from the GFP control (two‐tailed t‐test: ***P < 0.001). (C) A typical leaf photographed and stained by trypan blue. White circles outline the water‐soaked lesions. (D) Protein accumulation was determined at 3 days post‐infiltration (dpi) by western blot using anti‐Flag antibody. Protein loading is indicated by Ponceau stain (PS). Similar results were obtained from three independent experiments with about 15 leaves for each experiment. (E) Disease severity index (DSI) from grade 1 to grade 4 was recorded at 48 hpi. Homozygous transgenic plants expressing β‐estradiol‐inducible 3×Flag‐PpE4 (E4‐2, E4‐3 and E4‐15), an empty vector pER8 transgenic plant (ER8‐8) and wild‐type Col‐0 were injected with 10 μM 17‐β‐estradiol, 12 h before inoculation of strain 1121. Asterisks represent significant differences from Col‐0 (Wilcoxon rank‐sum test: ***P < 0.001). (F) Biomass of P. parasitica on Arabidopsis leaves. Bars represent PpUBC levels relative to AtUBC levels with SD of five biological replicates. Asterisks denote significant differences from Col‐0 (two‐tailed t‐test: *P < 0.05; **P < 0.01; ***P < 0.001). (G) Disease symptoms of representative leaves. Trypan blue stain was used to highlight the infection hyphae in colonized leaves. (H) Verification of PpE4 expression 12 h after injection of 10 μM 17‐β‐estradiol using semi‐quantitative polymerase chain reaction (PCR). Similar results were obtained from three independent experiments with about 25 leaves for each experiment. [Colour figure can be viewed at wileyonlinelibrary.com]
Figure 6
Figure 6
Analysis of cell death triggered by PpE4. (A) Cell death phenotype induced by PpE4 in Solanaceae plants. Agrobacterium tumefaciens carrying PpE4 [optical density at 600 nm (OD600) = 0.4] was infiltrated into the leaves of Nicotiana benthamiana, N. nesophila, N. glutinosa, N. tabacum cv. Florida 301, Solanum lycopersicum and S. tuberosum. Photographs were taken at 5 days post‐infiltration (dpi) for Nicotiana species and 8 dpi for Solanum species. Red circles represent the PpE4‐expressing areas, and white broken circles represent the GFP‐expressing areas. (B) Cell death symptoms triggered by PpE4 in Arabidopsis. Leaves of transgenic Arabidopsis plants harbouring pER8::3×FlagPpE4 or the empty vector and Col‐0 were injected with 10 μM 17‐β‐estradiol. Photographs were taken after 5 days. (C) Schematic diagrams of the protein secondary structures of the PpE4 deletion mutants. (D) Cell death symptoms in N. benthamiana leaves expressing PpE4 deletion mutants. Photographs were taken at 5 dpi. (E) Western blot detection of PpE4 deletion proteins using anti‐Flag antibody. The red asterisk indicates a protein band of the correct size. Protein loading is indicated by Ponceau stain (PS). Similar results were obtained from three independent experiments. [Colour figure can be viewed at wileyonlinelibrary.com]
Figure 7
Figure 7
HSP90, NPK and SGT1 are involved in PpE4‐induced cell death. (A) Representative images of PpE4‐induced cell death in silenced Nicotiana benthamiana leaves at 5 days post‐infiltration (dpi). PpE4 was transiently expressed in the upper leaves of silenced plants at 16–20 dpi of TRV constructs. (B) Quantification of cell death in N. benthamiana leaves scored at 5 dpi. The degree of cell death was divided into three levels: no cell death, weak cell death and complete cell death. Asterisks indicate significant differences from GFP‐silenced plants (Wilcoxon rank‐sum test: ***P < 0.001). (C) Relative expression levels of HSP90, NPK and SGT1 transcripts in corresponding virus‐induced gene silencing (VIGS)‐treated plants determined by reverse transcription‐quantitative polymerase chain reaction (RT‐qPCR). Error bars represent the standard deviation (SD) of three biological replicates. (D) Detection of PpE4 protein accumulation in silenced leaves using the anti‐Flag antibody. Protein loading is indicated by Ponceau stain (PS). Similar results were obtained from more than three independent experiments with 10 plants for each TRV construct. [Colour figure can be viewed at wileyonlinelibrary.com]

Similar articles

Cited by

References

    1. Anderson, R.G. , Deb, D. , Fedkenheuer, K. and McDowell, J.M. (2015) Recent progress in RXLR effector research. Mol. Plant–Microbe Interact. 28, 1063–1072. - PubMed
    1. Attard, A. , Gourgues, M. , Callemeyn‐Torre, N. and Keller, H. (2010) The immediate activation of defense responses in Arabidopsis roots is not sufficient to prevent Phytophthora parasitica infection. New Phytol. 187, 449–460. - PubMed
    1. Baxter, L. , Tripathy, S. , Ishaque, N. , Boot, N. , Cabral, A. , Kemen, E. , Thines, M. , Ah‐Fong, A. , Anderson, R. and Badejoko, W. (2010) Signatures of adaptation to obligate biotrophy in the Hyaloperonospora arabidopsidis genome. Science, 330, 1549–1551. - PMC - PubMed
    1. Bohm, H. , Albert, I. , Oome, S. , Raaymakers, T.M. , Van den Ackerveken, G. and Nurnberger, T. (2014) A conserved peptide pattern from a widespread microbial virulence factor triggers pattern‐induced immunity in Arabidopsis . PLoS Pathog. 10, e1004491. - PMC - PubMed
    1. Bos, J.I. , Kanneganti, T.D. , Young, C. , Cakir, C. , Huitema, E. , Win, J. , Armstrong, M.R. , Birch, P.R. and Kamoun, S. (2006) The C‐terminal half of Phytophthora infestans RXLR effector AVR3a is sufficient to trigger R3a‐mediated hypersensitivity and suppress INF1‐induced cell death in Nicotiana benthamiana . Plant J. 48, 165–176. - PubMed

Publication types

MeSH terms

LinkOut - more resources