. 2018 Oct;32(7):850-865.
doi: 10.1037/neu0000493.

The ipsilesional attention bias in right-hemisphere stroke patients as revealed by a realistic visual search task: Neuroanatomical correlates and functional relevance

Affiliations

The ipsilesional attention bias in right-hemisphere stroke patients as revealed by a realistic visual search task: Neuroanatomical correlates and functional relevance

Björn Machner et al. Neuropsychology. 2018 Oct.

Erratum in

Abstract

Objective: Right-hemisphere stroke may cause an ipsilesional attention bias and left hemispatial neglect. Computerized time-limited tasks are more sensitive than conventional paper-pencil tests in detecting these spatial attention deficits. However, their frequency in the acute stage of stroke, the neuroanatomical basis and functional relevance for patients' everyday life are unclear.

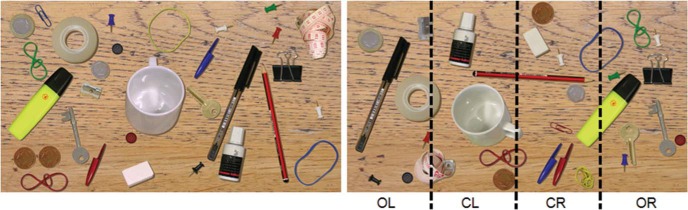
Method: A realistic visual search task is introduced, in which eye movements are recorded while the patient searches for paperclips among different everyday objects on a computer display. The "desk task" performance of 34 acute right-hemisphere stroke patients was compared to established paper-pencil tests for neglect and the Posner reaction time task, and finally correlated to structural brain lesions.

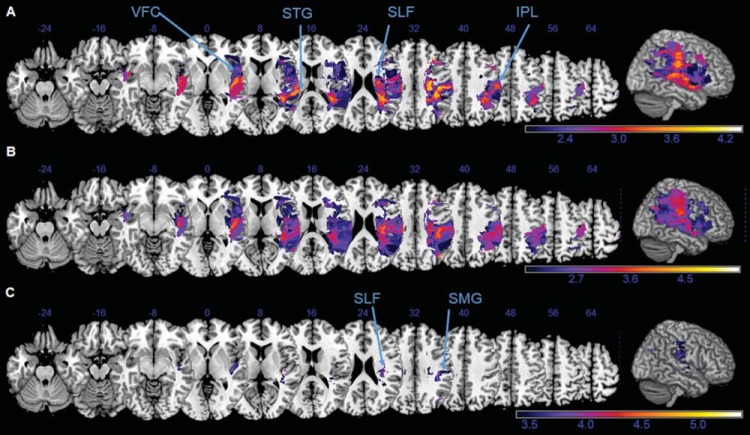
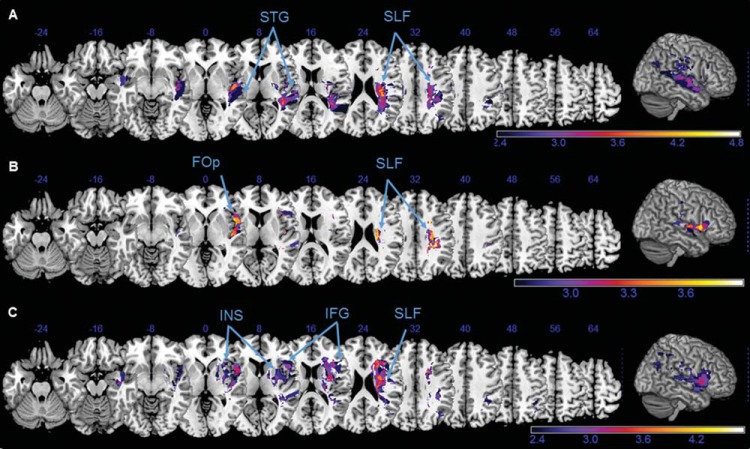
Results: Most of the patients, even those without clinical neglect signs and with normal paper-pencil test performance, exhibited a clear ipsilesional attention bias in the desk task. This bias was highly correlated to the left-right asymmetry in the Posner task and to neglect-related functional impairment scores. Lesion-symptom mapping revealed task-specific differences: deficits in the desk task were associated with lesions of the superior temporal gyrus, contralesional unawareness in the Posner task with ventral frontal cortex lesions and paper-pencil cancellation bias with damage to the inferior parietal lobe. Neglect behavior was further associated with distinct frontoparietal white matter tract disconnections (inferior longitudinal fasciculus, superior longitudinal fasciculus, arcuate).

Conclusions: Results from the novel desk task indicate a functional relevance of spatial attention deficits in right-hemisphere stroke patients, even if they are "subclinical." This should be considered especially in patients without obvious clinical neglect signs. (PsycINFO Database Record (c) 2018 APA, all rights reserved).


Figures

Figure 1
Figure 1
Desk task stimulus. Left: An example of the naturalistic image of a desk (left picture) that was presented to the participants, who were instructed to search for a paperclip and report its color (either red or blue). Right: Offline data analysis was performed separately for four different horizontal locations (columns) on the screen in which the target could have been presented: outmost left (OL), center left (CL), center right (CR), outmost right (OR). In this example, the target (red paperclip) was placed in the CR column.
Figure 2
Figure 2
Desk task performance. (A) Detection rate and (B) search duration are depicted separately for the four study groups and the horizontal x-position (column), where the target was presented on the screen: outmost left (OL), center left (CL), center right (CR) or outmost right (OR). (C) Horizontal fixation distribution is illustrated as a boxplot function of fixations (cumulative time of gaze samples) in relation to the horizontal location where they landed on the screen, separately for the four study groups. The median band represents the center of fixation, where 50% of all gaze samples were left and 50% right of its x-position. Boxes represent the horizontal range where 25% (left end) or 75% (right end) of the fixations fell into. The ends of the whiskers reflect the leftmost and rightmost 2.5% of horizontal positions of fixations. After averaging over the participants of each group, 95% of all gaze samples fell into that range, thus they represent the mean field of exploration for each study group.
Figure 3
Figure 3
Posner task performance. (A) Detection rate and (B) reaction time are depicted separately for the four study groups, the position/visual hemifield where the target appeared (left or right) and the validity of the preceding cue (valid or invalid).
Figure 4
Figure 4
Lesion overlaps and subtraction analysis. Lesion overlap analyses were performed separately for (A) “no neglect,” (B) “moderate neglect,” and (C) “severe neglect” patients. The absolute number of overlapping lesions in a specific voxel/area is indicated by the color bar (minimum n = 2 patients show damage in this voxel, maximum = all patients in the group have damage in this voxel). (D) The subtraction analysis shows brain regions that were at least 40% (percentage color coded up to maximum of 100%) more frequently damaged in patients with clinically manifest neglect than in “no neglect” patients: the insula and inferior frontal gyrus, the supramarginal gyrus, and the frontoparietal white matter. The Montreal Neurological Institute Z coordinates are presented above each transverse section.
Figure 5
Figure 5
Voxel-wise lesion symptom (VLSM) mapping of Catherine Bergego Scale (CBS) score and Bell’s center of cancellation (CoC). Neuronal correlates of the neglect related functional disability (CBS score, A) and the spatial attention bias in the Bell’s cancellation task (CoC, B and C), as revealed by a voxel-based lesion-symptom mapping. Z values are shown color-coded, using false discovery rate–corrected at (A, B) p < .05 or (C) p < .01. Only voxels that were damaged in at least 20% of the subjects were analyzed. Z coordinates above each transverse slice are given in Montreal Neurological Institute space. Detailed description in the main text. VFC = ventral frontal cortex; STG = superior temporal gyrus; SLF = superior longitudinal fasciculus; IPL = inferior parietal lobe; SMG = supramarginal gyrus.
Figure 6
Figure 6
Voxel-wise lesion symptom mapping of computerized task parameters. Anatomical correlates of the spatial attention deficits in the computerized tasks, revealed by a voxel-based lesion-symptom mapping for the following behavioral parameters: (A) Search duration and (B) center of fixation in the desk task and (C) lateralization index in the Posner task. Z values are shown color-coded, using false discovery rate–corrected p < .05. Only voxels that were damaged in at least 20% of the subjects were analyzed. Z coordinates above each transverse slice are given in Montreal Neurological Institute space. Detailed description in the main text. STG = superior temporal gyrus; SLF = superior longitudinal fasciculus; FOp = frontal operculum; INS = insula; IFG = inferior frontal gyrus.
Figure 7
Figure 7
Overlap of disconnectome maps. The patients’ individual disconnectomes (visualizing those tracts that are disconnected by the lesion with >50% probability) are presented as overlaps for the different study groups: (A) no neglect, (B) moderate neglect, and (C) severe neglect. The absolute number of overlapping disconnectomes in a specific area is indicated by the color bar. The upper line shows blue Z coordinates of the slices in Montreal Neurological Institute space.
Figure 8
Figure 8
Behavioral test performances in dependence of white matter tract affection. The behavioral test results of the Catherine Bergego Scale (CBS) score, center of cancellation (CoC) in the Bells test, lateralization index (LI) in the Posner task, and center of fixation (CoF) in the desk task are depicted as a mean performance of patients without (light gray) or with (dark gray) disconnection of different white matter tracts of interest. The number of patients (n) with or without disconnection of the according tract is provided on the left of the y-axis. Error bars show standard error of the mean. * p < .05, ** p < .01, Mann–Whitney U test.

References

    1. Avants B. B., Tustison N. J., Song G., Cook P. A., Klein A., & Gee J. C. (2011). A reproducible evaluation of ANTs similarity metric performance in brain image registration. NeuroImage, 54, 2033–2044. 10.1016/j.neuroimage.2010.09.025 - DOI - PMC - PubMed
    1. Azouvi P., Bartolomeo P., Beis J. M., Perennou D., Pradat-Diehl P., & Rousseaux M. (2006). A battery of tests for the quantitative assessment of unilateral neglect. Restorative Neurology and Neuroscience, 24, 273–285. - PubMed
    1. Azouvi P., Olivier S., de Montety G., Samuel C., Louis-Dreyfus A., & Tesio L. (2003). Behavioral assessment of unilateral neglect: Study of the psychometric properties of the Catherine Bergego Scale. Archives of Physical Medicine and Rehabilitation, 84, 51–57. 10.1053/apmr.2003.50062 - DOI - PubMed
    1. Azouvi P., Samuel C., Louis-Dreyfus A., Bernati T., Bartolomeo P., Beis J. M., et al. the French Collaborative Study Group on Assessment of Unilateral Neglect (GEREN/GRECO) (2002). Sensitivity of clinical and behavioural tests of spatial neglect after right hemisphere stroke. Journal of Neurology, Neurosurgery, and Psychiatry, 73, 160–166. 10.1136/jnnp.73.2.160 - DOI - PMC - PubMed
    1. Bartolomeo P., Thiebaut de Schotten M., & Doricchi F. (2007). Left unilateral neglect as a disconnection syndrome. Cerebral Cortex, 17, 2479–2490. 10.1093/cercor/bhl181 - DOI - PubMed

MeSH terms