

Adult gonorrhea, chlamydia and syphilis prevalence, incidence, treatment and syndromic case reporting in South Africa: Estimates using the Spectrum-STI model, 1990-2017
- PMID: 30321236
- PMCID: PMC6188893
- DOI: 10.1371/journal.pone.0205863
Adult gonorrhea, chlamydia and syphilis prevalence, incidence, treatment and syndromic case reporting in South Africa: Estimates using the Spectrum-STI model, 1990-2017
Abstract
Objectives: To estimate trends in prevalence and incidence of syphilis, gonorrhea and chlamydia in adult men and women in South Africa.
Methods: The Spectrum-STI tool estimated trends in prevalence and incidence of active syphilis, gonorrhea and chlamydia, fitting South African prevalence data. Results were used, alongside programmatic surveillance data, to estimate trends in incident gonorrhea cases resistant to first-line treatment, and the reporting gap of symptomatic male gonorrhea and chlamydia cases treated but not reported as cases of urethritis syndrome.
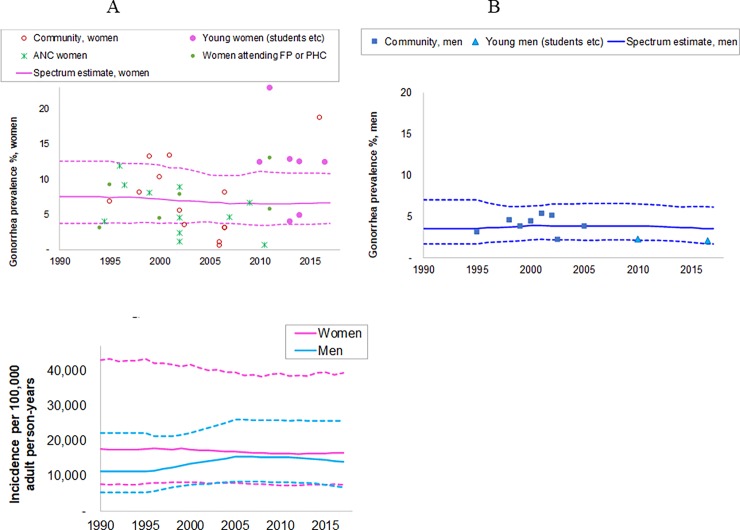
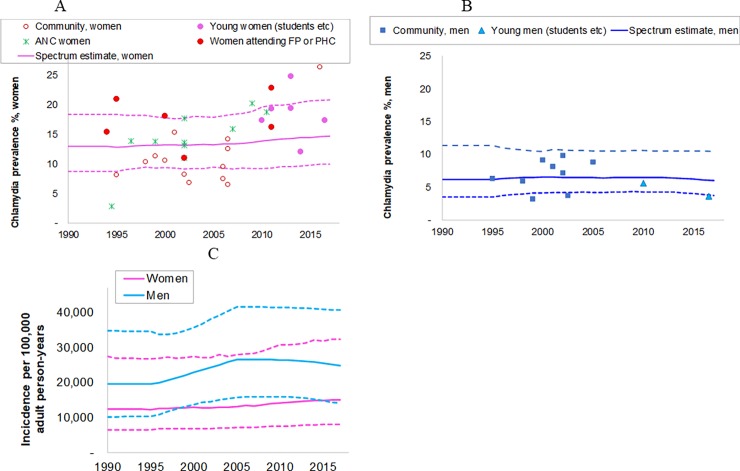
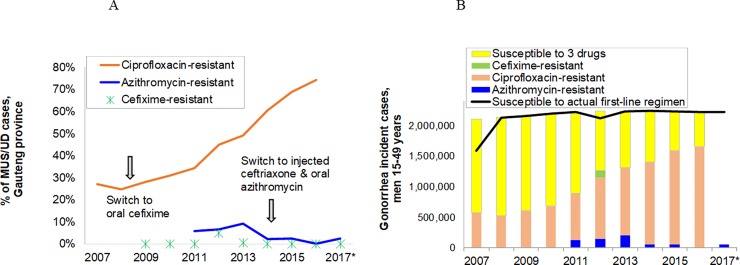
Results: In 2017 adult (15-49 years) the estimated female and male prevalences for syphilis were 0.50% (95% CI: 0.32-0.80%) and 0.97% (0.19-2.28%), for gonorrhea 6.6% (3.8-10.8%) and 3.5% (1.7-6.1%), and for chlamydia 14.7% (9.9-21%) and 6.0% (3.8-10.4%), respectively. Between 1990 and 2017 the estimated prevalence of syphilis declined steadily in women and men, probably in part reflecting improved treatment coverage. For gonorrhea and chlamydia, estimated prevalence and incidence showed no consistent time trend in either women or men. Despite growing annual numbers of gonorrhea cases - reflecting population growth - the estimated number of first line treatment-resistant gonorrhea cases did not increase between 2008 and 2017, owing to changes in first-line antimicrobial treatment regimens for gonorrhea in 2008 and 2014/5. Case reporting completeness among treated male urethritis syndrome episodes was estimated at 10-28% in 2017.
Conclusion: South Africa continues to suffer a high STI burden. Improvements in access and quality of maternal, STI and HIV health care services likely contributed to the decline in syphilis prevalence. The lack of any decline in gonorrhea and chlamydia prevalence highlights the need to enhance STI services beyond clinic-based syndromic case management, to reinvigorate primary STI and HIV prevention and, especially for women, to screen for asymptomatic infections.
Conflict of interest statement
The views expressed in this paper are those of the authors and do not necessarily represent the position of Avenir Health, South Africa’s National Institute for Communicable Diseases, the World Health Organization, the U.S. Centers for Disease Control and Prevention, or other organizations. The authors have declared that no competing interests exist.
Figures

References
-
- South African National AIDS Council. National Strategic Plan for HIV, TB and STIs 2017–2022. Pretoria 2017. http://sanac.org.za/wp-content/uploads/2017/05/NSP_FullDocument_FINAL.pdf
-
- National Department of Health—Republic of South Africa. Sexually Transmitted Infections Management Guidelines, adapted from Standard Treatment Guidelines and Essential Drugs List Primary Health Care In: Standard Treatment Guidelines and Essential Drugs List for Primary Healthcare, editor.2015.
-
- South Africa National Department of Health. National Integrated District Health Information System. Pretoria [cited 2018 07 June]; Available from: https://za.dhis.dhmis.org/dhis-web-commons/security/login.action.
-
- Kularatne R, Maseko V, Gumede L, Readebe F, Kufa-Chakezha T. Neisseria gonorrhoeae antimicrobial resistance surveillance in Gauteng province, South Africa. Johannesburg 2016 September 3. http://www.nicd.ac.za/assets/files/Neisseria%20gonorrhoeae.pdf
-
- Kularatne R. Aetiological surveillance of sexually transmitted infection syndromes at sentinel sites: GERMS-SA 2014–2016. Public Health Surveillance Bulletin. 2017. November;15:114–22.
Publication types
MeSH terms
Grants and funding
LinkOut - more resources
Full Text Sources
Medical
Miscellaneous
