. 2018 Nov 30;46(21):11423-11437.
doi: 10.1093/nar/gky938.

Human GTPBP10 is required for mitoribosome maturation

Affiliations

Human GTPBP10 is required for mitoribosome maturation

Priyanka Maiti et al. Nucleic Acids Res. .

Abstract

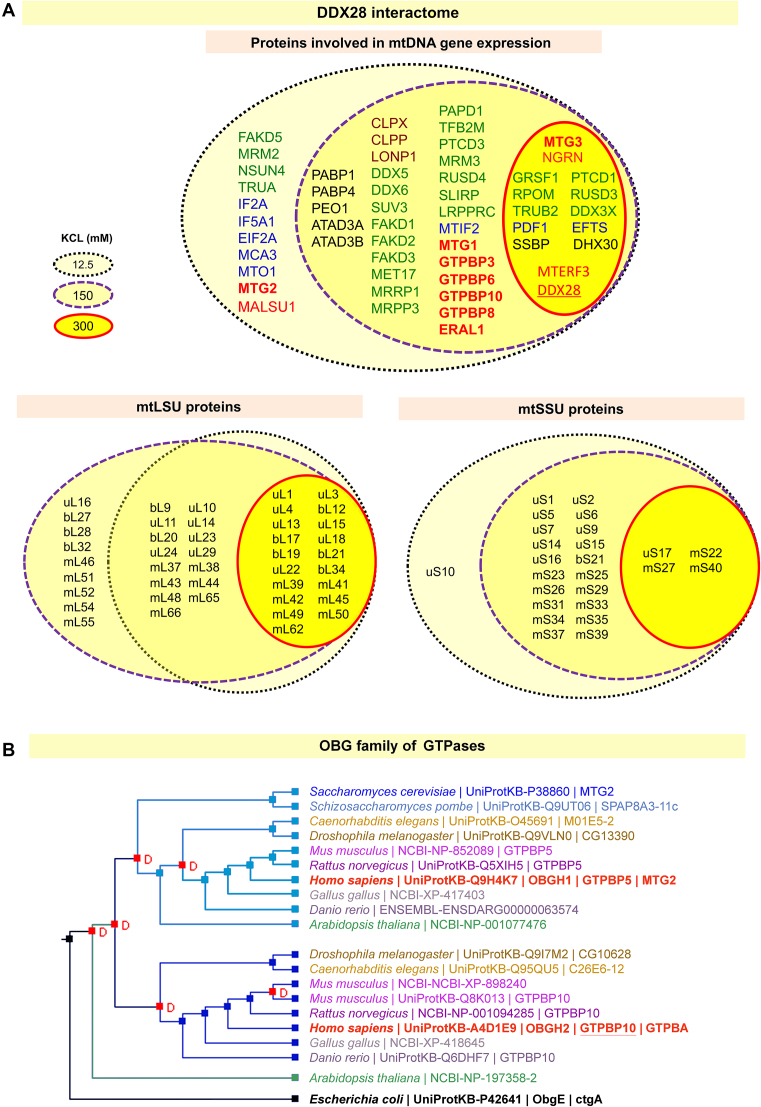
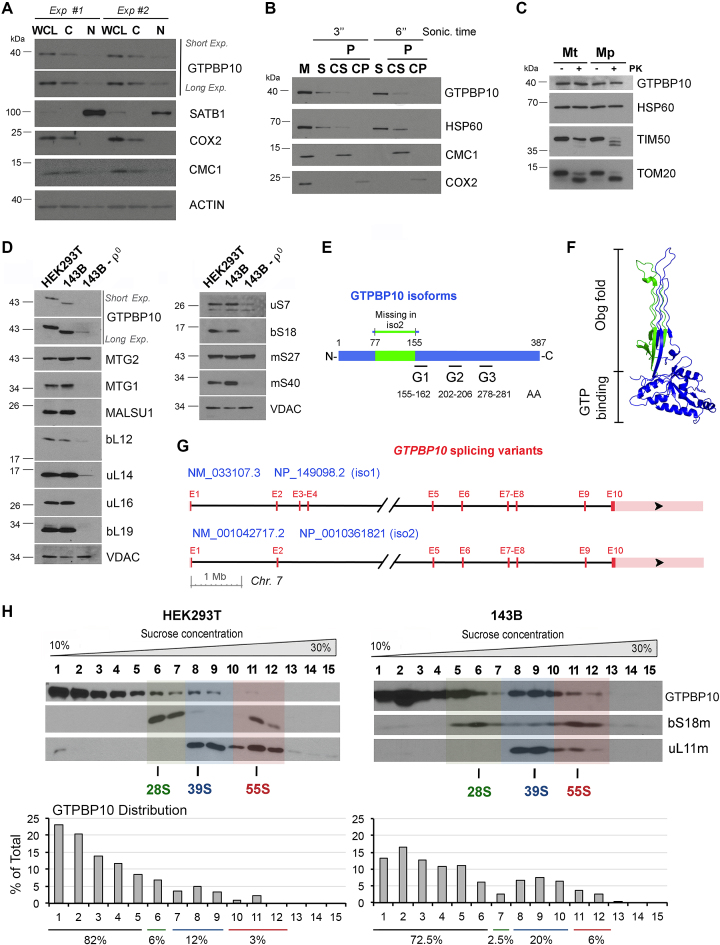
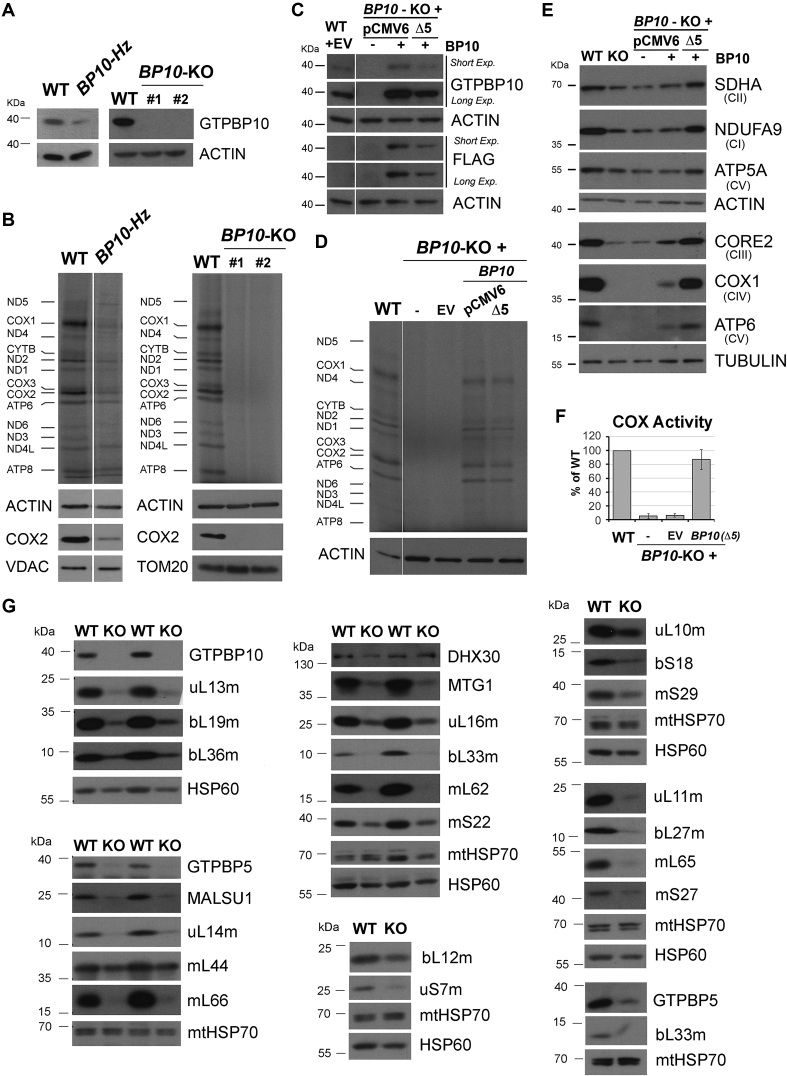
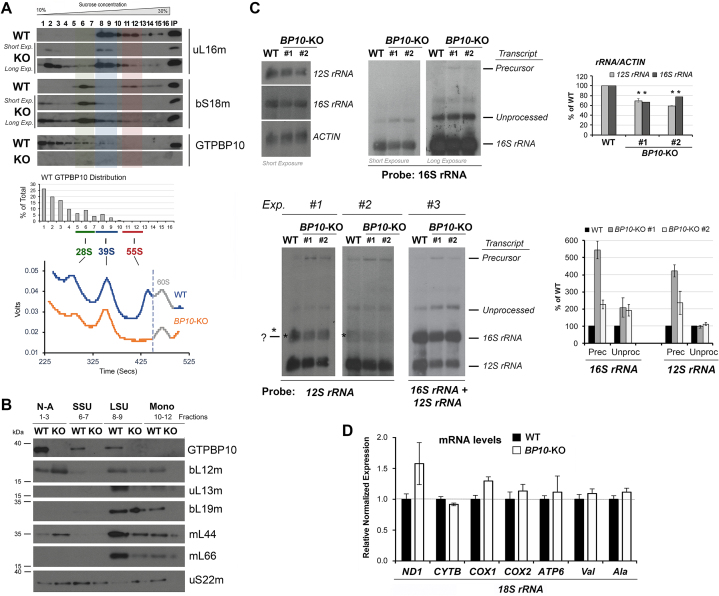
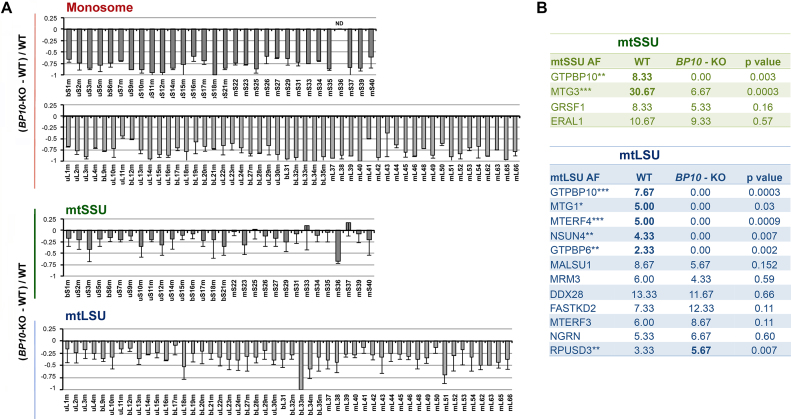
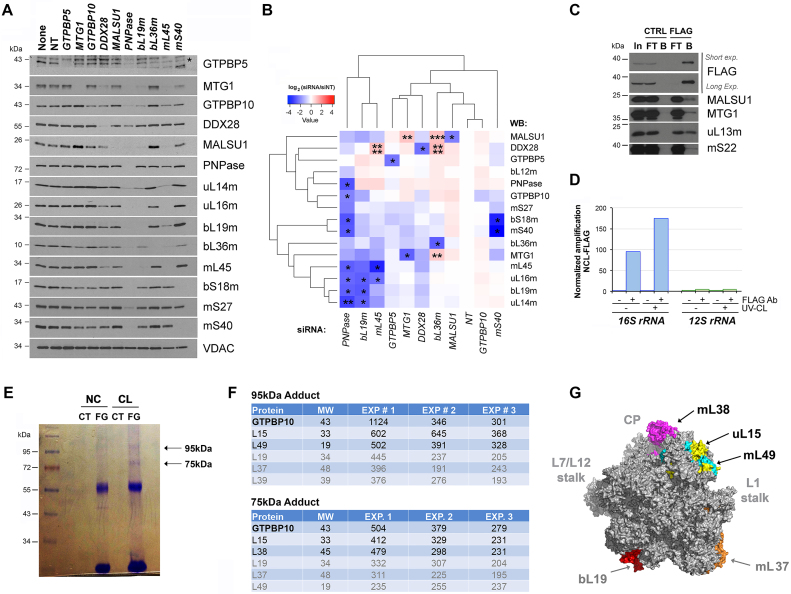
Most steps on the biogenesis of the mitochondrial ribosome (mitoribosome) occur near the mitochondrial DNA nucleoid, in RNA granules, which contain dedicated RNA metabolism and mitoribosome assembly factors. Here, analysis of the RNA granule proteome identified the presence of a set of small GTPases that belong to conserved families of ribosome assembly factors. We show that GTPBP10, a member of the conserved Obg family of P-loop small G proteins, is a mitochondrial protein and have used gene-editing technologies to create a HEK293T cell line KO for GTPBP10. The absence of GTPBP10 leads to attenuated mtLSU and mtSSU levels and the virtual absence of the 55S monosome, which entirely prevents mitochondrial protein synthesis. We show that a fraction of GTPBP10 cosediments with the large mitoribosome subunit and the monosome. GTPBP10 physically interacts with the 16S rRNA, but not with the 12S rRNA, and crosslinks with several mtLSU proteins. Additionally, GTPBP10 is indirectly required for efficient processing of the 12S-16S rRNA precursor transcript, which could explain the mtSSU accumulation defect. We propose that GTPBP10 primarily ensures proper mtLSU maturation and ultimately serves to coordinate mtSSU and mtLSU accumulation then providing a quality control check-point function during mtLSU assembly that minimizes premature subunit joining.


Figures

Figure 1.
Figure 1.
The mitochondrial RNA granules contain members of several families of GTPases. (A) DDX28 interacting proteome analyzed by immunoprecipitation of endogenous DDX28 from HEK293T mitochondria extracted using conditions of increasing salt stringency and an anti-DDX28-specific antibody and protein A magnetic beads. IgG was used as a control. The full list of proteins is present in Supplemental Table S1. Proteins co-immunoprecitated with DDX28 are displayed confined by black dotted (12.5 mM KCl), purple dashed (150 mM KCl) and red solid (300 mM KCl) Venn diagrams. The diagram in the upper panel list proteins within five categories: RNA metabolism factors (green), ribosome assembly factors (red, with GTPases in bold), translational factors (blue), proteases (brown) and mtDNA nucleoids (black). The diagrams in the lower panel list mtSSU and mtLSU mitoribosome proteins. (B) Cluster analysis of Obg proteins, highlighting the clustering of yeast Mtg2 and animal GTPBP5 (human OBGH1) and the lack of yeast homolog for animal GTPBP10 (human OBGH2), obtained using the Princeton Protein Orthology Database (P-POD). A Notug 2.6 graph is presented (http://ppod.princeton.edu) (56).
Figure 2.
Figure 2.
GTPBP10 is a mitochondrial protein that sediments with mitoribosome large and small subunits. (A) Immunoblot analyses of GTPBP10 levels in HEK293T whole cell lysate (WCL), cytoplasmic (C) and nuclear (N) fractions. Antibodies against organelle-specific proteins were used as controls. (B) Mitochondria (M) isolated from HEK293T cells were first fractionated into soluble (S) and membrane-bound (P) proteins by brief sonication and centrifugation. The pellet was submitted to alkaline carbonate extraction (pH: 11.5) to allow the separation of the extrinsic proteins present in the supernatant (CS) from the intrinsic proteins in the pellet (CP). Equivalent volumes of each fraction were analyzed by immunoblotting using antibodies against GTPBP10, the matrix-soluble protein HSP60, the extrinsic membrane-associated protein CMC1 and the inner membrane intrinsic protein COX2. (C) Proteinase K protection assay in mitochondria (Mt) and mitoplasts (Mp) prepared by hypotonic swelling of mitochondria. The samples were analyzed by immunoblotting using antibodies against GTPBP10, the matrix protein HSP60, the inner membrane protein TIM50, and the outer membrane protein TOM20. (D) Immunoblot analyses of the steady-state levels of mitoribosome LSU, SSU proteins and assembly factors in mitochondria from HEK293T, 143B and 143B-206 rho00) cells. VDAC used as a loading control. (E) Scheme of the GTPBP10 protein indicating the region truncated in the isoform 2, and the location of the GTP binding domains (G1-3). (F) Structure of the B. subtilis Obg GTP-binding protein (PDB 1LNZ) (44). The conserved Obg fold (glycine-rich domain) and GTP binding domain are indicated. The protein segment absent in GTPBP10 isoform 2 is labeled in green color. (G) Scheme of the GTPBP10 locus on human chromosome 7 depicting the two known splicing variants. (H) Sucrose gradient sedimentation analysis of GTPBP10 and mitoribosomal proteins in extracts from wild-type HEK293T or 143B mitochondria prepared in the presence of the 20 mM MgCl2. The fractions were analyzed by immunoblotting using Abs against the indicated proteins. Transparent green, blue and red colors mark the fractions where the 28S mtSSU, 39S mtLSU and 55S monosome sediment, respectively. GTPBP10 levels in each fraction was quantified by densitometric integration of the bands using the histogram panel of Adobe Photoshop and plotted as the percentage of the total signal in the bottom graphs.
Figure 3.
Figure 3.
GTPBP10 is essential for mitochondrial protein synthesis. (A) Immunoblot analysis of the steady-state levels of GTPBP10 in HEK293T (WT), heterozygous knockout (BP10-Hz) and knockout (BP10-KO) GTPBP10 clones. KO cells collected at two different passages (#1 and #2) are presented. (B) Metabolic labeling with 35S-methionine of newly synthesized mitochondrial translation products in whole cells from the indicated lines during a 30-min pulse in the presence of emetine to inhibit cytoplasmic protein synthesis. Immunoblotting for ACTIN, VDAC and TOM20 were used as loading controls. Newly-synthesized polypeptides are identified on the left. (C) Immunoblot analysis of the steady-state levels of COX2 in HEK293T wild-type (WT) and in GTPBP10 knockout (BP10-KO) cells transfected with an empty vector (EV) or a construct expressing FLAG-tagged GTPBP10. GTPBP10-FLAG was expressed under the control of either a standard human cytomegalovirus (CMV) intermediate early enhancer/promoter (plasmid pCMV6) or an attenuated CMV promoter (Δ5), generated by a deletion that eliminates a large proportion (4/5) of the transcription factor binding sites (36). (D) Metabolic labeling as in panel (B) using GTPBP10 knockout (BP10-KO) cells reconstituted with a construct expressing FLAG-tagged GTPBP10 under the control of either a standard CMV promoter (pCMV6) or a truncated promoter (Δ5). (E) Immunoblot analysis of the steady-state levels of oxidative phosphorylation complex subunits in wild-type (WT) and GTPBP10-KO HEK293T cells and GTPBP10-KO cells reconstituted with a construct expressing GTPBP10 under the control of either a standard CMV promoter (pCMV6) or the CMVΔ5 truncated promoter. NDUFA9 is a subunit of complex I, SDHA of CII, CORE2 or CIII, COX1 of CIV, ATP5α and ATP6 of the F1Fo-ATP synthase or CV. Immunoblotting for β-ACTIN and β-TUBULIN were used as loading controls. (F) Measurement of the enzymatic activity of CIV or cytochrome c oxidase (COX), expressed as the percentage of WT. Data represent the mean ± SD of three independent repetitions. (G) Immunoblot analysis of the steady-state levels of mitoribosome proteins and assembly factors in mitochondrial extracts from HEK293T (WT) and GTPBP10 knockout (BP10-KO) cell lines. HSP60 and mtHSP70 were used as loading controls.
Figure 4.
Figure 4.
GTPBP10 is required for accumulation of mitoribosome mtLSU and mtSSU subunits and fully processed rRNAs. (A) Sucrose gradient sedimentation analyses of GTPBP10 and mitoribosome mtSSU and mtLSU markers in mitochondria prepared from HEK293T (WT) or GTPBP10 knockout (KO) cells. Two exposures of the KO immunoblots (short and long) are presented. The lower panel presents the continuous RNA profile (absorbance at 254 nm) obtained during gradient collection using a Brandel fractionation system and Brandel Peak Chart Software. Transparent green, blue and red colors mark the fractions where the 28S mtSSU, 39S mtLSU and 55S monosome sediment, respectively. (B) Immunoblot analysis of GTPBP10 and mitoribosome protein levels in fractions from the sucrose gradients presented in panel (A) where the non-assembled subunits (N-A, fractions 1–3), mtSSU (fractions 6–7), mtLSU (fractions 8–9), and monosome (fractions 10–12) peak. Equal volumes of fractions corresponding to each cell line were loaded. (C) Northern blot analyses of the steady-state levels of mitochondrial rRNAs in WT or the GTPBP10-KO clone. Multiple experimental repetitions (Exp) and X-ray film exposures are presented to display the steady-state levels of 12S-16S precursor transcript, 12S and 16S unprocessed and fully processed transcripts. The graphs on the right show the densitometry values normalized by the signal of ACTIN rRNA and expressed relative to the WT. Data represent the mean ± SD of three independent repetitions. (D) Quantitative PCR (qPCR) analyses of the steady-state levels of several mtDNA-encoded mRNAs (ND1, CYTB, COX1, COX2 and ATP6) and tRNAs (tRNA-Val and tRNA-Ala) in WT and the GTPBP10-KO clone. Data represent the mean ± SD from three independent experiments.
Figure 5.
Figure 5.
The absence of GTPBP10 alters the abundance and composition of the mtLSU and mtSSU proteomes. (A) Identity and abundance of mitoribosome proteins and assembly factors that accumulate in mitoribosome particles in mitochondrial extracts from WT and GTPBP10-KO HEK293T cells, following their accumulation in the fractions from sucrose gradient sedimentation studies presented in Figure 4A. The proteins in the fractions in which the mtSSU (fractions 6), mtLSU (fractions 8), and monosome (fractions 11) peak, were precipitated using methanol-chloroform and identified by mass spectrometry. The bar graphs represent the total unique spectral count difference between WT and GTPBP10-KO normalized by the WT count. Results represent the average ± SD of three independent repetitions. Mitoribosome proteins are identified at the bottom. (B) Accumulation of mitoribosome SSU and LSU assembly factors in the fractions corresponding to each subunit, analyzed by mass spectrometry in panel (A). Data represent the average ± SD of total unique spectral counts in WT and GTPBP10-KO samples from three independent repetitions. T-test: *P <0.05; **P <0.01, ***P <0.001.
Figure 6.
Figure 6.
GTPBP10 directly interacts with the 16S rRNA and mtLSU proteins. (A and B) Knockdown (KD) of mitoribosome assembly factors and mitoribosome subunits in HEK293T cells using siRNAs for 8-9 days, verified by immunoblotting of whole cell lysates. (A) Representative image of immunoblot analysis of the steady-state levels of mitoribosome proteins after silencing of target proteins. None is a mock consisting of only transfection reagent. siRNA-NT is a non-targeting silencing control. Antibodies are listed on the right side, and VDAC was used as a loading control. (B) Following analysis in panel (A), the densitometric data obtained on the abundance of mitoribosome proteins and assembly factors accumulated after silencing of each target protein was used for cluster analysis (see Methods). The heat map, generated with the R studio software, represents a log 2 scale of the normalized average levels of ratio to control (NT) in three independent repetitions of immunoblotting analyses. 2-way ANOVA followed by a Dunnett's multiple comparisons test: *P < 0.05; **P < 0.01; ***P < 0.001; ****P < 0.0001). (C) Co-immunoprecipitation analysis of GTPBP10-FLAG and interacting mitoribosome proteins and assembly factors in whole cell lysates prepared in the presence of 1% NP40, by using anti-FLAG agarose beads (FLAG) or plain beads as control (CTRL). In, input. FT, flow through or unbound. B is bound. (D) qPCR analyses of reverse-transcribed control or GTPBP10-FLAG co-immunopurified RNAs after 4-thiouridine (4SU) treatment and either UV-mediated protein-RNA crosslinking (CL) or not crosslinking. (E and F) Analysis of GTPBP10 directly interacting partners by using a non-cleavable crosslinker, DSG (disuccinimidyl glutarate). Mitochondria purified from cells stably expressing GTPBP10-FLAG were incubated in the presence of DSG or DMSO as a negative control, pulled-down with anti-FLAG-agarose beads and analyzed by SDS-PAGE. After Coomassie staining, bands of ∼ 75 kDa and ∼95 kDa observed only in the crosslinked-IPed sample were cut, and its composition analyzed by mass spectrometry. The table in panel (F) presents the proteins identified in three independent experiments, sorted by their Mascot score. (G) Mitoribosome proteins listed in panel (F) mapped to the human mitoribosome structure (PDB 3J9M) (3).

References

    1. Greber B.J., Bieri P., Leibundgut M., Leitner A., Aebersold R., Boehringer D., Ban N.. Ribosome. The complete structure of the 55S mammalian mitochondrial ribosome. Science. 2015; 348:303–308. - PubMed
    1. Greber B.J., Boehringer D., Leibundgut M., Bieri P., Leitner A., Schmitz N., Aebersold R., Ban N.. The complete structure of the large subunit of the mammalian mitochondrial ribosome. Nature. 2014; 515:283–286. - PubMed
    1. Amunts A., Brown A., Toots J., Scheres S.H.W., Ramakrishnan V.. The structure of the human mitochondrial ribosome. Science. 2015; 348:95–98. - PMC - PubMed
    1. Brown A., Amunts A., Bai X.C., Sugimoto Y., Edwards P.C., Murshudov G., Scheres S.H., Ramakrishnan V.. Structure of the large ribosomal subunit from human mitochondria. Science. 2014; 46:718–722. - PMC - PubMed
    1. Kim H.J., Maiti P., Barrientos A.. Mitochondrial ribosomes in cancer. Semin. Cancer Biol. 2017; 47:67–81. - PMC - PubMed

Publication types