. 2018 Oct 12;19(10):3128.
doi: 10.3390/ijms19103128.

Pharmacological Inhibition of Class IIA HDACs by LMK-235 in Pancreatic Neuroendocrine Tumor Cells

Affiliations

Pharmacological Inhibition of Class IIA HDACs by LMK-235 in Pancreatic Neuroendocrine Tumor Cells

Julia Wanek et al. Int J Mol Sci. .

Abstract

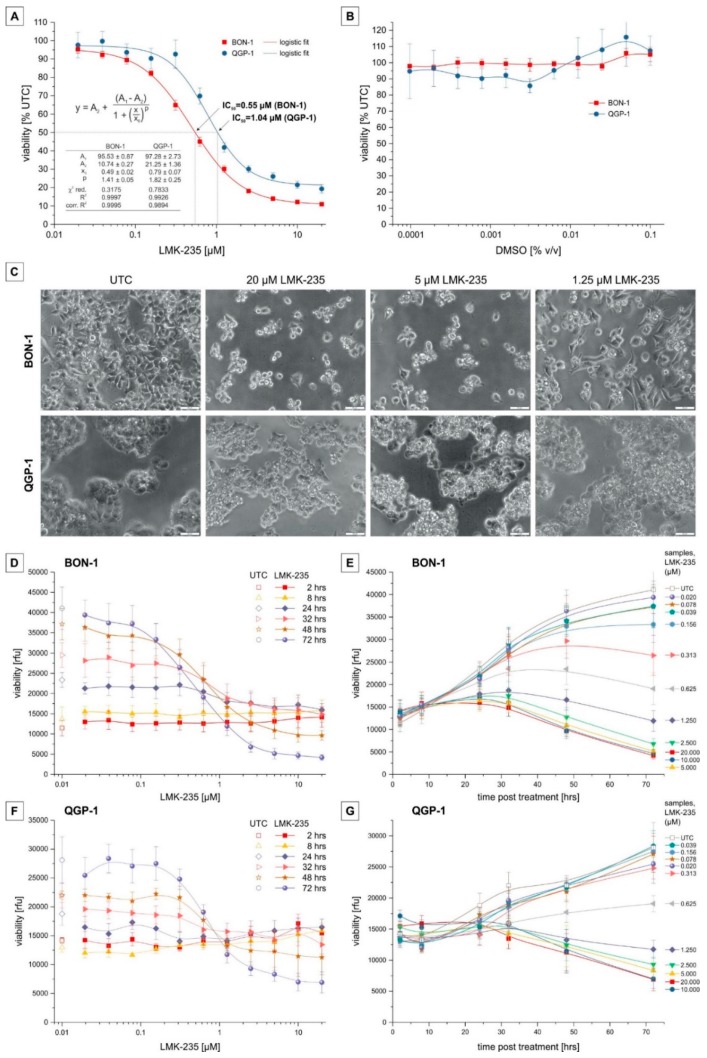
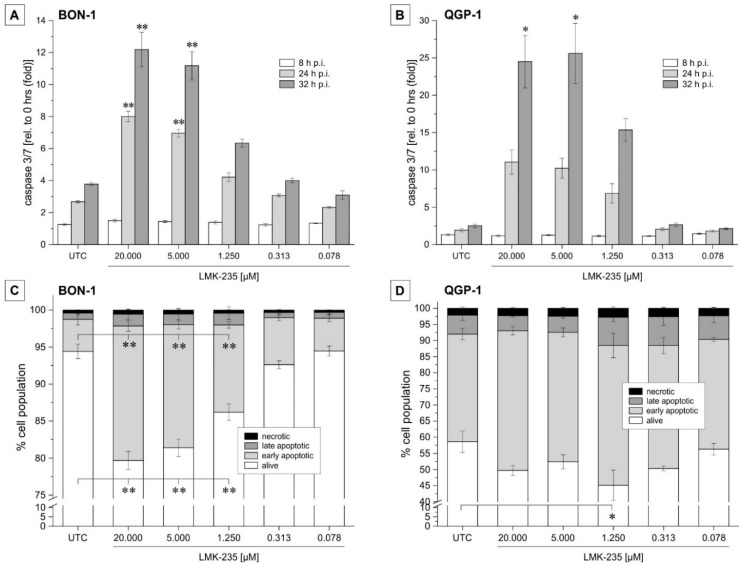
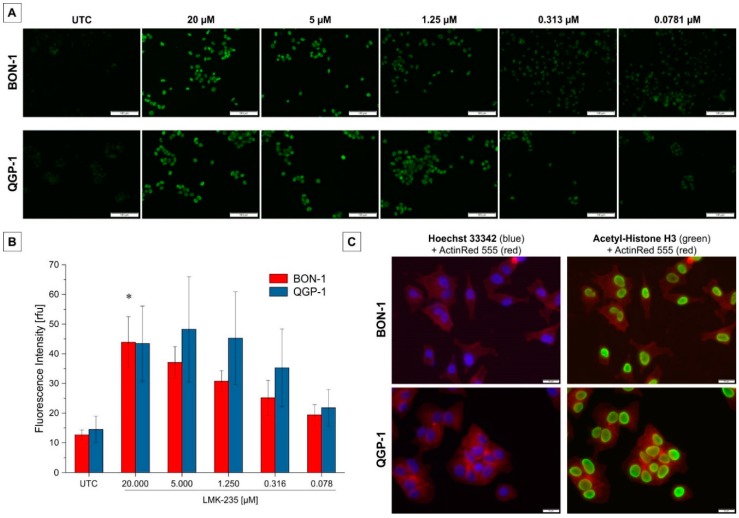
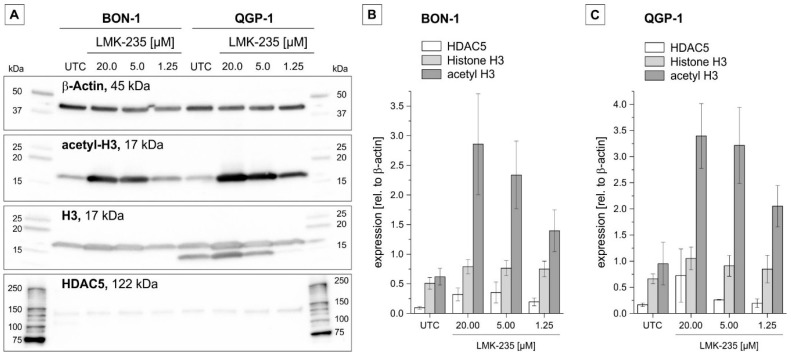
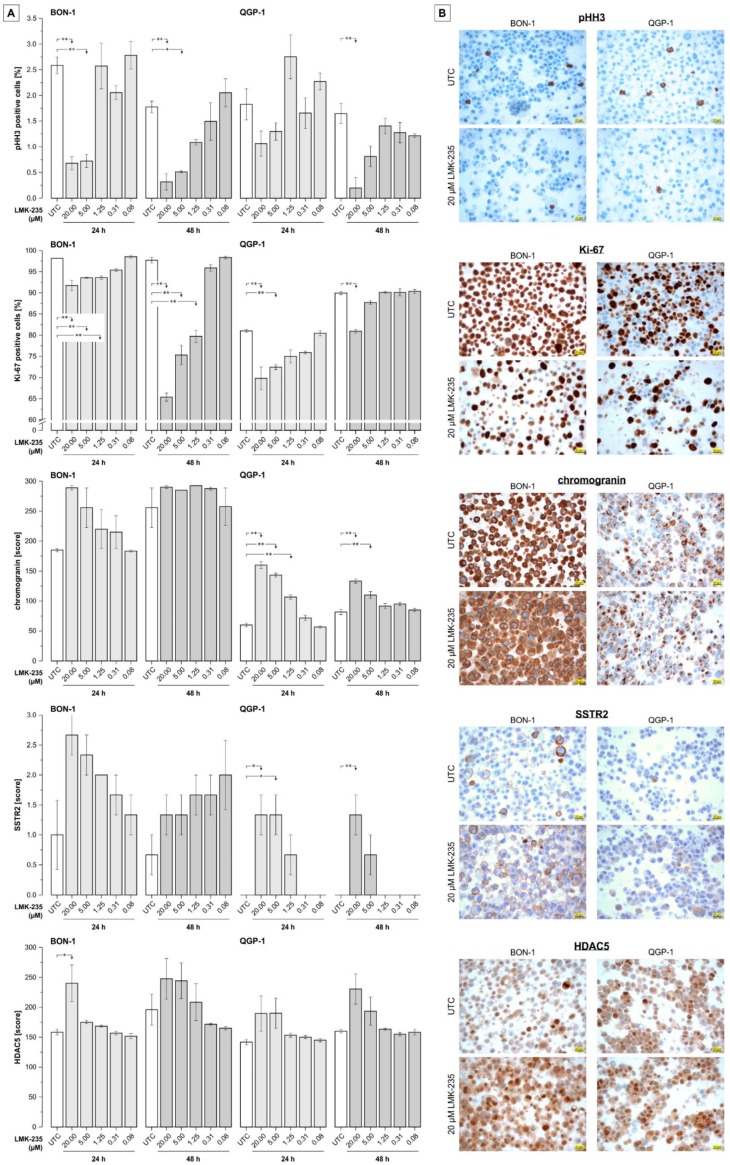
Histone deacetylases (HDACs) play a key role in epigenetic mechanisms in health and disease and their dysfunction is implied in several cancer entities. Analysis of expression patterns in pancreatic neuroendocrine tumors (pNETs) indicated HDAC5 to be a potential target for future therapies. As a first step towards a possible treatment, the aim of this study was to evaluate the in vitro cellular and molecular effects of HDAC5 inhibition in pNET cells. Two pNET cell lines, BON-1 and QGP-1, were incubated with different concentrations of the selective class IIA HDAC inhibitor, LMK-235. Effects on cell viability were determined using the resazurin-assay, the caspase-assay, and Annexin-V staining. Western Blot and immunofluorescence microscopy were performed to assess the effects on HDAC5 functionality. LMK-235 lowered overall cell viability by inducing apoptosis in a dose- and time-dependent manner. Furthermore, acetylation of histone-H3 increased with higher LMK-235 concentrations, indicating functional inhibition of HDAC4/5. Immunocytochemical analysis showed that proliferative activity (phosphohistone H3 and Ki-67) decreased at highest concentrations of LMK-235 while chromogranin and somatostatin receptor 2 (SSTR2) expression increased in a dose-dependent manner. HDAC5 expression was found to be largely unaffected by LMK-235. These findings indicate LMK-235 to be a potential therapeutic approach for the development of an effective and selective pNET treatment.

Keywords: LMK-235; apoptosis; cytotoxicity; histone deacetylases; pancreatic neuroendocrine tumors.


Conflict of interest statement

The authors declare no conflict of interest.

Figures

Figure 1
Figure 1
Cytotoxicity of LMK-235 on BON-1 and QGP-1. BON-1 and QGP-1 were incubated with different LMK-235 concentrations for up to 72 h. Viability was measured by the resazurin assay and displayed either as the percentage of untreated control (UTC) or relative fluorescence units (rfu). (A,B) 72 h treatment with a serial dilution of LMK-235 between 0.02–20 µM (A) for BON-1 (red; n = 9) and QGP-1 (blue; n = 8) cells and corresponding DMSO concentrations (B; n = 3). Data points represent mean ± SEM, fitted based on a logistic fit function (A). (C) Phase contrast images (200× magnification) of BON-1 and QGP-1 treated for 72 h with 20, 5, and 1.25 µM LMK-235. Scale bar indicates 50 µm. (D,F) Cell viability displayed as absolute fluorescence units for BON-1 (D) and QGP-1 (F) incubated for different periods (2, 8, 24, 32, 48, 72 h) with LMK-235 concentrations ranging from 0.02 to 20 µM. (E,G) Cell viability displayed as absolute fluorescence units for BON-1 (E) and QGP-1 (G) treated with different LMK-235 concentrations (0.02–20 µM) for 2, 8, 24, 32, 48, or 72 h. (DG) Data points represent means ± SEM of three experiments, interpolated with a B-spline function. Abbreviations: UTC = untreated control, rfu = relative fluorescence units.
Figure 2
Figure 2
LMK-235 effects on apoptosis induction in pNET cells. (A,B) BON-1 (A) and QGP-1 (B) were incubated for 8, 24, and 32 h with different LMK-235 concentrations (0.078–20 µM). Relative changes in caspase activity were measured as a parameter for treatment-induced apoptosis. Bars represent mean ± SEM for n = 4 experiments. (C,D) Flow cytometry results of Annexin V/7-AAD staining are shown for BON-1 (C) and QGP-1 (D). Bars represent the cumulative percentages (n = 3) for alive, early, or late apoptotic and necrotic cells when treated for 24 h with LMK-235 (0.078–20 µM). Asterisks indicate p-values of <0.05 (one) or <0.01 (two) versus corresponding untreated control. Abbreviations: p.i. = post incubation, UTC = untreated control.
Figure 3
Figure 3
Acetyl-H3 immunofluorescence following LMK-235 treatment. (A) Results of one representative acetylated H3 immunofluorescence staining is shown for a LMK-235 dilution series for both cell lines. All samples were visualized using the same exposure time. Acetylated histone H3 is stained in green and the scale bar indicates 100 µm. Magnification 100×. (B) Quantitative immunofluorescence intensities are represented as bars for mean ± SEM. * indicate p < 0.05. (C) Overlay of ActinRed (red, cytoskeleton) with Hoechst 33342 (blue, nuclei) or acetyl-H3 (green) staining demonstrating the localization of acetyl-H3 staining exclusively in the cells’ nuclei. Magnification 200×. Abbreviations: UTC = untreated control.
Figure 4
Figure 4
(Acetyl-) Histone H3 and histone deacetylase-5 protein expression following LMK-235 treatment. (A) Levels of acetyl-histone H3, histone H3, and HDAC5 were evaluated by immunoblotting after LMK-235 incubation for 24 h, as shown by one representative example blot. β-actin was used as a loading control for each sample. The β-actin expression corresponding to the HDAC5 blot is not shown. (B,C): Bars represent the semi-quantitative expression as mean values ± SEM (n = 3) of band intensities of BON-1 (B) and QGP-1 (C) cells. Abbreviations: UTC = untreated control.
Figure 5
Figure 5
Immunocytochemistry on cell blocks of LMK-235-treated pNET cells. (A) Semiquantitative evaluation of immunostaining for phosphohistone H3 (pHH3) and Ki-67 (% positive cells), chromogranin (score, based on multiplication of intensity and extensity; 0–300), SSTR2 (score; 0–3), and histone deacetylase-5 (HDAC5 score; 0–300). Cells were treated with 0.08–20 µM LMK-235 for 24 or 48 h and results represent mean values ± SEM of three independent images. Asterisks indicate p-values of <0.05 (one) or <0.01 (two) for comparison of treatments versus the corresponding untreated control (statistical results for group comparisons within treatments are not shown). (B). Representative images of the immunostainings for UTC and LMK-235-treated (20 µM, 24 h) samples. Magnification 400× for all images, scale bars indicates 20 µm. Abbreviations: UTC = untreated control.

References

    1. Schimmack S., Svejda B., Lawrence B., Kidd M., Modlin I.M. The diversity and commonalities of gastroenteropancreatic neuroendocrine tumors. Langenbecks Arch. Surg. 2011;396:273–298. doi: 10.1007/s00423-011-0739-1. - DOI - PubMed
    1. Lawrence B., Gustafsson B.I., Chan A., Svejda B., Kidd M., Modlin I.M. The epidemiology of gastroenteropancreatic neuroendocrine tumors. Endocrinol. Metab. Clin. N. Am. 2011;40:1–18. doi: 10.1016/j.ecl.2010.12.005. - DOI - PubMed
    1. Modlin I.M., Oberg K., Chung D.C., Jensen R.T., de Herder W.W., Thakker R.V., Caplin M., Delle Fave G., Kaltsas G.A., Krenning E.P., et al. Gastroenteropancreatic neuroendocrine tumours. Lancet Oncol. 2008;9:61–72. doi: 10.1016/S1470-2045(07)70410-2. - DOI - PubMed
    1. Bosman F.T., Carneiro F., Hruban R.H., Theise N.D. WHO Classification of Tumours of the Digestive System. 4th ed. WHO Press World Health Organization; Geneva, Switzerland: 2010. Nomenclature and classification of neuroendocrine neoplasms of the digestive system; pp. 13–14.
    1. Öberg K., Knigge U., Kwekkeboom D., Perren A. Neuroendocrine gastro-entero-pancreatic tumors: Esmo clinical practice guidelines for diagnosis, treatment and follow-up. Ann. Oncol. 2012;23(Suppl. 7):124–130. - PubMed

MeSH terms