

Transcriptome Profiling Reveals Transcriptional Regulation by DNA Methyltransferase Inhibitor 5-Aza-2'-Deoxycytidine Enhancing Red Pigmentation in Bagged "Granny Smith" Apples (Malus domestica)
- PMID: 30322020
- PMCID: PMC6213223
- DOI: 10.3390/ijms19103133
Transcriptome Profiling Reveals Transcriptional Regulation by DNA Methyltransferase Inhibitor 5-Aza-2'-Deoxycytidine Enhancing Red Pigmentation in Bagged "Granny Smith" Apples (Malus domestica)
Abstract
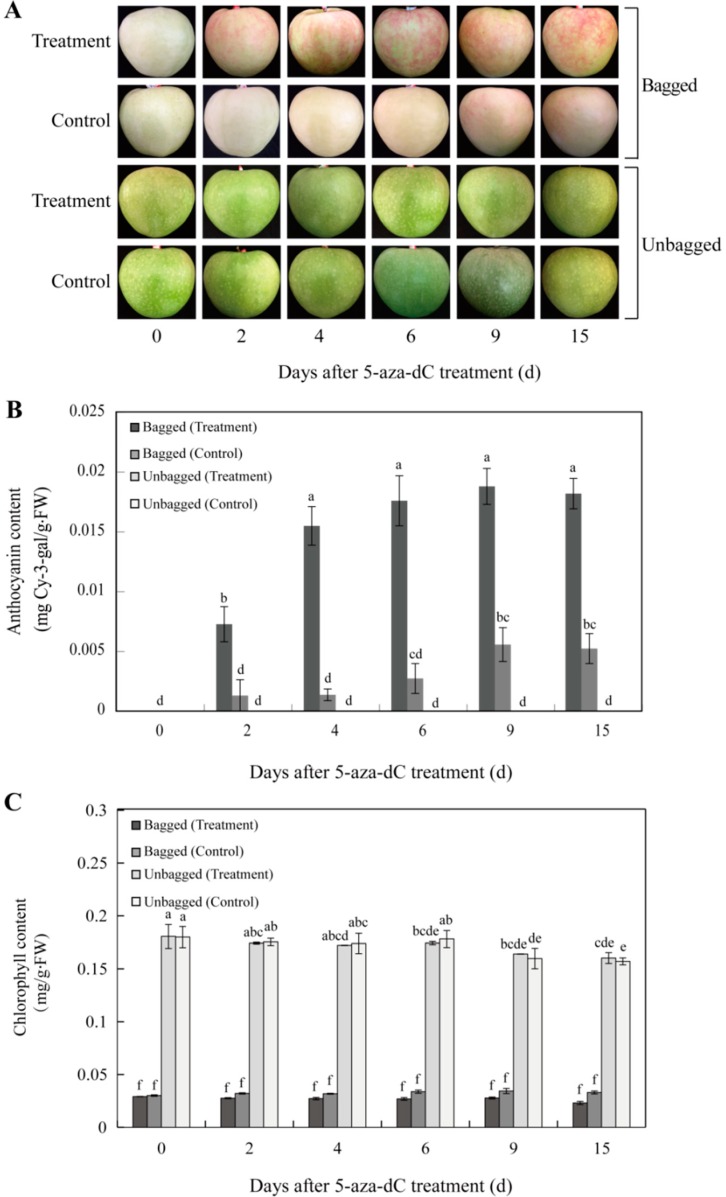
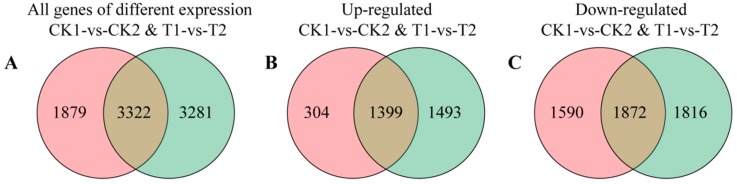
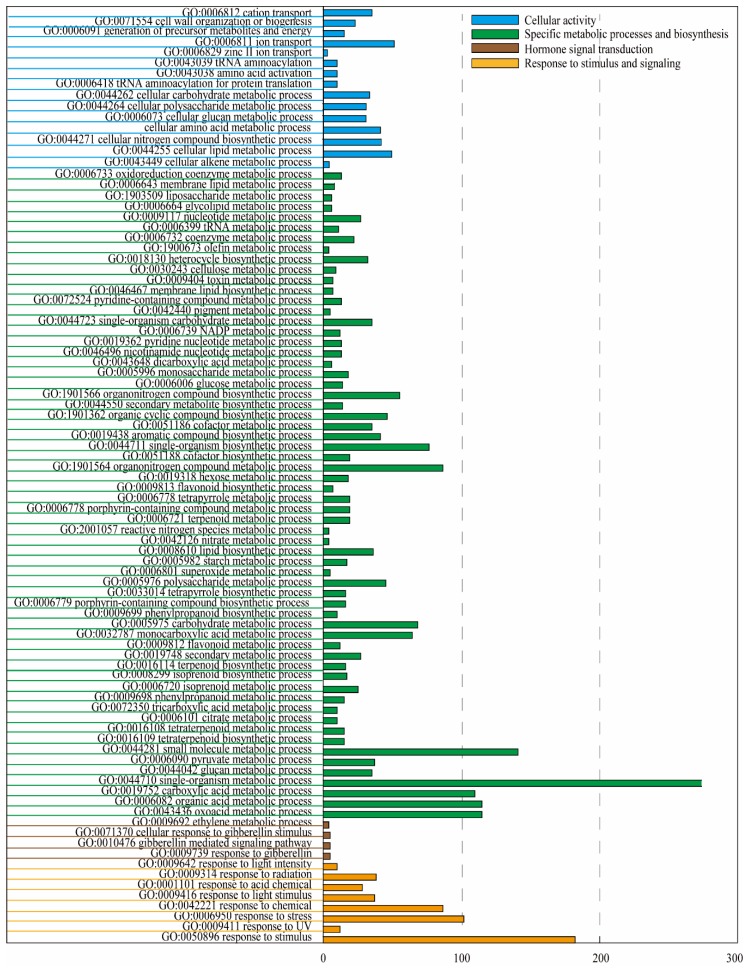
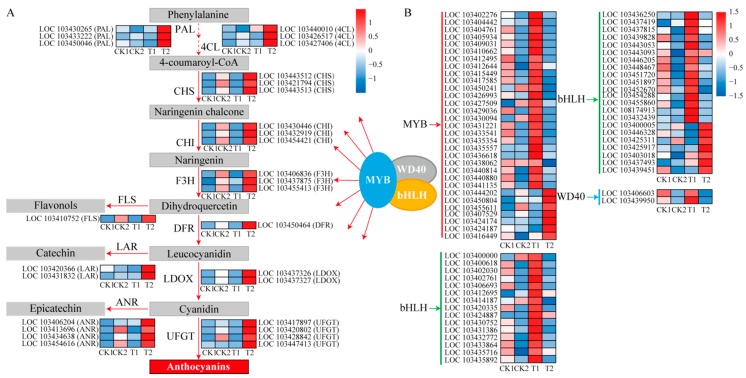
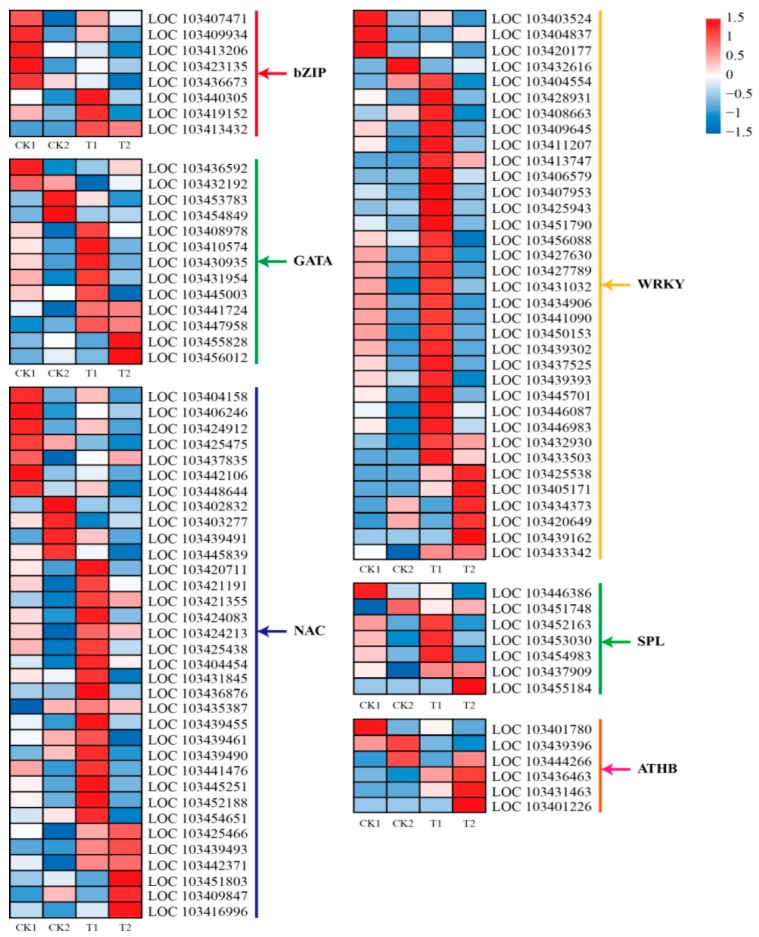
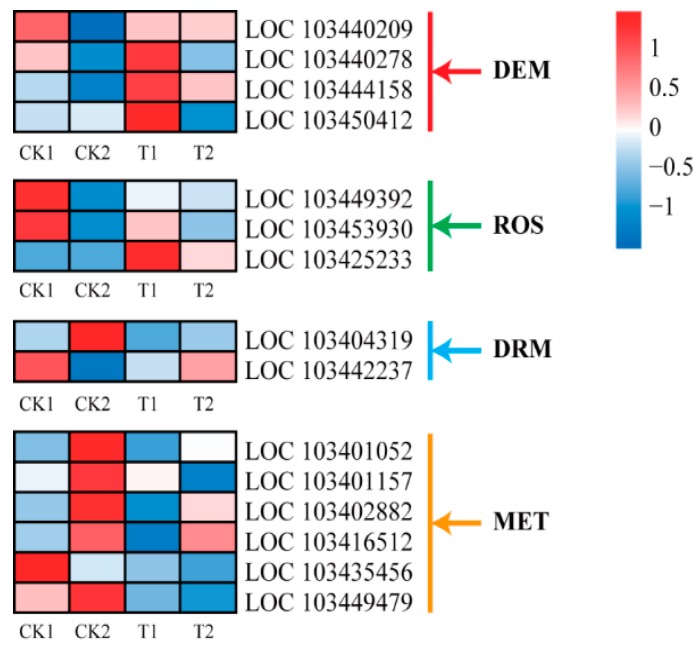
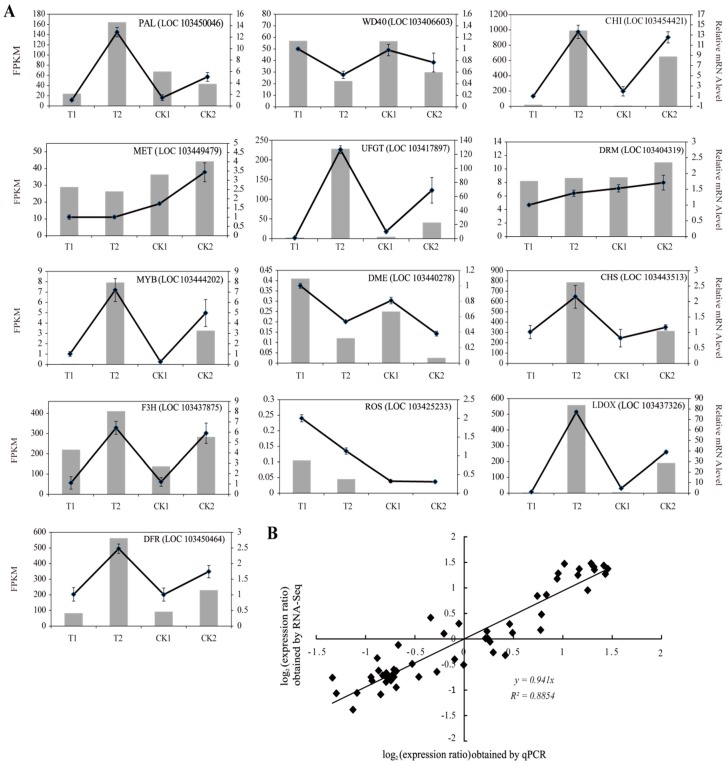
The red color of apples (Malus domestica) is an attractive trait for consumers. The green skinned "Granny Smith" cultivar develops red pigmentation after bagging treatment. DNA methylation plays an important role in various developmental processes in plants. To explore the possible functions of DNA methylation in the pigmentation of bagged "Granny Smith" apples, we first analyzed the anthocyanin content of fruit skin following treatment with the DNA methyltransferase inhibitor 5-aza-2'-deoxycytidine (5-aza-dC). The results revealed an increase in anthocyanin content in bagged fruits following 5-aza-dC treatment, while no anthocyanins were detected in unbagged fruits. In addition, 8482 differentially expressed genes between 5-aza-dC-treated and control groups were identified in bagged fruits by RNA sequencing, including genes encoding transcription factors, enzymes related to anthocyanin accumulation, and methylases. Changes in the expression of these genes may be responsible for 5-aza-dC-induced red pigmentation in bagged fruits of "Granny Smith". The findings provide novel evidence for the involvement of DNA methylation in the red pigmentation of non-red-skinned apples.
Keywords: 5-aza-dC; DNA methylation; Granny Smith; MYB; anthocyanin; transcriptome.
Conflict of interest statement
The authors declare no conflict of interest.
Figures
Similar articles
-
Transcriptome profiling of anthocyanin biosynthesis in the peel of 'Granny Smith' apples (Malus domestica) after bag removal.BMC Genomics. 2019 May 9;20(1):353. doi: 10.1186/s12864-019-5730-1. BMC Genomics. 2019. PMID: 31072309 Free PMC article.
-
The effect of promoter methylation on MdMYB1 expression determines the level of anthocyanin accumulation in skins of two non-red apple cultivars.BMC Plant Biol. 2018 Jun 5;18(1):108. doi: 10.1186/s12870-018-1320-7. BMC Plant Biol. 2018. PMID: 29871614 Free PMC article.
-
Fruit coloration and anthocyanin biosynthesis after bag removal in non-red and red apples (Malus × domestica Borkh.).Molecules. 2013 Jan 25;18(2):1549-63. doi: 10.3390/molecules18021549. Molecules. 2013. PMID: 23353125 Free PMC article.
-
Research progress of fruit color development in apple (Malus domestica Borkh.).Plant Physiol Biochem. 2021 May;162:267-279. doi: 10.1016/j.plaphy.2021.02.033. Epub 2021 Mar 4. Plant Physiol Biochem. 2021. PMID: 33711720 Review.
-
Review: The effects of hormones and environmental factors on anthocyanin biosynthesis in apple.Plant Sci. 2021 Nov;312:111024. doi: 10.1016/j.plantsci.2021.111024. Epub 2021 Aug 15. Plant Sci. 2021. PMID: 34620429 Review.
Cited by
-
A Data Driven Approach to Assess Complex Colour Profiles in Plant Tissues.Front Plant Sci. 2022 Jan 26;12:808138. doi: 10.3389/fpls.2021.808138. eCollection 2021. Front Plant Sci. 2022. PMID: 35154203 Free PMC article.
-
The R2R3-type MYB transcription factor MdMYB90-like is responsible for the enhanced skin color of an apple bud sport mutant.Hortic Res. 2021 Jul 1;8(1):156. doi: 10.1038/s41438-021-00590-3. Hortic Res. 2021. PMID: 34193856 Free PMC article.
-
Study on the dynamics of fruits color related genes and metabolites during the fruit development of Zanthoxylum bungeanum 'Hanyuan'.BMC Plant Biol. 2025 Jul 26;25(1):960. doi: 10.1186/s12870-025-06962-4. BMC Plant Biol. 2025. PMID: 40713503 Free PMC article.
-
Methylation level of potato gene OMT30376 regulates tuber anthocyanin transformations.Front Plant Sci. 2022 Oct 7;13:1021617. doi: 10.3389/fpls.2022.1021617. eCollection 2022. Front Plant Sci. 2022. PMID: 36275587 Free PMC article.
-
Developmental processes in the Rosaceae through the lens of DNA and RNA methylation.Planta. 2025 Feb 8;261(3):54. doi: 10.1007/s00425-025-04623-2. Planta. 2025. PMID: 39921711 Free PMC article. Review.
References
-
- Van Nocker S., Berry G., Najdowski J., Michelutti R., Luffman M., Forsline P., Alsmairat N., Beaudry R., Nair M.G., Ordidge M. Genetic diversity of red-fleshed apples (Malus) Euphytica. 2012;185:281–293. doi: 10.1007/s10681-011-0579-7. - DOI
-
- Weisel T., Baum M., Eisenbrand G., Dietrich H., Will F., Stockis J.P., Kulling S., Rüfer C., Johannes C., Janzowski C. An anthocyanin/polyphenolic-rich fruit juice reduces oxidative DNA damage and increases glutathione level in healthy probands. Biotechnol. J. 2006;1:388–397. doi: 10.1002/biot.200600004. - DOI - PubMed
MeSH terms
Substances
Grants and funding
LinkOut - more resources
Full Text Sources
