. 2018 Oct 12;23(10):2616.
doi: 10.3390/molecules23102616.

Role of Extracellular Loops and Membrane Lipids for Ligand Recognition in the Neuronal Adenosine Receptor Type 2A: An Enhanced Sampling Simulation Study

Affiliations

Role of Extracellular Loops and Membrane Lipids for Ligand Recognition in the Neuronal Adenosine Receptor Type 2A: An Enhanced Sampling Simulation Study

Ruyin Cao et al. Molecules. .

Abstract

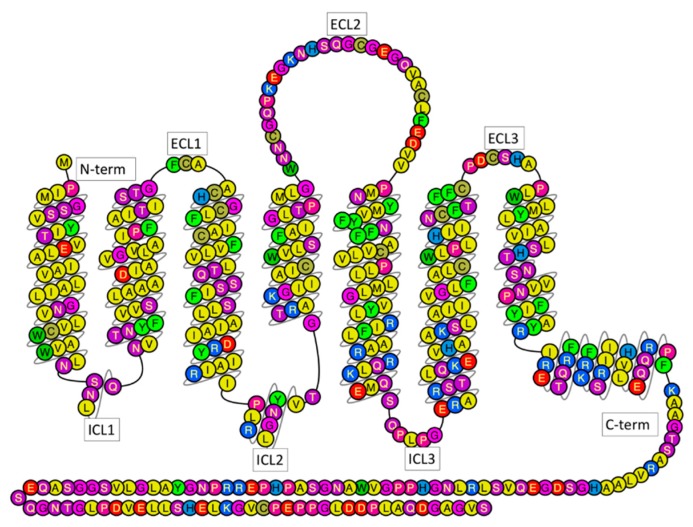
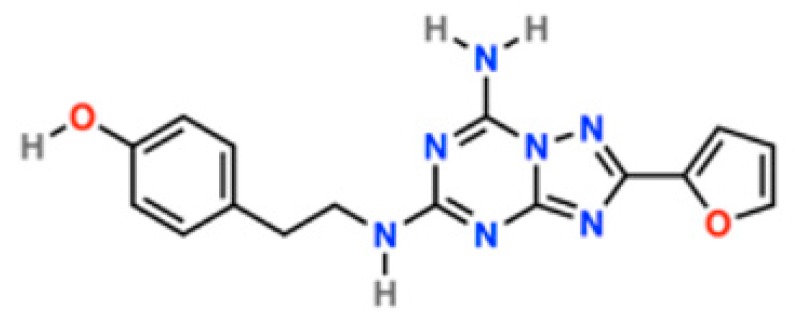
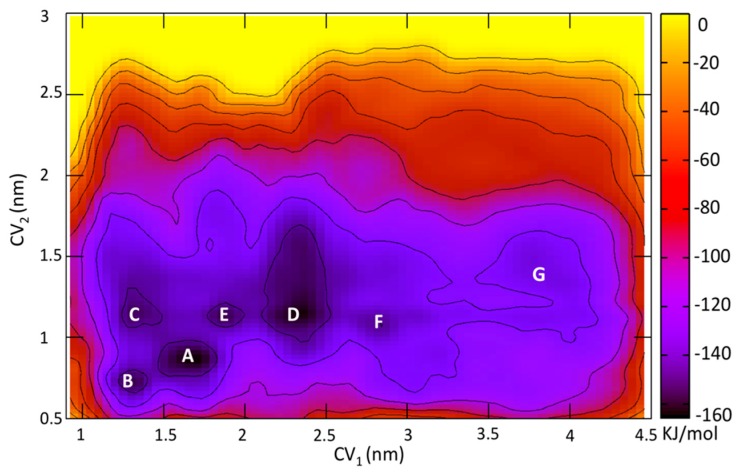
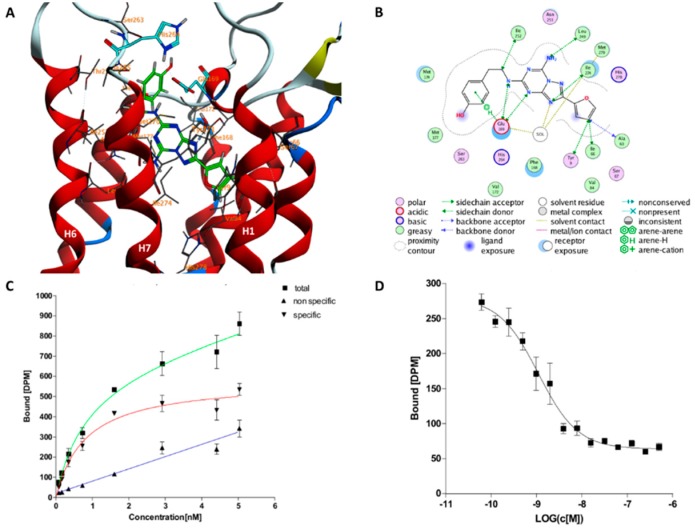
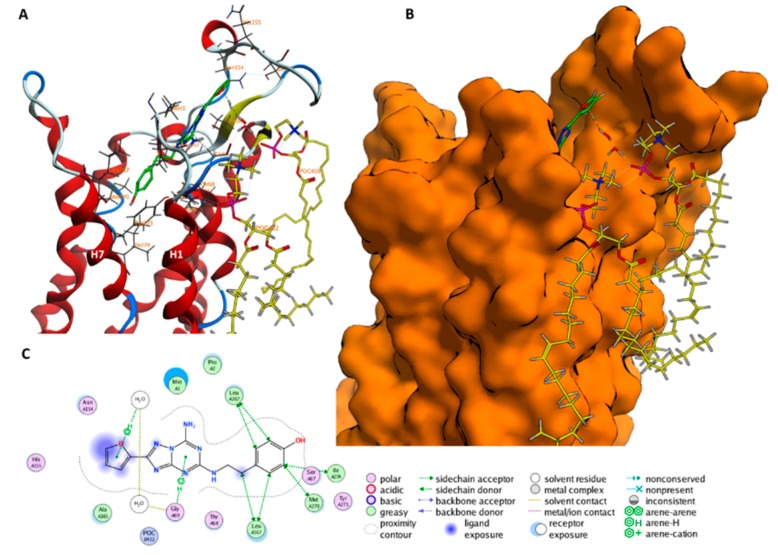
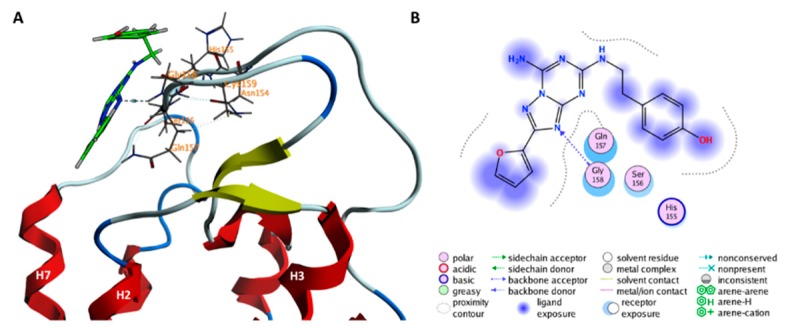
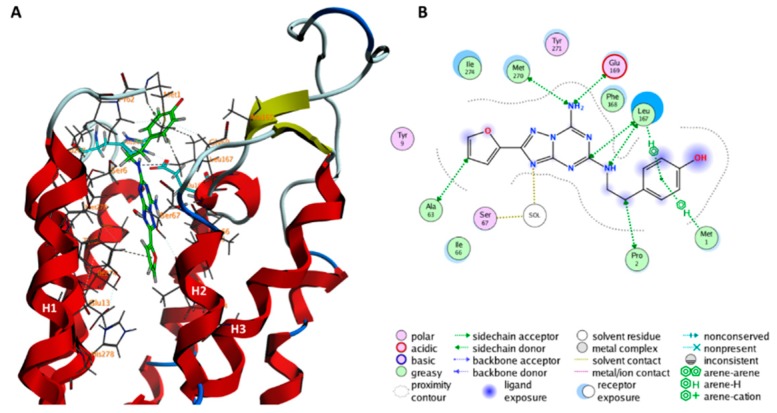
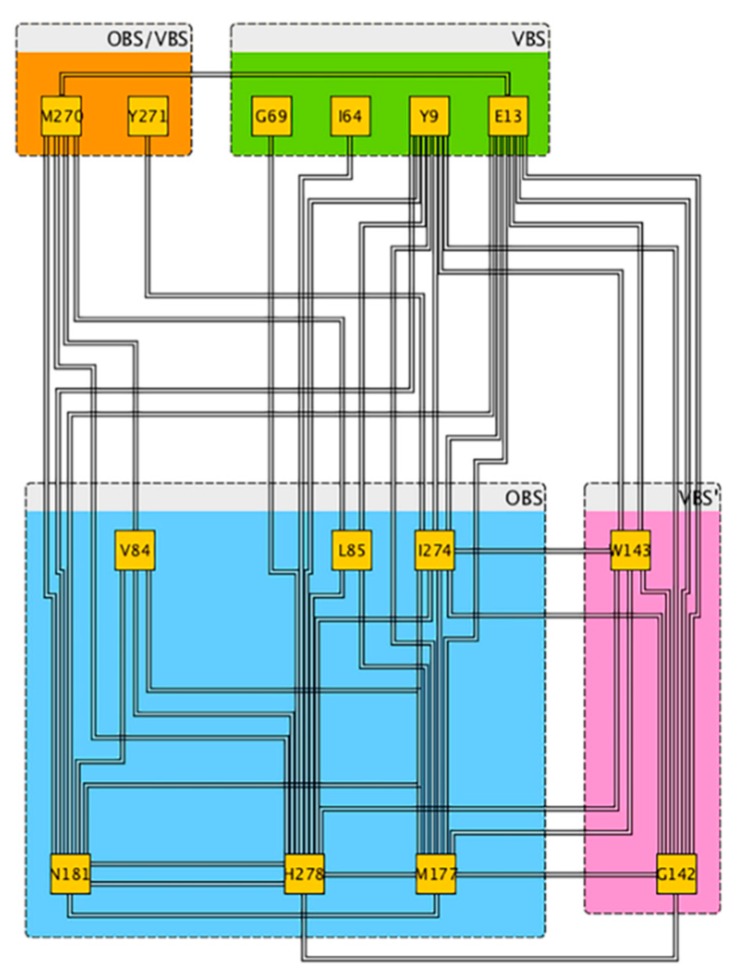
Human G-protein coupled receptors (GPCRs) are important targets for pharmaceutical intervention against neurological diseases. Here, we use molecular simulation to investigate the key step in ligand recognition governed by the extracellular domains in the neuronal adenosine receptor type 2A (hA2AR), a target for neuroprotective compounds. The ligand is the high-affinity antagonist (4-(2-(7-amino-2-(furan-2-yl)-[1,2,4]triazolo[1,5-a][1,3,5]triazin-5-ylamino)ethyl)phenol), embedded in a neuronal membrane mimic environment. Free energy calculations, based on well-tempered metadynamics, reproduce the experimentally measured binding affinity. The results are consistent with the available mutagenesis studies. The calculations identify a vestibular binding site, where lipids molecules can actively participate to stabilize ligand binding. Bioinformatic analyses suggest that such vestibular binding site and, in particular, the second extracellular loop, might drive the ligand toward the orthosteric binding pocket, possibly by allosteric modulation. Taken together, these findings point to a fundamental role of the interaction between extracellular loops and membrane lipids for ligands' molecular recognition and ligand design in hA2AR.

Keywords: adenosine receptor; allosterism; extracellular loops; metadynamics.


Conflict of interest statement

The authors declare no conflict of interest.

Figures

Figure 1
Figure 1
Snake view of hA2AR sequence, generated by GPCRDB [16]. Residues are colored differently depending on their polarity.
Figure 2
Figure 2
ZMA chemical structure, drawn with Maestro [33].
Figure 3
Figure 3
Free-energy surface associated with ZMA/hA2AR interactions, as a function of collective variables, CV1—a measure of ligand-OBS distance and CV2—a measure of the E169ECL2–H2647.29 distance. The figure shows the minima associated with the ligand located in the OBS AC, in the vestibular binding site D in the salt bridge E and in a solvent-exposed moiety of the ECL2 F. In the OBS, the free energy in B and C are higher than that in A by 10.0 and 14.6 kJ/mol, respectively. G indicates the unbound state.
Figure 4
Figure 4
Lowest energy binding pose of ZMA in the orthosteric binding site (OBS, minimum A in Figure 3) in 3D (A) and 2D (B) representation. In (A) the protein backbone is render as cartoon, ZMA is shown as a green licorice, residues interacting with ZMA are shown as gray lines. The E169ECL2-H2647.29 salt bridge is shown in cyan licorice. Hydrogen, oxygen, and nitrogen atoms are specifically colored in white, red, and light blue, respectively. (B) 2D scheme of these binding pose in (A). Saturation binding assay result (C) and competition binding assay result (D) of ZMA/hA2AR complex as performed in this work. The other two binding poses of ZMA in B and C minima are shown in Figure S3.
Figure 5
Figure 5
ZMA binding poses in the minimum D of Figure 3 is shown in the (AC) panels as 3D, surface, and 2D representation, respectively. In (A) the protein backbone is rendered as a cartoon, ZMA and POPC molecules are shown as a green and yellow licorice, respectively, residues interacting with ZMA are shown as gray lines. Hydrogen, oxygen and nitrogen atoms are specifically colored in white, red and light blue, respectively. In (B) the solid protein surface, based on Van der Waal atom radii, is shown in orange.
Figure 6
Figure 6
ZMA binding poses in the minimum F of Figure 1 are shown in the (A,B) panels, as 3D and 2D representation, respectively. In (A) the protein backbone is render as cartoon, ZMA is shown as a green licorice, residues interacting with ZMA are shown as gray lines. Hydrogen, oxygen, and nitrogen atoms are specifically colored in white, red, and light blue, respectively.
Figure 7
Figure 7
ZMA binding poses in the minimum E of Figure 3 is shown in (A,B) panels, as 3D and 2D representation, respectively. In (A) the protein backbone is render as cartoon, ZMA is shown as a green licorice, residues interacting with ZMA are shown as gray lines. The E169ECL2 and H2647.29 residues are shown in cyan licorice. Hydrogen, oxygen and nitrogen atoms are specifically colored in white, red and light blue, respectively.
Figure 8
Figure 8
Coevolution relationships between amino acids of the relevant regions studied in this article (Table S4) based on Coeviz web server analyses [46].

References

    1. Fredholm B.B., IJzerman A.P., Jacobson K.A., Klotz K.N., Linden J. International Union of Pharmacology. XXV. Nomenclature and classification of adenosine receptors. Pharmacol. Rev. 2001;53:527–552. - PMC - PubMed
    1. Kroeze W.K., Sheffler D.J., Roth B.L. G-protein-coupled receptors at a glance. J. Cell Sci. 2003;116:4867–4869. doi: 10.1242/jcs.00902. - DOI - PubMed
    1. Schöneberg T., Schulz A., Biebermann H., Hermsdorf T., Römpler H., Sangkuhl K. Mutant G-protein-coupled receptors as a cause of human diseases. Pharmacol. Ther. 2004;104:173–206. doi: 10.1016/j.pharmthera.2004.08.008. - DOI - PubMed
    1. Fink J.S., Weaver D.R., Rivkees S.A., Peterfreund R.A., Pollack A.E., Adler E.M., Reppert S.M. Molecular cloning of the rat A2 adenosine receptor: Selective co-expression with D2 dopamine receptors in rat striatum. Brain Res. Mol. Brain Res. 1992;14:186–195. doi: 10.1016/0169-328X(92)90173-9. - DOI - PubMed
    1. Xu K., Bastia E., Schwarzschild M. Therapeutic potential of adenosine A(2A) receptor antagonists in Parkinson’s disease. Pharmacol. Ther. 2005;105:267–310. doi: 10.1016/j.pharmthera.2004.10.007. - DOI - PubMed

LinkOut - more resources