. 2018 Oct 16;6(1):104.
doi: 10.1186/s40478-018-0606-1.

Modulation of astrocyte reactivity improves functional deficits in mouse models of Alzheimer's disease

Affiliations

Modulation of astrocyte reactivity improves functional deficits in mouse models of Alzheimer's disease

Kelly Ceyzériat et al. Acta Neuropathol Commun. .

Abstract

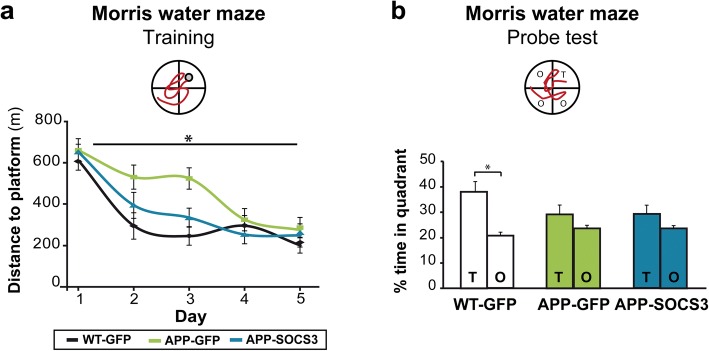
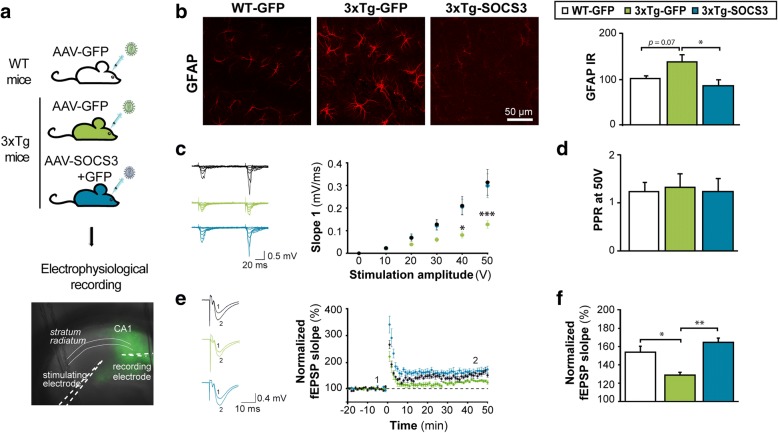
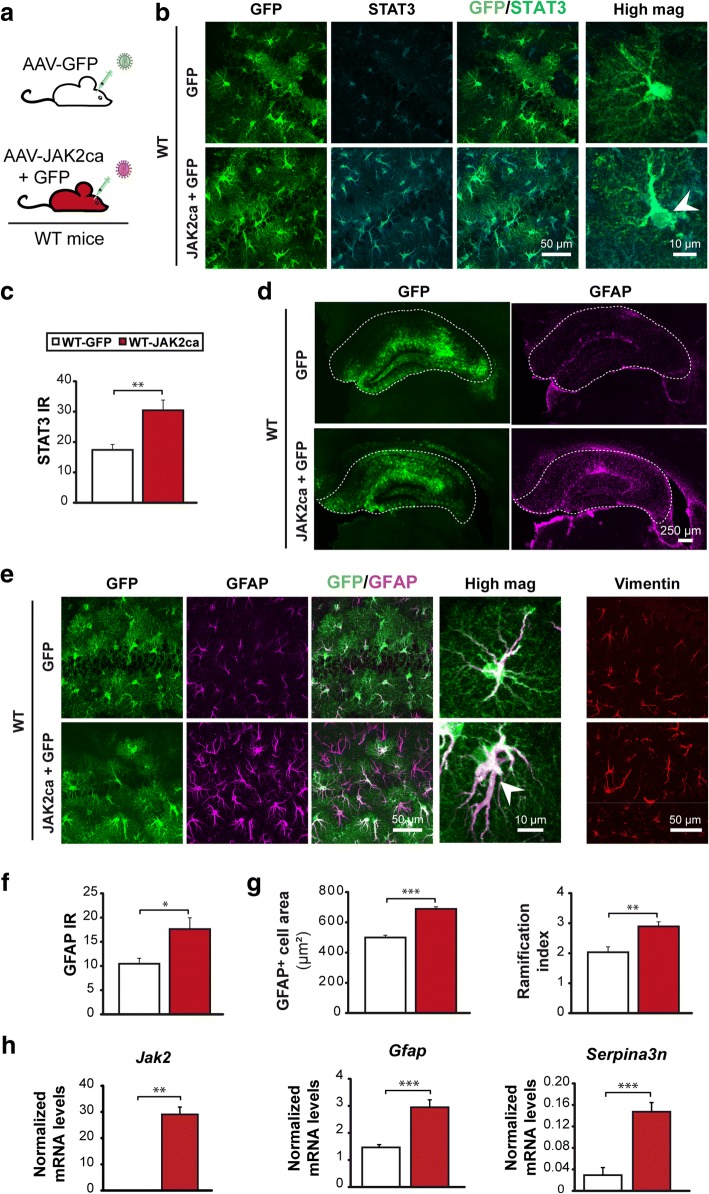
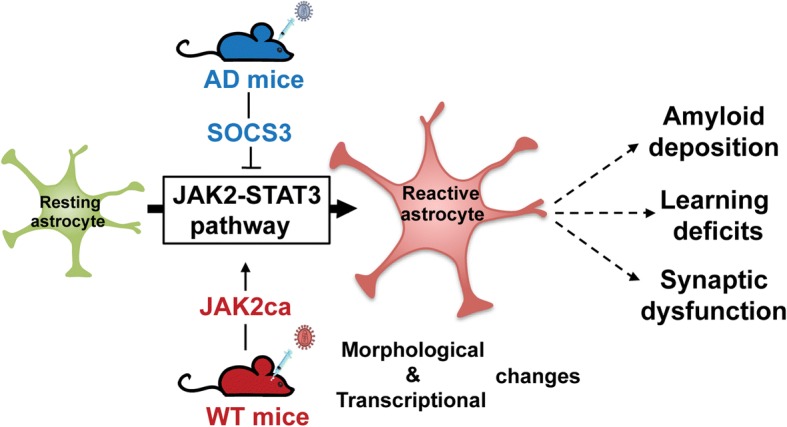
Astrocyte reactivity and neuroinflammation are hallmarks of CNS pathological conditions such as Alzheimer's disease. However, the specific role of reactive astrocytes is still debated. This controversy may stem from the fact that most strategies used to modulate astrocyte reactivity and explore its contribution to disease outcomes have only limited specificity. Moreover, reactive astrocytes are now emerging as heterogeneous cells and all types of astrocyte reactivity may not be controlled efficiently by such strategies.Here, we used cell type-specific approaches in vivo and identified the JAK2-STAT3 pathway, as necessary and sufficient for the induction and maintenance of astrocyte reactivity. Modulation of this cascade by viral gene transfer in mouse astrocytes efficiently controlled several morphological and molecular features of reactivity. Inhibition of this pathway in mouse models of Alzheimer's disease improved three key pathological hallmarks by reducing amyloid deposition, improving spatial learning and restoring synaptic deficits.In conclusion, the JAK2-STAT3 cascade operates as a master regulator of astrocyte reactivity in vivo. Its inhibition offers new therapeutic opportunities for Alzheimer's disease.

Keywords: Alzheimer’s disease; JAK2-STAT3 pathway; Mouse models; Neuroinflammation; Reactive astrocytes; Signaling cascades; Viral vectors.


Conflict of interest statement

Ethics approval and consent to participate

All experimental protocols were reviewed and approved by the local ethics committee (CETEA N°44) and submitted to the French Ministry of Education and Research (Approvals # APAFIS#4565–20 16031711426915 v3, APAFIS#4503–2016031409023019). They were performed in a facility authorized by local authorities (authorization #B92–032-02), in strict accordance with recommendations of the European Union (2010–63/EEC).

Consent for publication

Not applicable

Competing interests

The authors declare that they have no competing interests.

Publisher’s Note

Springer Nature remains neutral with regard to jurisdictional claims in published maps and institutional affiliations.

Figures

Fig. 1
Fig. 1
The JAK2-STAT3 pathway controls astrocyte reactivity in APP mice. a, Three month-old APP mice were injected in the hippocampus with AAV-GFP or AAV-SOCS3 + AAV-GFP. WT mice were injected with AAV-GFP. All mice were analyzed 6 months later. Another cohort was generated with AAV-JAK2ca used instead of AAV-SOCS3, to enhance astrocyte reactivity. b, Confocal images of astrocytes stained for GFAP (magenta) and STAT3 (cyan). In APP-GFP mice, astrocytes are hypertrophic, overexpress GFAP and show nuclear accumulation of STAT3 (indicating STAT3 activation, arrowhead), compared to WT-GFP mice. SOCS3 significantly reduces GFAP and STAT3 levels, whereas JAK2ca further increases GFAP and STAT3 levels in APP mice. c, d, Quantification of immunoreactivity (IR) for STAT3 (c, N = 4–5/group) and GFAP (d, N = 5–10/group) on immunostainings in b. e, The proportion of GFP+ astrocytes co-expressing vimentin is significantly lower in APP-SOCS3 mice and higher in APP-JAK2ca mice, than in control APP-GFP mice. N = 3–7/group. f, g, Western blot of GFAP in WT and APP mice shows the same modulation pattern of GFAP levels by SOCS3 and JAK2ca. GFAP levels were normalized by actin. Representative images and quantification from three independent membranes. N = 5–8/group. h, AAV-SOCS3 is also able to reverse astrocyte reactivity, when injected in the hippocampus of 15 month-old APP mice that already display severe plaque deposition (the hippocampus is outlined). i, GFAP IR quantification from images in h. N = 3/group. c-e, g, ANOVA and Tukey’s test. i, Paired t test. * p < 0.05, ** p < 0.01, *** p < 0.001
Fig. 2
Fig. 2
SOCS3 restores the transcriptional profile of APP astrocytes. a, Hippocampal astrocytes of 9 month-old WT-GFP (N = 7), APP-GFP (N = 4) or APP-SOCS3 (N = 5) mice were isolated by FACS and their transcriptome examined by RNAseq analysis. b, Hierarchical clustering of the ~ 7000 differentially expressed genes between GFP+ astrocytes (samples A1-A7) and all other GFP cells (samples O1-O3), which comprise microglial cells, neurons, oligodendrocyte precursor cells and non-infected astrocytes. c, Socs3 mRNA levels are increased more than 10 times in APP-SOCS3 astrocytes compared to WT-GFP and APP-GFP astrocytes. d, Venn Diagram showing the number of differentially expressed genes between WT-GFP and APP-GFP astrocytes and APP-GFP and APP-SOCS3 astrocytes. e, Expression levels for the 53 genes dysregulated in APP-GFP astrocytes and normalized in APP-SOCS3. Color scale represents mean-centered expression (log2-transformed). Genes belonging to immunity/inflammation pathways are in purple, those belonging to signal transduction are in brown. Genes common to the two pathways are in red. f, Pathway analysis on the 472 genes regulated by SOCS3 in APP astrocytes reveals a specific enrichment in GO terms linked to immunity/ inflammation and signal transduction. Ag. Proc & Pres. = antigen processing and presentation. Cell. = cellular. Ex. = exogenous. Neg. = negative. Pos. = positive. Reg. = regulation. Resp. = response. g, h, SOCS3 normalizes gene expression of cytokines/chemokines (g) and complement factors (h), which are induced in APP-GFP astrocytes. Wald test, * p < 0.05, ** p < 0.01, *** p < 0.001
Fig. 3
Fig. 3
SOCS3 inhibits the expression of reactive astrocyte markers. a, Heatmaps of genes belonging to the pan, A1 or A2 reactive astrocyte cassettes. SOCS3 decreases the expression of markers belonging to all categories, in APP astrocytes. Color scales represent mean-centered expression (log2-transformed). Wald test. b, Dendrogram obtained by WGCNA with the significant module indicated with an arrow. c, The significant WGCNA module is mainly formed by genes down-regulated by SOCS3. ANOVA. N = 7-4-5. * p < 0.05, ** p < 0.01, *** p < 0.001
Fig. 4
Fig. 4
Inhibition of JAK2-STAT3-mediated astrocyte reactivity reduces amyloid load in APP mice without impacting microglial cells a, Representative images of BAM10+ amyloid plaques (white) automatically delineated in yellow in APP-GFP, APP-SOCS3 and APP-JAK2ca mice. b, The number of hippocampal BAM10+ plaques is significantly decreased by SOCS3 (N = 9–8) and increased by JAK2ca in APP mice (N = 6–6). SOCS3 and JAK2ca effects were measured in two independent cohorts. c, The average size of individual BAM10+ amyloid plaque is similar between groups. d, Dosage of Aβ40 and Aβ42 peptide concentrations in Triton-X100-soluble protein homogenates from the hippocampus of APP-GFP (N = 10 or 6), APP-SOCS3 (N = 8) and APP-JAK2ca mice (N = 6). Aβ40 and 42 levels are not significantly different between groups. e, IBA1+ microglial cells (red, arrowheads) in contact with a MXO4+ amyloid plaque (blue). f, The number of microglia per plaque is similar between APP-GFP and APP-SOCS3 mice. N = 10–8. g, Confocal images of MXO4+ material (blue) in IBA1+ microglial cells (red). Microglial cells in contact with plaques either display MXO4 staining (white arrowhead) at the membrane, in the cytosol or are MXO4. h, The proportion of these three classes of microglial cells is not different between groups. N = 10–8. i, Experimental design to monitor Aβ phagocytosis. WT-GFP (N = 10), APP-GFP (N = 6) and APP-SOCS3 (N = 8) mice were injected with MXO4, 3 h before sacrifice. After staining, hippocampal CD11b+/CD45+ microglia and GFP+ astrocytes were analyzed by FACS. j, Representative gates to analyze MXO4+ amyloid uptake in astrocytes and microglia. There are 20% MXO4+ microglial cells in both APP-GFP and APP-SOCS3 groups and no MXO4+ astrocytes. k, No difference in the MXO4 median fluorescent intensity (MFI) is observed between APP-GFP and APP-SOCS3 microglial cells. l-m, RT-qPCR analysis on microglial cells acutely isolated from the hippocampus of 12 month-old WT-GFP, APP-GFP and APP-SOCS3 mice. l mRNA levels of Ctss and C1qb, two microglial homeostatic genes, is similar in all groups. m, Apoe and Trem2 mRNA levels are higher in phagocytic MXO4+ microglia than non-phagocytic MXO4 microglia, while Tmem119 levels are lower in MXO4+ microglia. This transcriptional profile is reminiscent of DAM microglia [34]. Astrocyte de-activation by SOCS3 does not impact the transcriptional profile of either type of microglia. N = 3–8/group. b, d, h, Student t test. c, f, k, Kruskall-Wallis test. l, m, One way ANOVA to compare the 3 groups within MXO4 cells and Student t test to compare two groups within MXO4+ cells. Mann-Whitney test to compare MXO4+ and MXO4 microglial cells within APP-GFP or APP-SOCS3 groups. * p < 0.05, ** p < 0.01
Fig. 5
Fig. 5
Inhibition of STAT3-mediated astrocyte reactivity improves spatial learning in APP mice a, Training phase of the Morris water maze. APP-GFP mice (N = 12) need more trials to learn the task than WT-GFP mice (N = 11). This learning deficit is corrected by SOCS3 expression in APP astrocytes (N = 11). Repeated-measures ANOVA. b, Probe phase of the Morris Water maze, 72 h after the last training session. Unlike WT-GFP mice, APP-GFP mice do not display preference for the target quadrant (T) over other quadrants (O). This memory deficit is not corrected by SOCS3. Wilcoxon test. * p < 0.05
Fig. 6
Fig. 6
SOCS3 rescues synaptic transmission and long-term plasticity in the hippocampus of 3xTg mice. a, Acute hippocampal slices were prepared from the hippocampus of 8–9 month-old WT-GFP, 3xTg-GFP and 3xTg-SOCS3 mice. A recording electrode was placed in the stratum radiatum of the GFP+ CA1 region. b, Acute slices processed for GFAP immunohistochemistry (red). In 3xTg-GFP mice, astrocytes display higher GFAP immunoreactivity and tortuous processes, compared to WT-GFP controls. SOCS3 restores low GFAP levels in 3xTg astrocytes N = 8–7-6. c, Representative traces for WT-GFP, 3xTg-GFP and 3xTg-SOCS3 mice after a paired-pulse stimulation protocol (50 ms interval) with increasing voltage. The input/output relationship is impaired in 3xTg-GFP mice and restored by SOCS3. N = 11-7-7. Two way (group, voltage) ANOVA and Tukey’s test. d, The paired-pulse ratio (PPR) at 50 V is similar in the three groups. N = 11-7-7. ANOVA. e, Representative (left) and average (right) fEPSPs before (1) and after (2) HFS protocol in the three groups. LTP is impaired in 3xTg mice and restored by SOCS3. f, Normalized fEPSP slopes 40 to 50 min post HFS, relatively to fEPSPs measured 10 min before HFS. N = 6-6-5. ANOVA and Tukey’s test. * p < 0.05, ** p < 0.01, *** p < 0.001
Fig. 7
Fig. 7
JAK2ca activates the JAK2-STAT3 pathway and induces astrocyte reactivity. a, WT mice were injected in the hippocampus with AAV-GFP alone (N = 6) or AAV-JAK2ca + AAV-GFP (JAK2ca + GFP, N = 6) at the same total viral titer and were studied 1–2 months later. b, Confocal images of hippocampal sections, stained for GFP (green) and STAT3 (cyan) in WT-GFP or WT-JAK2ca mice. JAK2ca induces STAT3 upregulation and nuclear accumulation in astrocytes, indicating STAT3 activation (arrowhead). c, STAT3 IR quantification in astrocyte nucleus from images in b. d, Representative low magnification images showing the transduced area (GFP+, green) and corresponding GFAP staining (magenta) in the hippocampus of WT-GFP and WT-JAK2ca mice. JAK2ca increases GFAP levels in a large part of the hippocampus (outlined). e, Confocal images of astrocytes stained for GFP (green), GFAP (magenta) and vimentin (red) in WT-GFP and WT-JAK2ca mice. JAK2ca increases GFAP and vimentin expression in hippocampal astrocytes and induces morphological changes. f, GFAP IR is increased by 70% in JAK2ca-injected hippocampus. g, Sholl analysis applied to GFAP-labelled astrocytes shows that reactive astrocytes in WT-JAK2ca mice have a larger domain area and a higher ramification index, a measure of cell complexity. h, RT-qPCR analysis was performed on acutely sorted hippocampal astrocytes from WT-GFP and WT-JAK2ca mice. Jak2, Gfap and Serpina3n are significantly overexpressed in WT-JAK2ca astrocytes. N = 7/group. c, f, g, Student t test. h, Gfap, Serpina3n: Student t test, Jak2: Mann-Whitney test. * p < 0.05, ** p < 0.01, *** p < 0.001
Fig. 8
Fig. 8
JAK2ca-induced astrocyte reactivity is sufficient to alter synaptic transmission and long-term plasticity in WT mice. a, Acute hippocampal slices were prepared from the hippocampus of 4–6 month-old WT-GFP and WT-JAK2ca mice. b-c, Representative paired-pulse stimulation traces for WT-GFP and WT-JAK2ca mice (100 ms interval). JAK2ca shifts the input/output relationship to the right, reducing the strength of basal glutamatergic transmission (b, Two way ANOVA and Bonferroni test) without impacting release probability, as revealed by unchanged PPR at 50 V (c, Student t test). N = 15–13. d, Representative (left) and average (right) fEPSPs before (1) and after (2) HFS protocol. LTP is impaired in WT-JAK2ca mice. e, Bar graph representing normalized fEPSP slopes 40 to 50 min post HFS. N = 8 in each group. Student t test. * p < 0.05, *** p < 0.001
Fig. 9
Fig. 9
The JAK2-STAT3 pathway is a master regulator of astrocyte reactivity that contributes to AD deficits. SOCS3-mediated inhibition of this cascade in AD mouse models blocked and even reversed morphological and molecular hallmarks of reactivity. Conversely, activation of the JAK2-STAT3 pathway by viral gene transfer of JAK2ca in WT mice was sufficient to induce those hallmarks. Inhibition of this cascade in AD mice reduced amyloid deposition, deficits in spatial learning and synaptic dysfunction, showing that reactive astrocytes significantly contribute to AD pathological outcomes

Similar articles

Cited by

References

    1. Adamsky A, Kol A, Kreisel T, Doron A, Ozeri-Engelhard N, Melcer T, et al. Astrocytic activation generates De novo neuronal potentiation and memory enhancement. Cell. 2018;174:59–71. doi: 10.1016/j.cell.2018.05.002. - DOI - PubMed
    1. Allaman I, Gavillet M, Belanger M, Laroche T, Viertl D, Lashuel HA, et al. Amyloid-beta aggregates cause alterations of astrocytic metabolic phenotype: impact on neuronal viability. J Neurosci. 2010;30:3326–3338. doi: 10.1523/JNEUROSCI.5098-09.2010. - DOI - PMC - PubMed
    1. Anderson MA, Ao Y, Sofroniew MV. Heterogeneity of reactive astrocytes. Neurosci Lett. 2014;565:23–29. doi: 10.1016/j.neulet.2013.12.030. - DOI - PMC - PubMed
    1. Anderson MA, Burda JE, Ren Y, Ao Y, O'Shea TM, Kawaguchi R, et al. Astrocyte scar formation aids central nervous system axon regeneration. Nature. 2016;532:195–200. doi: 10.1038/nature17623. - DOI - PMC - PubMed
    1. Araque A, Carmignoto G, Haydon PG, Oliet SH, Robitaille R, Volterra A. Gliotransmitters travel in time and space. Neuron. 2014;81:728–739. doi: 10.1016/j.neuron.2014.02.007. - DOI - PMC - PubMed

Publication types

MeSH terms