. 2018 Oct 16:7:e37090.
doi: 10.7554/eLife.37090.

Integrated culturing, modeling and transcriptomics uncovers complex interactions and emergent behavior in a three-species synthetic gut community

Affiliations

Integrated culturing, modeling and transcriptomics uncovers complex interactions and emergent behavior in a three-species synthetic gut community

Kevin D'hoe et al. Elife. .

Erratum in

Abstract

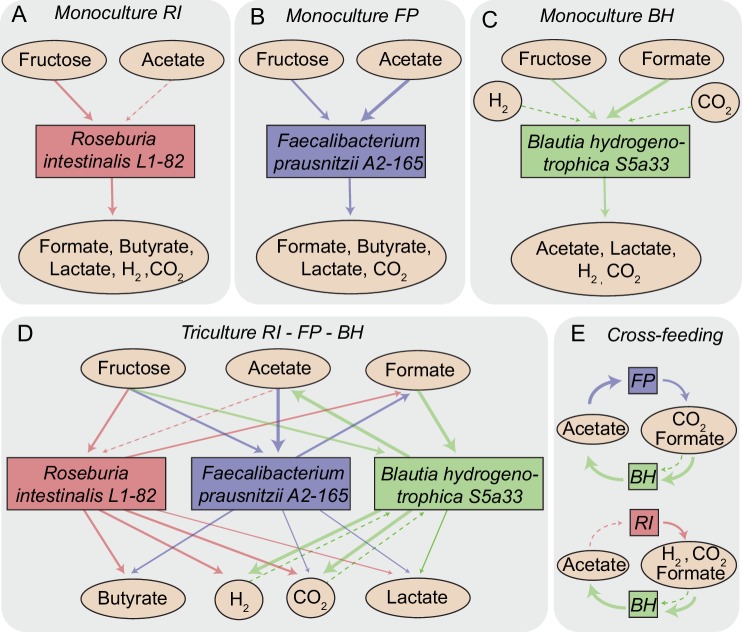
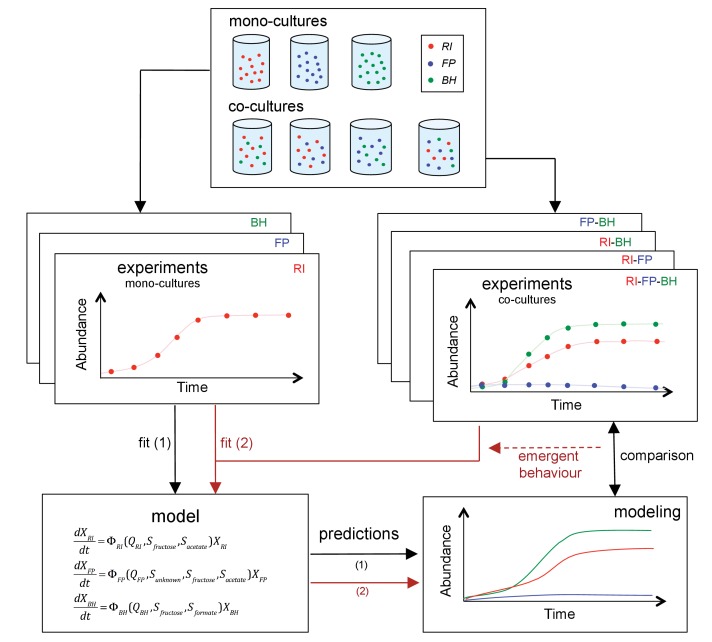
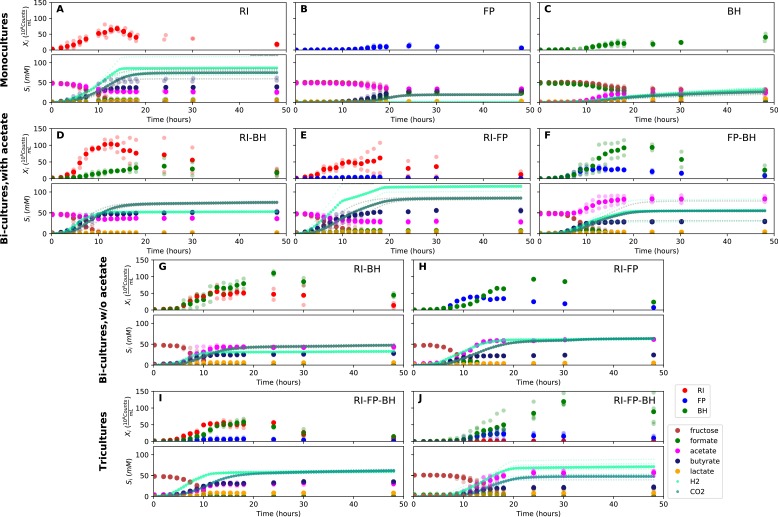
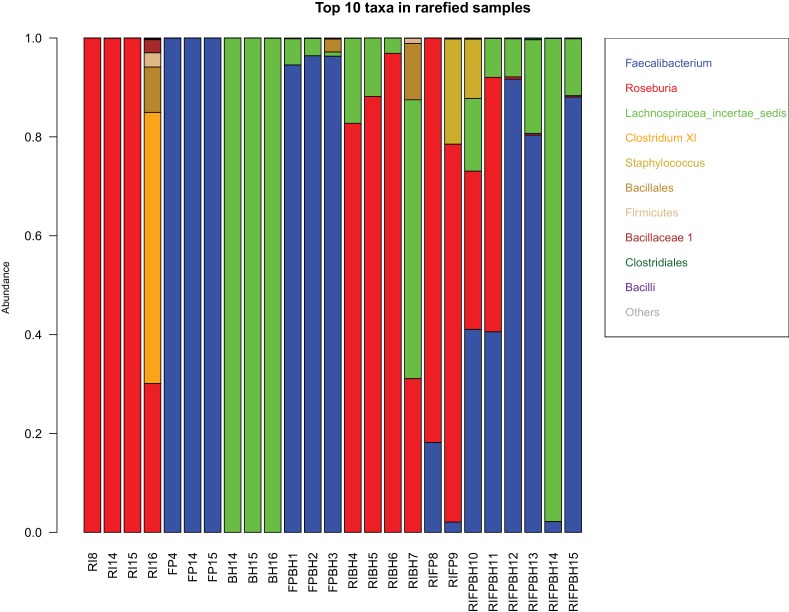
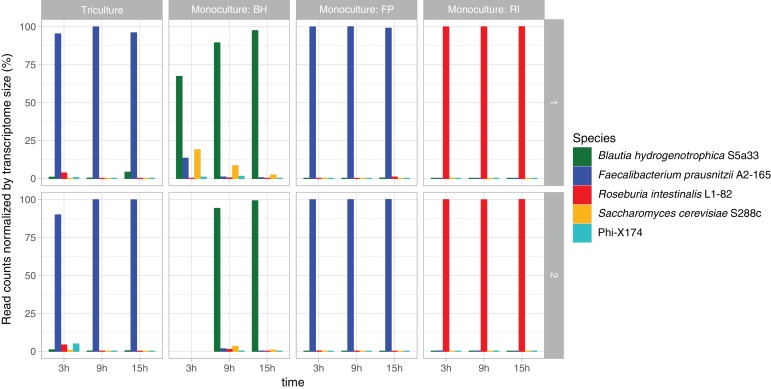
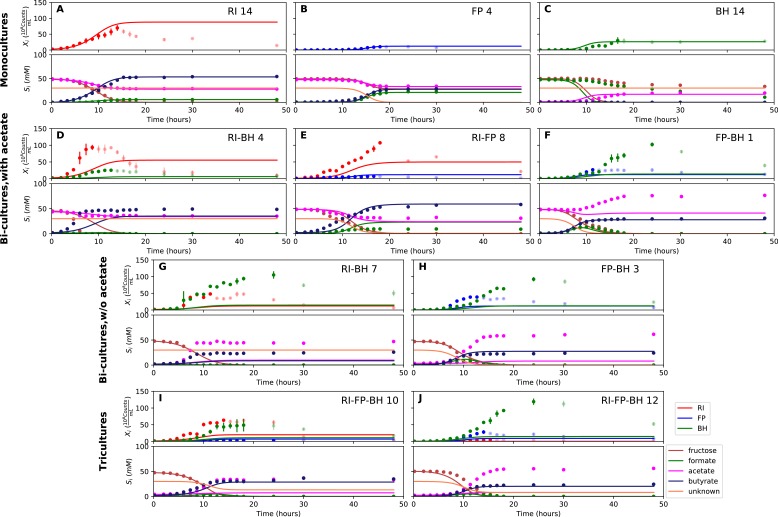
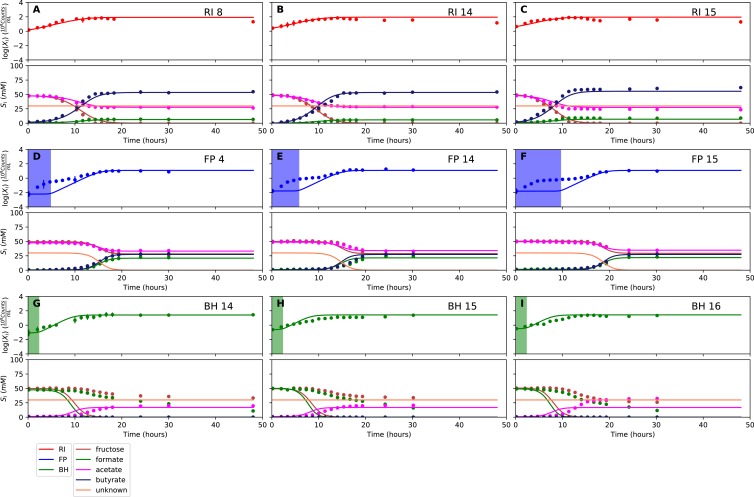
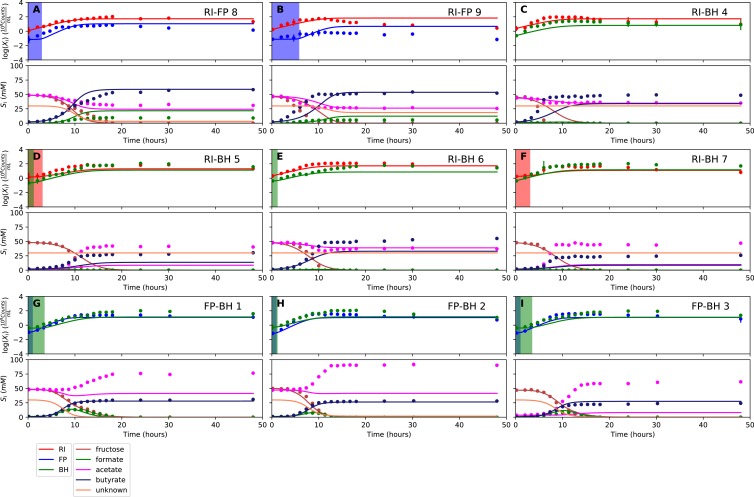
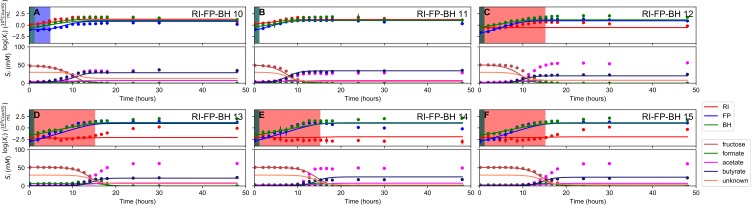
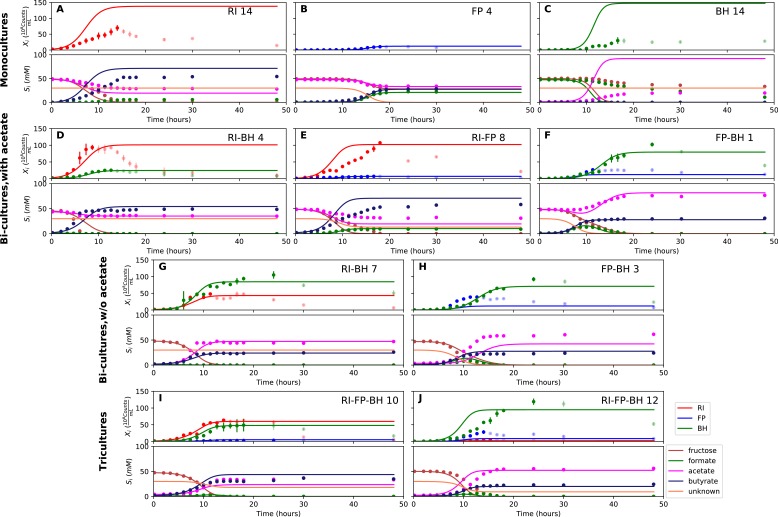
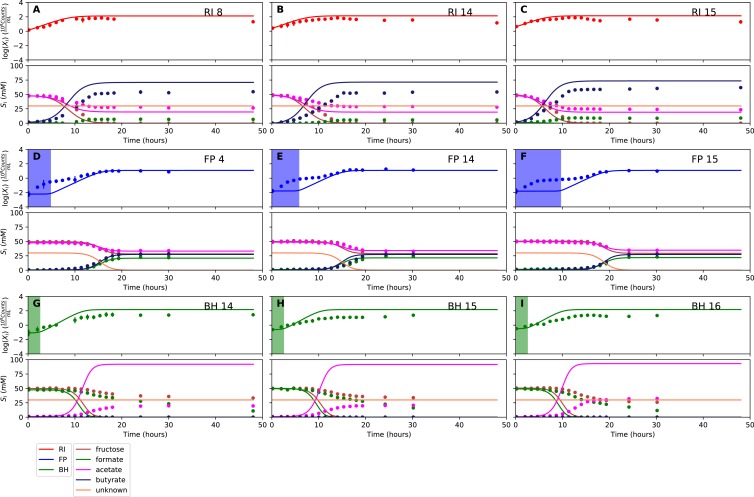
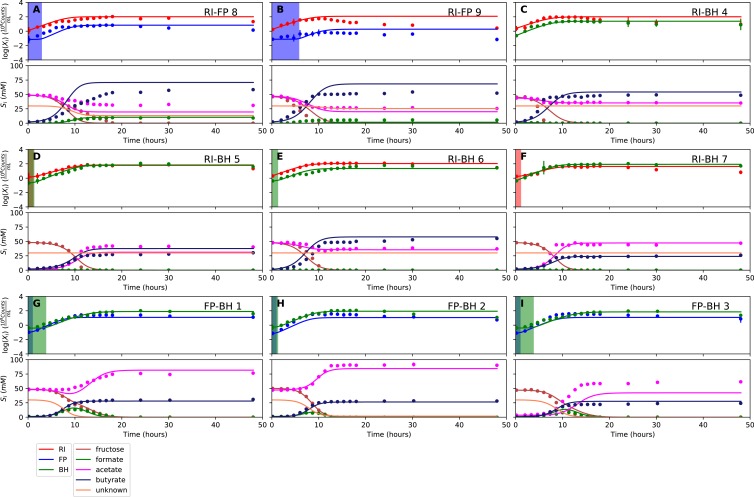
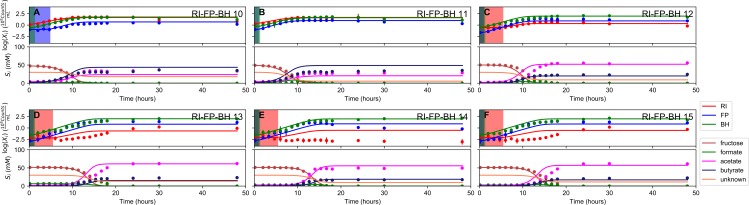
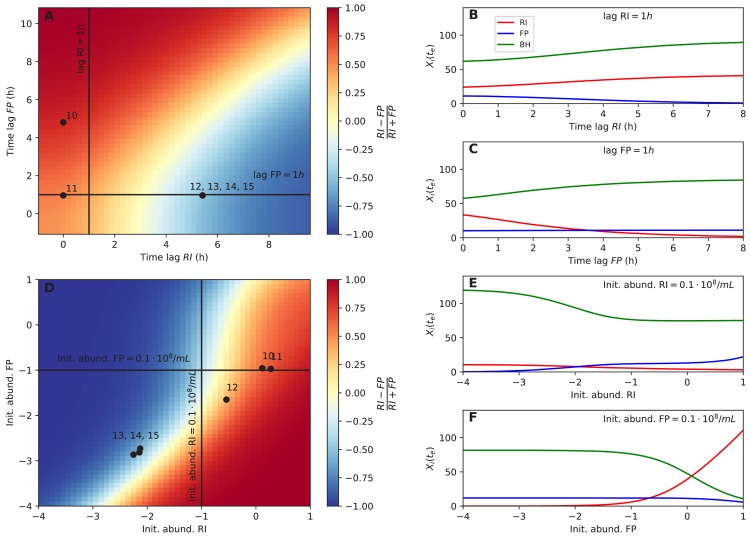
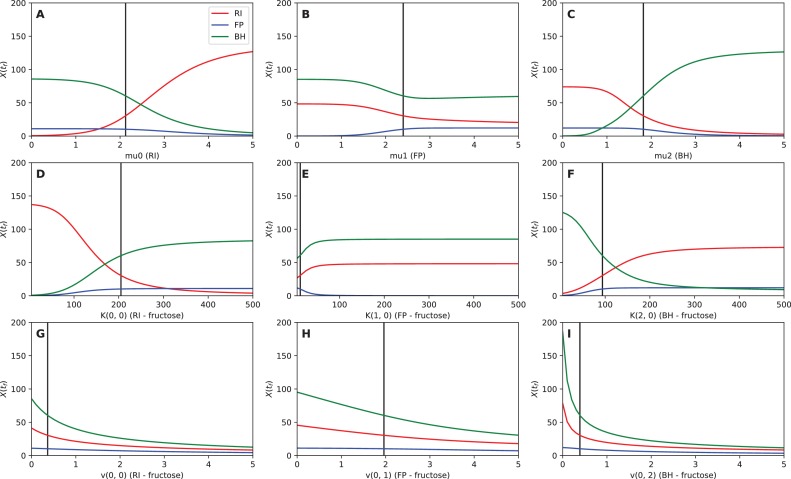
The composition of the human gut microbiome is well resolved, but predictive understanding of its dynamics is still lacking. Here, we followed a bottom-up strategy to explore human gut community dynamics: we established a synthetic community composed of three representative human gut isolates (Roseburia intestinalis L1-82, Faecalibacterium prausnitzii A2-165 and Blautia hydrogenotrophica S5a33) and explored their interactions under well-controlled conditions in vitro. Systematic mono- and pair-wise fermentation experiments confirmed competition for fructose and cross-feeding of formate. We quantified with a mechanistic model how well tri-culture dynamics was predicted from mono-culture data. With the model as reference, we demonstrated that strains grown in co-culture behaved differently than those in mono-culture and confirmed their altered behavior at the transcriptional level. In addition, we showed with replicate tri-cultures and simulations that dominance in tri-culture sensitively depends on the initial conditions. Our work has important implications for gut microbial community modeling as well as for ecological interaction detection from batch cultures.

Keywords: Blautia hydrogenotrophica; Faecalibacterium prausnitzii; Roseburia intestinalis; computational biology; infectious disease; microbiology; systems biology.


Conflict of interest statement

KD, SV, KF, FM, GF, DG, VL, LG, JD, LD, JR No competing interests declared

Figures

Figure 1.
Figure 1.. Overview of metabolite-mediated strain interactions.
(A–C) Strain-specific metabolite consumption and production. (D) Metabolite-mediated interactions present in the tri-culture. (E) Cross-feeding interactions between Faecalibacterium prausnitzii A2-165 (FP) and Blautia hydrogenotrophica S5a33 (BH) as well as between Roseburia intestinalis L1-82 (RI) and BH. The dashed arrow from acetate to RI denotes net acetate consumption. The dashed arrows from hydrogen and CO2 to BH indicate the potential of this bacterium to grow autotrophically on these gasses.
Figure 2.
Figure 2.. Scheme summarizing the experimental set-up and modeling approach.
A mechanistic model of a three-strain community consisting of Roseburia intestinalis L1-82 (RI), Faecalibacterium prausnitzii A2-165 (FP) and Blautia hydrogenotrophica S5a33 (BH) is parameterized on mono-cultures, but does not describe tri-culture dynamics well. Data from bi-cultures are taken into account to improve the goodness of fit to the tri-culture data, thereby indicating emergent behavior.
Figure 3.
Figure 3.. Summary of fermentation data.
Biological replicates are plotted together in one panel, with their mean shown in bold. For each set of experiments, species abundances quantified by qPCR are plotted in the top half of the panel and metabolite concentrations in the bottom half. (A–C) Monocultures of Roseburia intestinalis L1-82 (RI), Faecalibacterium prausnitzii A2-165 (FP) and Blautia hydrogenotrophica S5a33 (BH). (D–F) The three co-culture combinations of RI, FP and BH with initial acetate. (G–H) Co-cultures of RI versus BH and FP versus BH without initial acetate. (I–J) The tri-culture replicates are separated into those dominated by RI and BH (I) and those dominated by FP and BH (J).
Figure 3—figure supplement 1.
Figure 3—figure supplement 1.. Test for prokaryotic contamination with 16S rRNA gene sequencing.
For samples taken at the last time point, DNA was extracted and the V4 region of the 16S rRNA gene was amplified and sequenced. Raw reads are rarefied to 15,339 counts per sample and then converted into relative abundances. The top 10 taxa in each sample are shown. The abbreviations RI, FP and BH in sample identifiers stand for Roseburia intestinalis L1-82, Faecalibacterium prausnitzii A2-165 and Blautia hydrogenotrophica S5a33, respectively. The taxon Lachnospiraceae incertae sedis contains B. hydrogenotrophica S5a33. High relative abundances of potential contaminants (>10%) were found in one R. intestinalis L1-82 mono-culture (RI_16), one R. intestinalis L1-82/F. prausnitzii A2-165 co-culture (RI_FP_9) and one tri-culture (RI_FP_BH_10).
Figure 3—figure supplement 2.
Figure 3—figure supplement 2.. Test for viral, prokaryotic and eukaryotic contamination in RNA-seq data.
The RNA of two non-prokaryotic organisms reached noticeable abundances: the bacteriophage phiX174, which is used as a control in Illumina sequencing, and the yeast S. cerevisiae S288c, which probably came from the yeast extract employed in the medium. In most of the samples, these potential contaminants have transcriptome-size-corrected abundances below 5%, but in one sample (Blautia hydrogenotrophica S5a33 at 3 hr) the yeast RNA abundance reached 18%. Taxonomic assignment was carried out with MetaPhlAn2 and mash screen against the complete RefSeq genomes and plasmids database. Total read counts were corrected for transcriptome size (genome size in the case of the bacteriophage). The bacterial contamination observed in the Roseburia intestinalis L1-82 monoculture with 16S rRNA gene sequencing was not confirmed with RNA-seq. Row one refers to experiments RI_FP_BH_14, BH_16, FP_14 and RI_16, whereas row two refers to experiments RI_FP_BH_15, BH_15, FP_15 and RI_15.
Figure 4.
Figure 4.. Model parameterized on monocultures does not fit co-culture data well.
(A–C) Fit to monoculture experiments selected for parameterization. (D–F) Fit to selected co-culture experiments with initial acetate. (G–H) Fit to selected co-culture experiments without initial acetate. (I–J) Fit to tri-cultures dominated by Roseburia intestinalis L1-82 (RI) and Blautia hydrogenotrophica S5a33 (BH) versus Faecalibacterium prausnitzii A2-165 (FP) and BH, respectively. Lines represent model predictions and dots represent observations. The whiskers represent technical variation across triplicates. Transparent points indicate declining cell numbers; corresponding samples were not taken into account for model fitting. The unknown compound represents an unspecified co-substrate assumed to be required by FP. Metabolites not included in the model are omitted from the plot. Experiment identifiers indicate which of the biological replicates is displayed. The model was parameterized on experiments RI_8, RI_14, FP_4, FP_15 and BH_14.
Figure 4—figure supplement 1.
Figure 4—figure supplement 1.. Fit to monoculture experiments for the model parameterized on monocultures only.
(A–C) Fit to Roseburia intestinalis L1-82 (RI) monoculture experiments. (D–F) Fit to Faecalibacterium prausnitzii A2-165 (FP) monoculture experiments. (G–I) Fit to Blautia hydrogenotrophica S5a33 (BH) monoculture experiments. Lines represent model predictions and dots represent observations. The whiskers represent technical variation across triplicates. The shaded regions indicate the length of the estimated strain-specific lag phases. The unknown compound represents an unspecified co-substrate assumed to be required by Faecalibacterium prausnitzii A2-165. Metabolites not included in the model are omitted from the plot. Experiment identifiers indicate which of the biological replicates is displayed. The model was parameterized on experiments RI_8, RI_14, FP_4, FP_15 and BH_14.
Figure 4—figure supplement 2.
Figure 4—figure supplement 2.. Fit to bi-culture experiments for the model parameterized on monocultures only.
(A–B) Fit to Roseburia intestinalis L1-82 (RI) and Faecalibacterium prausnitzii A2-165 (FP) bi-culture experiments. (C–F) Fit to RI and Blautia hydrogenotrophica S5a33 (BH) bi-culture experiments. (G–I) Fit to FP and BH bi-culture experiments. Lines represent model predictions and dots represent observations. The whiskers represent technical variation across triplicates. The shaded regions indicate the length of the estimated strain-specific lag phases. The unknown compound represents an unspecified co-substrate assumed to be required by FP. Metabolites not included in the model are omitted from the plot. Experiment identifiers indicate which of the biological replicates is displayed. The model was parameterized on experiments RI_8, RI_14, FP_4, FP_15 and BH_14.
Figure 4—figure supplement 3.
Figure 4—figure supplement 3.. Fit to tri-culture experiments for the model parameterized on monocultures only.
(A–B) Fit to tri-culture experiments dominated by Roseburia intestinalis L1-82 (RI) and Blautia hydrogenotrophica S5a33 (BH). (C–F) Fit to tri-culture experiments dominated by Faecalibacterium prausnitzii A2-165 (FP) and BH. Lines represent model predictions and dots represent observations. The whiskers represent technical variation across triplicates. The shaded regions indicate the length of the estimated strain-specific lag phases. The unknown compound represents an unspecified co-substrate assumed to be required by FP. Metabolites not included in the model are omitted from the plot. Experiment identifiers indicate which of the biological replicates is displayed. The model was parameterized on experiments RI_8, RI_14, FP_4, FP_15 and BH_14.
Figure 5.
Figure 5.. Model parameterized on mono- and bi-cultures improves fit to co-culture data as compared to parameterization on monocultures alone.
(A–C) Fit to selected monoculture experiments. (D–F) Fit to selected co-culture experiments with initial acetate (D and F were included in parameterization). (G–H) Fit to selected co-culture experiments without initial acetate, which were not part of the parameterization. (I–J) Fit to tri-cultures dominated by Roseburia intestinalis L1-82 (RI) and Blautia hydrogenotrophica S5a33 (BH) versus Faecalibacterium prausnitzii A2-165 (FP) and BH, respectively. Lines represent model predictions and dots represent observations. The whiskers represent technical variation across triplicates. Transparent points indicate declining cell numbers; corresponding samples were not taken into account for model fitting. The unknown compound represents an unspecified co-substrate assumed to be required by FP. Metabolites not included in the model are omitted from the plot. Experiment identifiers indicate which of the biological replicates is displayed. The model was parameterized on experiments FP_4, FP_15, FP_BH_1, FP_BH_2 and RI_BH_4.
Figure 5—figure supplement 1.
Figure 5—figure supplement 1.. Fit to monoculture experiments for the model parameterized on selected monocultures and bi-cultures.
(A–C) Fit to Roseburia intestinalis L1-82 (RI) monoculture experiments. (D–F) Fit to Faecalibacterium prausnitzii A2-165 (FP) monoculture experiments. (G–I) Fit to Blautia hydrogenotrophica S5a33 (BH) monoculture experiments. Lines represent model predictions and dots represent observations. The whiskers represent technical variation across triplicates. The shaded regions indicate the length of the estimated strain-specific lag phases. The unknown compound represents an unspecified co-substrate assumed to be required by FP. Metabolites not included in the model are omitted from the plot. Experiment identifiers indicate which of the biological replicates is displayed. The model was parameterized on experiments FP_4, FP_15, FP_BH_1, FP_BH_2 and RI_BH_4.
Figure 5—figure supplement 2.
Figure 5—figure supplement 2.. Fit to bi-culture experiments for the model parameterized on selected monocultures and bi-cultures.
(A–B) Fit to Roseburia intestinalis L1-82 (RI) and Faecalibacterium prausnitzii A2-165 (FP) bi-culture experiments. (C–F) Fit to Roseburia intestinalis L1-82 and Blautia hydrogenotrophica S5a33 (BH) bi-culture experiments. (G–I) Fit to FP and BH bi-culture experiments. Lines represent model predictions and dots represent observations. The shaded regions indicate the length of the estimated strain-specific lag phases. The whiskers represent technical variation across triplicates. The unknown compound represents an unspecified co-substrate assumed to be required by FP. Metabolites not included in the model are omitted from the plot. Experiment identifiers indicate which of the biological replicates is displayed. The model was parameterized on experiments FP_4, FP_15, FP_BH_1, FP_BH_2 and RI_BH_4.
Figure 5—figure supplement 3.
Figure 5—figure supplement 3.. Fit to tri-culture experiments for the model parameterized on selected monocultures and bi-cultures.
(A–B) Fit to tri-culture experiments dominated by Roseburia intestinalis L1-82 (RI) and Blautia hydrogenotrophica S5a33 (BH). (C–F) Fit to tri-culture experiments dominated by Faecalibacterium prausnitzii A2-165 (FP) and BH. Lines represent model predictions and dots represent observations. The shaded regions indicate the length of the estimated strain-specific lag phases. The whiskers represent technical variation across triplicates. The unknown compound represents an unspecified co-substrate assumed to be required by FP. Metabolites not included in the model are omitted from the plot. Experiment identifiers indicate which of the biological replicates is displayed. The model was parameterized on experiments FP_4, FP_15, FP_BH_1, FP_BH_2 and RI_BH_4.
Figure 6.
Figure 6.. Initial abundance and lag phase determine the order of abundance in the final time point of the tri-culture.
(A) The tri-culture dynamics is simulated with different lag-phase values for Faecalibacterium prausnitzii A2-165 (FP) and Roseburia intestinalis L1-82 (RI) and the resulting end point abundance ratio of FP and RI is plotted in a heat map that is colored in blue for FP dominance and in red for RI dominance. The observed tri-culture data (black circles) are plotted according to the estimated experimental lag phases for RI and FP. The predicted RI or FP dominance agrees with the observed dominance in all six cases. (B, C) Simulations illustrate the dependency of the end point abundances (Xi(te)) of the three strains on the lag phase of RI and FP. (D) The tri-culture dynamics is simulated for varying initial abundances (init. abund.) of FP and RI and their resulting end point abundance ratio is visualized in a heat map. Three of the four FP-dominated experiments (13–15) and both RI-dominated experiments (10 and 11) are situated within their predicted region of dominance. (E, F) The end point abundance Xi(te) of the three strains is non-linearly dependent on the initial abundance of RI and FP in simulations, illustrating that dominance in batch is sensitive to initial conditions. All simulations were carried out with the model parameterized on mono- and bi-culture data (parameterization 2). Initial abundances are plotted in logarithmic scale. For the simulations in (A–C), the initial abundances of RI, FP and Blautia hydrogenotrophica S5a33 (BH) were set to 0.58, 0.04 and 0.21 10counts/mL, respectively, whereas for the simulations in (D–F), the lag phase for RI, FP and BH were set to 0.33, 0.08 and 0.1 h, respectively. These initial abundance and lag-phase values represent the averages of observed initial abundances and estimated lag phases across all tri-culture experiments.
Figure 6—figure supplement 1.
Figure 6—figure supplement 1.. Sensitivity analysis.
The abundance of Roseburia intestinalis L1-82 (RI), Faecalibacterium prausnitzii A2-165 (FP) and Blautia hydrogenotrophica S5a33 (BH) at the final time point is plotted, depending on the values of the maximal specific growth rate μ (A–C), the fructose half-saturation constant K (D–F) and the fructose uptake rate v (G–I).

Similar articles

Cited by

References

    1. Aharonovich D, Sher D. Transcriptional response of Prochlorococcus to co-culture with a marine Alteromonas: differences between strains and the involvement of putative infochemicals. The ISME Journal. 2016;10:2892–2906. doi: 10.1038/ismej.2016.70. - DOI - PMC - PubMed
    1. Anders S, Pyl PT, Huber W. HTSeq--a Python framework to work with high-throughput sequencing data. Bioinformatics. 2015;31:166–169. doi: 10.1093/bioinformatics/btu638. - DOI - PMC - PubMed
    1. Andrews S. FastQC: a quality control tool for high throughput sequence data. GitHub. 2010 https://github.com/s-andrews/FastQC
    1. Antharam VC, Li EC, Ishmael A, Sharma A, Mai V, Rand KH, Wang GP. Intestinal dysbiosis and depletion of butyrogenic bacteria in Clostridium difficile infection and nosocomial diarrhea. Journal of Clinical Microbiology. 2013;51:2884–2892. doi: 10.1128/JCM.00845-13. - DOI - PMC - PubMed
    1. Auchtung JM, Robinson CD, Britton RA. Cultivation of stable, reproducible microbial communities from different fecal donors using minibioreactor arrays (MBRAs) Microbiome. 2015;3:42. doi: 10.1186/s40168-015-0106-5. - DOI - PMC - PubMed

Publication types