. 2018 Dec;8(12):1548-1565.
doi: 10.1158/2159-8290.CD-18-0804. Epub 2018 Oct 15.

Integrative Molecular Characterization of Malignant Pleural Mesothelioma

Collaborators, Affiliations

Integrative Molecular Characterization of Malignant Pleural Mesothelioma

Julija Hmeljak et al. Cancer Discov. 2018 Dec.

Abstract

Malignant pleural mesothelioma (MPM) is a highly lethal cancer of the lining of the chest cavity. To expand our understanding of MPM, we conducted a comprehensive integrated genomic study, including the most detailed analysis of BAP1 alterations to date. We identified histology-independent molecular prognostic subsets, and defined a novel genomic subtype with TP53 and SETDB1 mutations and extensive loss of heterozygosity. We also report strong expression of the immune-checkpoint gene VISTA in epithelioid MPM, strikingly higher than in other solid cancers, with implications for the immune response to MPM and for its immunotherapy. Our findings highlight new avenues for further investigation of MPM biology and novel therapeutic options. SIGNIFICANCE: Through a comprehensive integrated genomic study of 74 MPMs, we provide a deeper understanding of histology-independent determinants of aggressive behavior, define a novel genomic subtype with TP53 and SETDB1 mutations and extensive loss of heterozygosity, and discovered strong expression of the immune-checkpoint gene VISTA in epithelioid MPM.See related commentary by Aggarwal and Albelda, p. 1508.This article is highlighted in the In This Issue feature, p. 1494.


Conflict of interest statement

Conflict of Interest

Andrew Cherniak and Matthew Meyerson received funding from Bayer AG. Ewan Gibb is an employee of GenomeDX Biosciences, INC. Harvey Pass’ spouse is on the Speakers Board for Genentec, and Genentec has performed molecular analyses of a separate MPM cohort for Dr. Pass’ work.

Figures

Figure 1:
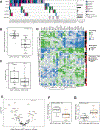
Figure 1:. Genomic and clinical features of the TCGA MPM cohort.
A: iCOMUT plot describing clinical and molecular features of the TCGA MPM cohort. Each column represents an individual case, whilst rows represent clinical and molecular features. Samples are grouped based on MPM histological type. Red arrowhead indicates the hypermutated case. Copy-number alterations are defined as follows: “Deletion” is a deep loss, possibly a homozygous deletion, “Loss” is a shallow loss (possibly heterozygous deletion), “Gain” indicates a low-level gain, and “Amplification” is a high-level amplification. Individual genes shown include significantly mutated genes and selected additional genes of interest. B: Observed mutational spectrum of the hypermutator case (TCGA-UD-AAC1) with 375 non-silent mutations. C: Observed mutational spectrum of the remaining other 73 MPM cases in the TCGA cohort (cohort average: 36 non-silent mutations/patient). D: Comparison of SMGs between the present study and that of Bueno et al, 2016.
Figure 2:
Figure 2:. Supervised comparisons between BAP1-inactivated and wild-type MPM.
A: BAP1 inactivation by copy number loss or mutation across the cohort, along with mutations in 6 other genes (left). These genes were selected as those with more than 3 non-silent mutated tumors. Large genes with more than 3kb coding regions (TTN, FAT4, MGA) are unlikely to be functional in cancer and were excluded. The bar plot (right) shows the Fisher-exact test p-values for mutual exclusivity and co-occurrence relative to BAP1. Only SETD2 and NF2 approach significant co-occurrence with BAP1 inactivation. The 1-tail Fisher p-values for co-occurrence and the Bejamini-Hochberg FDR’s are p=0.04, FDR=0.15 for SETD2 and p=0.05, FDR=0.15 for NF2. We detected MALAT1 (aka NEAT2) “RNA” mutations in 4 BAP1-inactivated samples, but this does not reach significance (p=0.05, FDR~0.27). B: Normalized BAP1 gene mRNA expression levels in the wild-type, 1 hit and 2 hit subgroups. C: Box plot demonstrating a significantly lower frequency of arm-level losses in BAP1-inactivated tumors (BAP1 2) compared to wild-type (BAP1 0). D: Inferred transcription factor (TF) activities significantly associated with BAP1 inactivation (FDR<0.01). E: Volcano plot with mean inferred TF activity difference in BAP1 inactivated and BAP1 wild-type patients plotted on the x-axis, and false discovery rate (FDR)-adjusted significance from t-test plotted on the y-axis (–log10 scale). TFs significantly associated with BAP1 inactivation status (FDR<0.01) are colored in orange. F, G: Box plots with differential inferred activities of YY1 (F) and IRF8 (G), two biologically relevant transcription factors. The target genes on which inferences for YY1 (427 genes) and IRF8 (248 genes) activity were based are provided in Supplementary Table S2.
Figure 3.
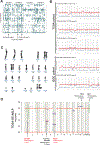
Figure 3.. MPM cases with genomic near-haploidization.
A: Whole exome sequencing-based LOH profiling with the FACETS algorithm revealed three MPM samples with genome-wide LOH. B: Allelic copy number plots of genome-wide LOH cases in the TCGA and Japanese ICGC cohorts. X-axis and Y-axis are the chromosome locations, and the ratio of an allelic copy number of tumor sample to that of matched normal control (lymphocyte), respectively. Red line shows the higher allele and blue line shows the lower allele. C: Near-haploid metaphase cell derived from the BWH genome-wide LOH cohort, stained by Giemsa, showing loss of one copy of all chromosomes except 5, 7 and X. D: Allelic copy number plot of a representative TCGA case with biallelic inactivation of TP53 and monoallelic mutation of SETDB1, suggesting the latter occurred after the LOH and genome duplication events.
Figure 4:
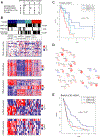
Figure 4:. Integrative analysis of 74 MPM.
A: Concordance between integrative (PARADIGM and iCluster) and platform-specific unsupervised clustering results. Clusters are color-coded and ranked based on survival (dark blue indicates best survival, whilst red and orange marks the worst surviving subgroup). B: Kaplan-Meier plot of the integrative subgroups reveals distinct outcomes. C: Cox regression analysis demonstrates significant associations of the molecular subtypes with patient survival, even upon adjusting for histology, age, and CDKN2A status. D: iCluster identified 4 integrative subgroups with distinct BAP1 alteration (defined as mutation and/or copy number alteration), TP53 mutation, CDKN2A status, copy number alteration, DNA methylation, mRNA, miRNA and lncRNA mRNA expression profiles. E: Comparison of Th2 cell immune gene mRNA expression signature across the four integrated clusters.
Figure 5:
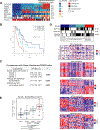
Figure 5:. Integrative analysis of epithelioid MPM.
A: Comparison of cluster assignments between the epithelioid-only and full cohort integrative analyses demonstrating good concordance, with only 7 cases being reassigned to another cluster. B: Integrative clustering analysis applied to cases with epithelioid histology. C: Kaplan-Meier plot of the epithelioid-only integrative subgroups. D: PATHMARK analysis revealed differentially active molecular pathways that define the poor prognosis epithelioid-only subgroup. E: Validation of the TCGA epithelioid subtypes in an independent cohort of 141 epithelioid MPM (Bueno et al.) confirming the protective effect of molecular features that define iCluster 1.
Figure 6:
Figure 6:. Non-coding RNA Subtypes and differential abundance for lncRNAs and miRNAs in the TCGA and Bueno cohorts. a-g) LncRNA subtypes and differential abundance.
A: Top to bottom: Normalized abundance heatmap for a 4-subtype solution, then a silhouette width profile (Wcm) calculated from the consensus membership matrix; clinical and molecular covariates, with p-values from Fisher exact, Chi-square or Kruskal tests; and profiles of RNA-seq-based EMT scores and leukocyte fraction. B: Distribution of purity estimated by ABSOLUTE, with a Kruskal p-value. C: Distribution of RNA-seq-based EMT scores, with a Kruskal p-value. D: Kaplan-Meier plot for overall survival, with a log-rank p-value. E: Kaplan-Meier plot for overall survival, with a log-rank p-value for a 4-subtype solution for the Bueno cohort. F,G: lncRNAs that were differentially abundant (SAM 2-class unpaired analysis, FDR < 0.05) between the better-survival lncRNA subtype and all other samples, for the TCGA cohort (F) and the Bueno cohort (G). The largest 15 positive and 15 negative fold changes are shown; blue triangles mark lncRNAs that were in these gene sets in results for both cohorts. Text to the right of each barplot gives means-based fold changes, mean abundance in the target then the other samples, and the cytoband for the gene. See also Supplementary Table S5A. H-L) microRNA mature strand subtypes and differential abundance in the TCGA cohort. H: Top to bottom: Normalized abundance heatmap for a 5-subtype solution, then a silhouette width profile (Wcm) calculated from the consensus membership matrix; clinical and molecular covariates, with p-values from Fisher exact, Chi-square or Kruskal tests; and profiles of RNA-seq-based EMT scores and leukocyte fraction. I: Distribution of purity estimated by ABSOLUTE, with a Kruskal p-value. J: Distribution of RNA-seq-based EMT scores, with a Kruskal p-value. K: Kaplan-Meier plot for overall survival, with a log-rank p-value. L: miRNA mature strands that were differentially abundant between the better-survival lncRNA subtype and all other samples, for the TCGA cohort. The largest 15 positive and 15 negative fold changes are shown. Text to the right of each barplot gives means-based fold changes, mean abundance in the target then the other samples, and the cytoband(s) for the mature strand. See also Supplementary Table S5B.
Figure 7.
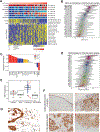
Figure 7.. MPM is enriched for both EMT and mRNA expression of immune targets.
A: Unsupervised analysis identifies correlations between EMT and multiple platforms. Tumors are ordered from left to right according to increasing EMT score. Numbered color bars indicate group assignments (clusters) from other data types. Statistically significant correlations are shown between EMT score and (starting at top) integrative multi-dimensional analyses on both iCluster and PARADIGM platforms, along with mRNA, miRNA and lncRNA clusters, methylation status and consensus histology. Lower panels illustrate significant correlations between these clusters and selected miRNAs, proteins, immune target genes. B: Spectra of EMT scores across different tumor types. Mesothelioma is the second most mesenchymal cancer type after sarcoma in 31 tumor types analyzed. Despite most MPM tumors having undergone EMT, a broad range of EMT scores were observed across mesothelioma cases, which corresponded to a large extent with histologic subtype. C: Waterfall plot illustrating the correlation between EMT and immune target genes. D: Plot highlighting VISTA gene mRNA expression, which is highest in MPM, across all TCGA tumor types. E: Box plot indicating VISTA mRNA expression levels in individual histological types of the TCGA MPM cohort. The highest mRNA expression levels were observed in the epithelioid subtype (Wilcoxon rank-sum, p=2e-7), whilst sarcomatoid MPM had the lowest mRNA expression (p=0.017). Red arrows indicate two epithelioid cases that were examined by immunohistochemistry, TCGA-SC-A6LQ-01 (1) and TCGA-SC-A6LM-01 (2). F: Immunohistochemical staining for VISTA (Rabbit monoclonal anti-VISTA antibody, clone D1L2G, 0.1 μg/mL, Cell Signaling Technology, Danvers, MA, USA) in normal mesothelial lining from pleura (*) and benign pleuritis with reactive mesothelial proliferation (**), and 2 TCGA MPM cases, TCGA-SC-A6LQ-01 (1) and TCGA-SC-A6LM-01 (2); images captured at 100x magnification. These results confirm high protein expression of VISTA on tumor cells in epithelioid MPM. G: VISTA immunohistochemistry. VISTA protein is expressed both in tumor cells (red arrows) and in infiltrating inflammatory cells (black arrows) in the epithelioid MPM case TCGA-SC-A6LQ-01. Image captured at 200x magnification.

Comment in

References

    1. Sekido Y Molecular pathogenesis of malignant mesothelioma. Carcinogenesis 2013;34(7):1413–9 doi 10.1093/carcin/bgt166. - DOI - PubMed
    1. Leong SL, Zainudin R, Kazan-Allen L, Robinson BW. Asbestos in Asia. Respirology 2015;20(4):548–55 doi 10.1111/resp.12517. - DOI - PubMed
    1. Yap TA, Aerts JG, Popat S, Fennell DA. Novel insights into mesothelioma biology and implications for therapy. Nat Rev Cancer 2017;17(8):475–88 doi 10.1038/nrc.2017.42. - DOI - PubMed
    1. Bott M, Brevet M, Taylor BS, Shimizu S, Ito T, Wang L, et al. The nuclear deubiquitinase BAP1 is commonly inactivated by somatic mutations and 3p21.1 losses in malignant pleural mesothelioma. Nat Genet 2011;43(7):668–72 doi 10.1038/ng.855. - DOI - PMC - PubMed
    1. Bueno R, Stawiski EW, Goldstein LD, Durinck S, De Rienzo A, Modrusan Z, et al. Comprehensive genomic analysis of malignant pleural mesothelioma identifies recurrent mutations, gene fusions and splicing alterations. Nat Genet 2016;48(4):407–16 doi 10.1038/ng.3520. - DOI - PubMed

Publication types

MeSH terms