. 2018 Oct 15;25(11):587-600.
doi: 10.1101/lm.048181.118. Print 2018 Nov.

The role of the gustatory cortex in incidental experience-evoked enhancement of later taste learning

Affiliations

The role of the gustatory cortex in incidental experience-evoked enhancement of later taste learning

Veronica L Flores et al. Learn Mem. .

Abstract

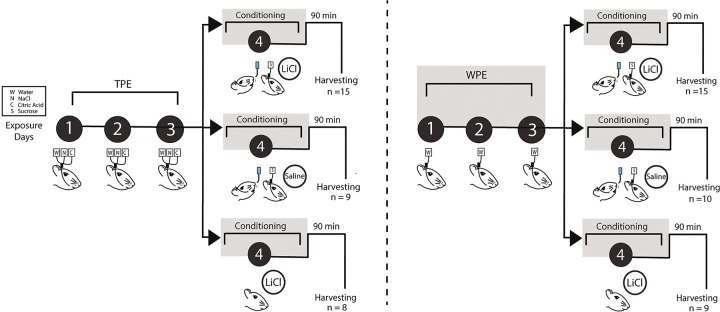
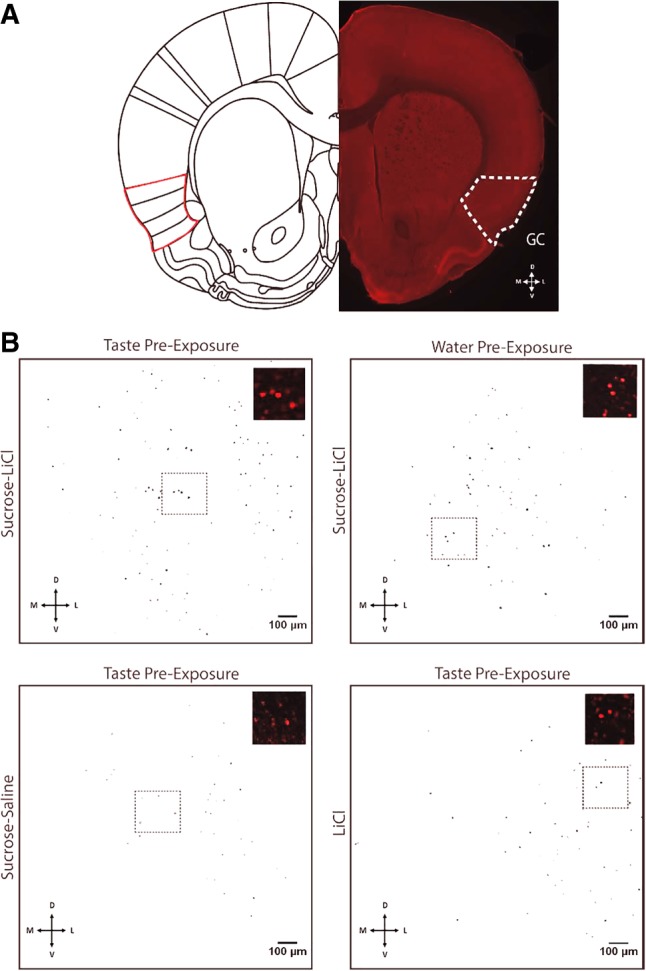
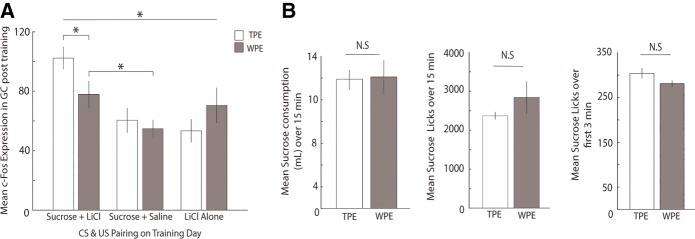
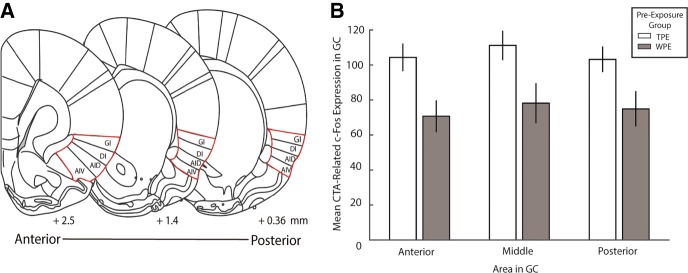
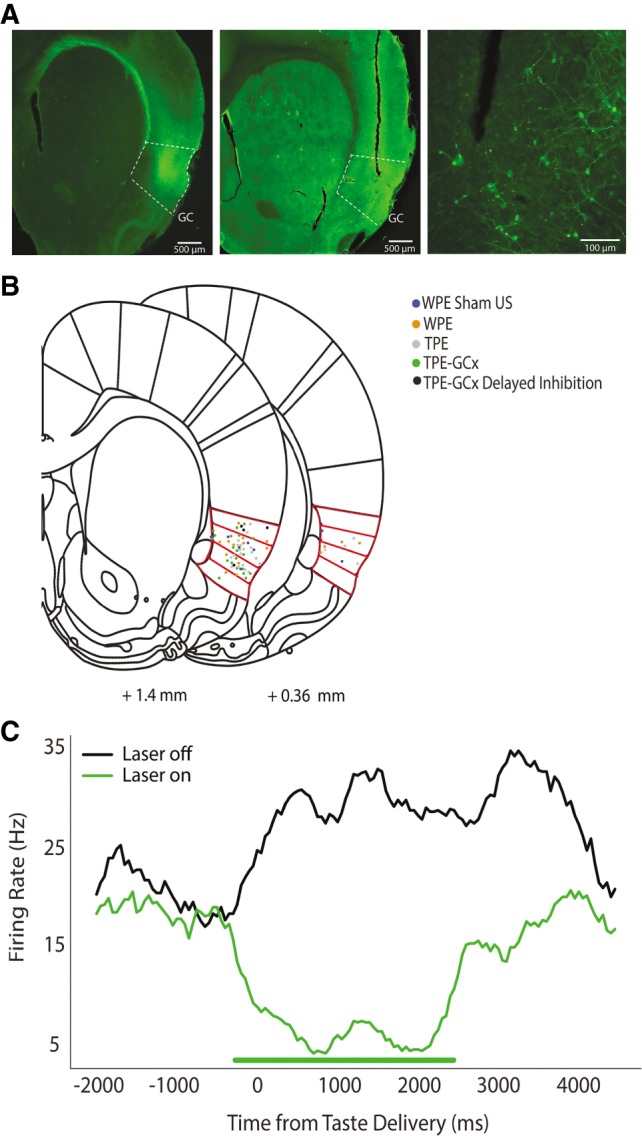
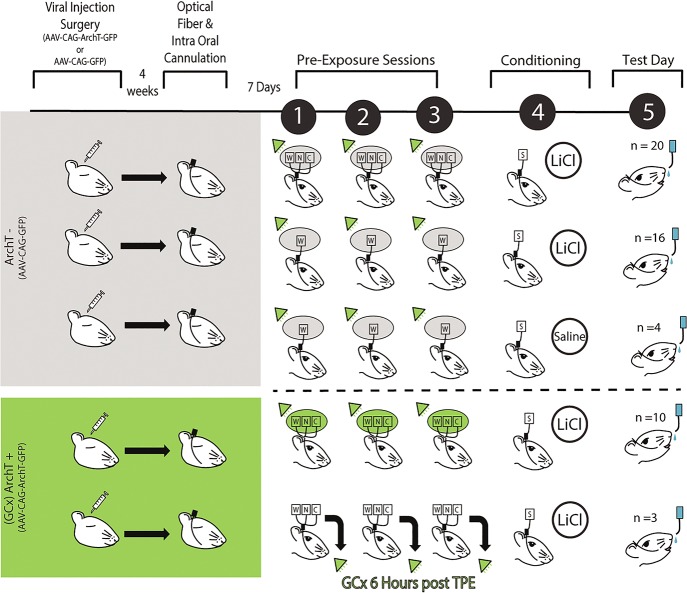
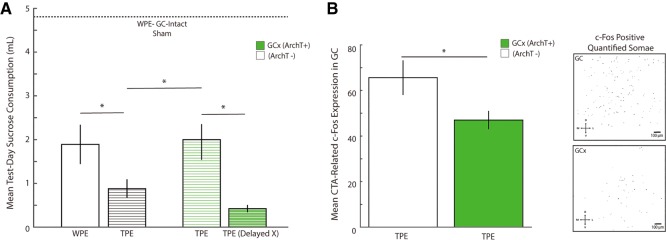
The strength of learned associations between pairs of stimuli is affected by multiple factors, the most extensively studied of which is prior experience with the stimuli themselves. In contrast, little data is available regarding how experience with "incidental" stimuli (independent of any conditioning situation) impacts later learning. This lack of research is striking given the importance of incidental experience to survival. We have recently begun to fill this void using conditioned taste aversion (CTA), wherein an animal learns to avoid a taste that has been associated with malaise. We previously demonstrated that incidental exposure to salty and sour tastes (taste preexposure-TPE) enhances aversions learned later to sucrose. Here, we investigate the neurobiology underlying this phenomenon. First, we use immediate early gene (c-Fos) expression to identify gustatory cortex (GC) as a site at which TPE specifically increases the neural activation caused by taste-malaise pairing (i.e., TPE did not change c-Fos induced by either stimulus in isolation). Next, we use site-specific infection with the optical silencer Archaerhodopsin-T to show that GC inactivation during TPE inhibits the expected enhancements of both learning and CTA-related c-Fos expression, a full day later. Thus, we conclude that GC is almost certainly a vital part of the circuit that integrates incidental experience into later associative learning.


Figures

Figure 1.
Figure 1.
Taste preexposure paradigm. A complete timeline of the Taste preexposure paradigm showing all groups. Animals were divided into two groups: TPE (left) or WPE (right), then further divided into three conditioning conditions: sucrose + LiCl, sucrose + saline, and LiCl alone. Schematic demonstrates the 4-d experimental paradigm in which rats receive TPE to water (W), sodium chloride (N), and citric acid (C), via IOC infusions to the tongue for 3 d (black circles days 1–3). WPE rats underwent three identical days of exposure to water. Aversions were then conditioned on the fourth day, when exposure to sucrose (S) is immediately followed by LiCl injections (0.3 M, 0.5% of current body weight), equal dosages of saline or equal dosages of LiCl without sucrose exposure. Control rats were either given saline injections or LiCl alone. Ninety minutes after the conditioning session, rats were perfused for harvesting of GC.
Figure 2.
Figure 2.
c-Fos positive cells in GC after CTA conditioning to novel sucrose. (A) A representative coronal slice indicating the location of gustatory cortex (GC, Left-half hemisphere; reprinted from Paxinos and Watson 2007 with permission from Elsevier 2007.) Bottom directional indicates direction of tissue location—dorsal (D), ventral (V), medial (M), and lateral (L). (B) Representative images of c-Fos positive somae (masked in black) in GC for the four groups most relevant to the central Experiment 1 hypothesis, quantified by the FIJI Analyzing Particles tool. From top left to bottom right: TPE followed by pairing of sucrose and LiCl; WPE followed by pairing of sucrose and LiCl; TPE followed by a pairing of sucrose and saline; and TPE followed by LiCl alone. Insets represent higher-magnification samples of c-Fos positive somae (red) sampled from the region in the dotted black rectangle (note: quantification took place across the entire masked image).
Figure 3.
Figure 3.
TPE increases CTA-related c-Fos expression in GC. (A) Preexposure to salty and sour tastes (open bars) followed by CTA conditioning resulted in significantly higher c-Fos expression in GC, compared to WPE rats (gray bars); c-Fos in the TPE—CTA conditioning group was also significantly higher than all other groups. These results, and the fact that TPE did not enhance c-Fos in sham and LiCl-alone groups, demonstrate that TPE specifically impacts the pairing of the sucrose with LiCl, and not the processing of either independently. (B) (Left) BAT sucrose consumption (mL) across 15-min access to 15 mL sucrose was similar for TPE and WPE rats. (Middle) Lick rate for sucrose was similar for TPE and WPE rats during the entire 15 min BAT session. (Right) Initial lick-rate (average licks for the first 3 min of the BAT) was similar for TPE and WPE rats. Error bars represent SEM. (*) P < 0.05.
Figure 4.
Figure 4.
TPE-evoked increases in CTA-related c-Fos expression impacts the entire GC. (A) Schematics of coronal sections of anterior, middle and posterior regions of GC (Reprinted from Paxinos and Watson 2007, with permission from Elsevier 2007). Numbers at the bottom indicate distance from bregma (in mm) for designated anterior, middle, and posterior regions of GC. Areas outlined in red indicate the locations of GC. (B) Mean CTA-related c-Fos positive somae in GC corresponding to the regions in Panel A for rats given TPE or WPE. The impact of TPE on CTA-related c-Fos expression was similar for anterior, middle, or posterior subregions of GC. Error bars represent SEM.
Figure 5.
Figure 5.
Localization of viral infection and optical fiber placement in GC. (A) Representative fluorescent images of GC confirming infection of ArchT (left) and placement of optical fiber (middle) in GC. The far-right panel shows, at higher magnification, infected neurons in GC stained with GFP at the tip of the fiber track. (B) Localization of all fiber tips for all optogenetic groups in Experiment 2A, overlain on schematic coronal slices (Reprinted from Paxinos and Watson 2007, with permission from Elsevier 2007), demonstrating reliable placement in GC; red outlines are the four granular regions in GC. Note that for simplicity and demonstration here, fiber localizations for both hemispheres are overlaid on to one. Each rat received two fiber depth scores (one per hemisphere), which were then averaged for a single Fiber Depth index per rat (see Materials and Methods). (C) Peristimulus time histogram (PSTH) of a single GC neuron infected with ArchT demonstrating that our optogenetic inactivation protocol has the desired effect. The firing rate of the infected neuron drops drastically while the laser is on (green line, 0–2500 msec post-taste delivery).
Figure 6.
Figure 6.
GCx during Taste preexposure paradigm. A complete timeline of the optogenetic (Experiment 2A) paradigm showing all groups. Rats first undergo viral injection surgery (either AAV-CAG-GFP or AAV-CAG-ArchT-GFP infused bilaterally into GC). Rats receiving AAAV-CAG-ArchT-GFP (ArchT+) are highlighted in green. Rats receiving only AAV-CAG-GFP (ArchT-) are highlighted in gray. To ensure high levels of viral infection, the optical fiber and intraoral cannulation surgery took place 4 wk after viral injection surgery. Following 7 d of recovery after the optical fiber and intraoral cannulation surgery, all rats encountered three TPE (or WPE) sessions, with 532 nm laser illumination of GC during each fluid exposure (indicated by green triangle). ArchT- groups (top three rows) involved three groups: from the top, TPE followed by sucrose + LiCl, WPE followed by sucrose + LiCl and WPE followed by sucrose + saline. ArchT+ groups (bottom two rows) involved two groups: TPE followed by sucrose + LiCl and TPE followed by sucrose + LiCl in which laser illumination was delayed by 6 h (see text). On the day following conditioning, aversion strengths are tested via sequential presentation of sucrose and water for all five groups.
Figure 7.
Figure 7.
GCx during TPE inhibits CTA learning enhancement and impacts CTA-related c-Fos. (A) In ArchT- rats (black and white bars, left side of graph), aversions to novel sucrose were stronger following TPE (black striped bar) than following WPE (open bar)—a replication of the original behavioral result (Flores et al. 2016). ArchT+ rats receiving GCx during TPE (thin green striped bar) showed significantly weaker CTAs compared to identically run ArchT - rats (compare the middle pair of TPE bars)—demonstration that GC activity during TPE is vital for the behavioral phenomenon. GCx induced 6 h after each TPE session (thick green striped bar) did not reduce aversion strength. Finally, all conditioned groups showed learning when compared to ArchT- sham-conditioned rats (horizontal dashed line). The x-axis represents average raw sucrose consumption on test day (mL) across all groups. (B) (Left) CTA-related c-Fos expression in GC was significantly stronger in ArchT- rats (open bar), compared to ArchT+ rats (green bar)—GCx reduced CTA-induced c-Fos. (Right) Representative images of c-Fos positive somae (masked in black) for GC-intact (top) and GCx (bottom) rats, quantified by the FIJI Analyzing Particles tool. Error bars represent SEM. (*) P < 0.05.

References

    1. Adaikkan C, Rosenblum K. 2015. A molecular mechanism underlying gustatory memory trace for an association in the insular cortex. Elife 4: e07582. - PMC - PubMed
    1. Ahlers RH, Best PJ. 1971. Novelty vs temporal contiguity in learned taste aversions. Psychon Sci 25: 34–36.
    1. Allen GV, Saper CB, Hurley KM, Cechetto DF. 1991. Organization of visceral and limbic connections in the insular cortex of the rat. J Comp Neurol 311: 1–16. - PubMed
    1. Alwis DS, Rajan R. 2013. Environmental enrichment causes a global potentiation of neuronal responses across stimulus complexity and lamina of sensory cortex. Front Cell Neurosci 7: 124. - PMC - PubMed
    1. Aschauer DF, Kreuz S, Rumpel S. 2013. Analysis of transduction efficiency, tropism and axonal transport of AAV serotypes 1, 2, 5, 6, 8 and 9 in the mouse brain. PLoS One 8: e76310. - PMC - PubMed

Publication types