

Infiltrative and drug-resistant slow-cycling cells support metabolic heterogeneity in glioblastoma
- PMID: 30322894
- PMCID: PMC6276884
- DOI: 10.15252/embj.201798772
Infiltrative and drug-resistant slow-cycling cells support metabolic heterogeneity in glioblastoma
Abstract
Metabolic reprogramming has been described in rapidly growing tumors, which are thought to mostly contain fast-cycling cells (FCCs) that have impaired mitochondrial function and rely on aerobic glycolysis. Here, we characterize the metabolic landscape of glioblastoma (GBM) and explore metabolic specificities as targetable vulnerabilities. Our studies highlight the metabolic heterogeneity in GBM, in which FCCs harness aerobic glycolysis, and slow-cycling cells (SCCs) preferentially utilize mitochondrial oxidative phosphorylation for their functions. SCCs display enhanced invasion and chemoresistance, suggesting their important role in tumor recurrence. SCCs also demonstrate increased lipid contents that are specifically metabolized under glucose-deprived conditions. Fatty acid transport in SCCs is targetable by pharmacological inhibition or genomic deletion of FABP7, both of which sensitize SCCs to metabolic stress. Furthermore, FABP7 inhibition, whether alone or in combination with glycolysis inhibition, leads to overall increased survival. Our studies reveal the existence of GBM cell subpopulations with distinct metabolic requirements and suggest that FABP7 is central to lipid metabolism in SCCs and that targeting FABP7-related metabolic pathways is a viable therapeutic strategy.
Keywords: brain cancer; cancer stem cells; glioblastoma; metabolism; slow‐cycling cells.
© 2018 The Authors.
Figures
- A
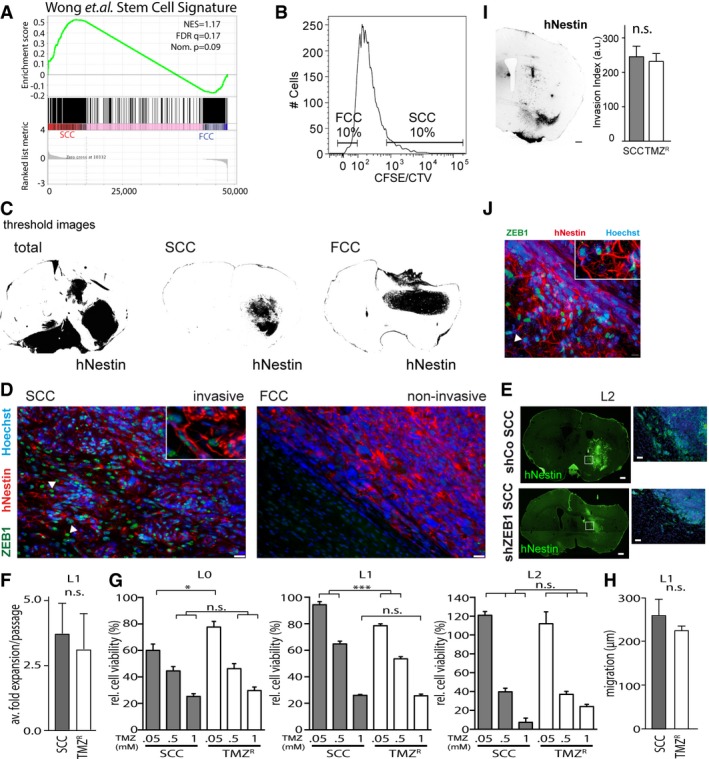
GSEA of SCC (n = 3 biological replicates, L0‐1‐2) and FCC (n = 3 biological replicates, L0‐1‐2) RNA seq data sets for enrichment of the stem cell gene signature (Wong et al, 2008). FDR, false discovery rate; NES, normalized enrichment score; Nom., nominal.
- B
SCCs and FCCs were separated 6–8 days after (CFSE or CTV) CellTrace loading. Gates were set as 10% CellTracehi versus CellTracelo).
- C
Threshold images of human‐specific nestin staining were used for quantification of tumor invasion (n = 5 animals per group, see Materials and Methods).
- D
Immunofluorescence imaging revealed notable differences between invasive/SCC‐derived, and non‐invasive/FCC‐derived, tumors. Invasive SCC‐derived tumors were positive for ZEB1 (green), while this marker was absent in the tumor masses derived from FCCs. Tumor cells were labeled with hNestin (red) and nuclei with Hoechst (blue). Scale bars, 10 μm. Arrowheads indicate infiltrative Zeb1+ GBM cells.
- E
Fluorescence imaging showed that the invasion of ZEB1 knockdown (shZEB1) SCC‐derived tumors from orthotopic xenografts was greatly reduced compared to that of control SCC‐derived tumors (shCo). Scale bars, 10 μm.
- F–J
Temozolomide‐resistant cells (TMZR) and SCCs derived from the L1 patient‐derived GBM line displayed similar growth rates (n = 3) (F), TMZ sensitivities (n = 6–8, *P < 0.05, ***P < 0.001, one‐way ANOVA with Tukey post‐test) (G), as well as migration (H) and invasion capabilities (scale bars, 500 μm) (I) (n = 3–12). These results were accompanied by the detection of high expression levels of ZEB1 in TMZR‐derived tumors. The arrowhead indicates infiltrative Zeb1+ GBM cell (J). Values are mean ± SEM.
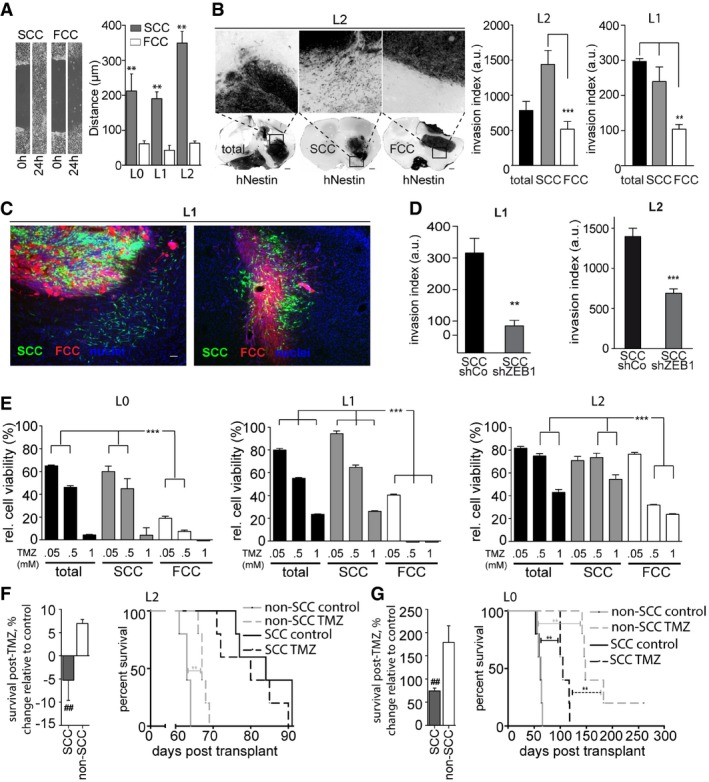
Scratch assays demonstrated a greater migratory potential for SCCs than for FCCs within 24 h (mean ± SEM, n = 6, **P < 0.01, t‐test).
Following murine xenografts of L1 or L2 patient‐derived cell lines, SCCs produced invasive tumors, while FCCs produced confined masses. Ten weeks after implantation, SCC‐derived tumors, and total population‐derived tumors for L1, exhibited greater invasion indices than FCC‐derived tumors (mean ± SEM, n = 3–12, **P < 0.001, ***P < 0.001, one‐way ANOVA with Tukey post‐test). Scale bars, 500 μm.
Representative fluorescence microscopy images of tumor sections derived from intracranial xenografts of lentivirally transduced green fluorescent protein (GFP)‐labeled SCCs and red fluorescent protein (RFP)‐expressing FCCs in a 1:1 ratio, 6 weeks after implantation (n = 5). SCCs (in green) generated a network of cells infiltrating the brain parenchyma while FCCs (red) remained contained, forming tight masses. Images are from two mice out of five. Scale bar, 10 μm.
The invasion of tumors derived from orthotopic xenografts of ZEB1 knockdown SCCs was significantly lower than that of control SCC‐derived tumors (mean ± SEM, n = 6, **P < 0.01, ***P < 0.001, t‐test).
SCCs were found to be significantly more resistant to TMZ than the total or FCC populations in vitro using MTT assays (mean ± SEM, n = 6–8, ***P < 0.001, one‐way ANOVA with Tukey post‐test).
In vivo TMZ treatment yielded no survival benefit following SCC xenograft of the most TMZ‐resistant GBM line, whereas TMZ treatment of animals xenografted with the non‐SCC population resulted in significantly prolonged survival (mean ± SEM, n = 5, ## P < 0.01, t‐test).
TMZ treatment of animals xenografted with SCCs from a more TMZ‐sensitive line increased overall survival, but to a lesser degree than for non‐SCC‐implanted animals (mean ± SEM, n = 5, ## P < 0.01, t‐test).
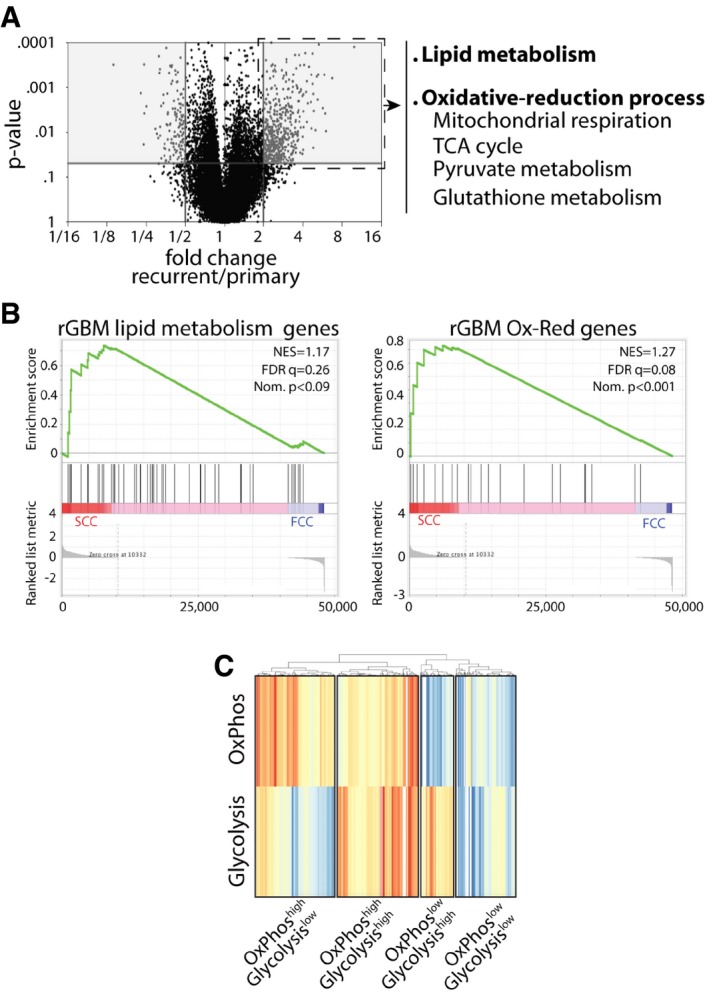
Volcano plot representation of 20,530 genes that were identified in primary and recurrent human GBMs using the TCGA database and showing differentially expressed genes between the two groups. Gray areas denote significant increases or decreases in gene expression. Recurrent tumors show a significant increase in the expression of genes involved in lipid metabolism, mitochondrial respiration, TCA cycle, as well as pyruvate and antioxidant metabolism (fold change > 2 and P < 0.05, Mann–Whitney U‐test, Subio platform). These genes were then clustered into two signatures representing lipid metabolism and oxidative‐reduction (Ox‐Red) genes.
GSEA of SCC (n = 3 biological replicates, L0‐1‐2) and FCC (n = 3 biological replicates, L0‐1‐2) RNA seq data sets for enrichment of these recurrent glioblastoma (rGBM) gene signatures. FDR, false discovery rate; NES, normalized enrichment score; Nom., nominal.
Different metabolic signatures were identified from GBM single‐cell RNA sequencing data (Venteicher et al, 2017). These results, generated by GenePattern ssGSEA and visualized with pheatmap (Euclidean algorithm), highlight the metabolic heterogeneity in GBM, with various clusters of cells demonstrating gene signatures for OxPhos and glycolysis.
- A
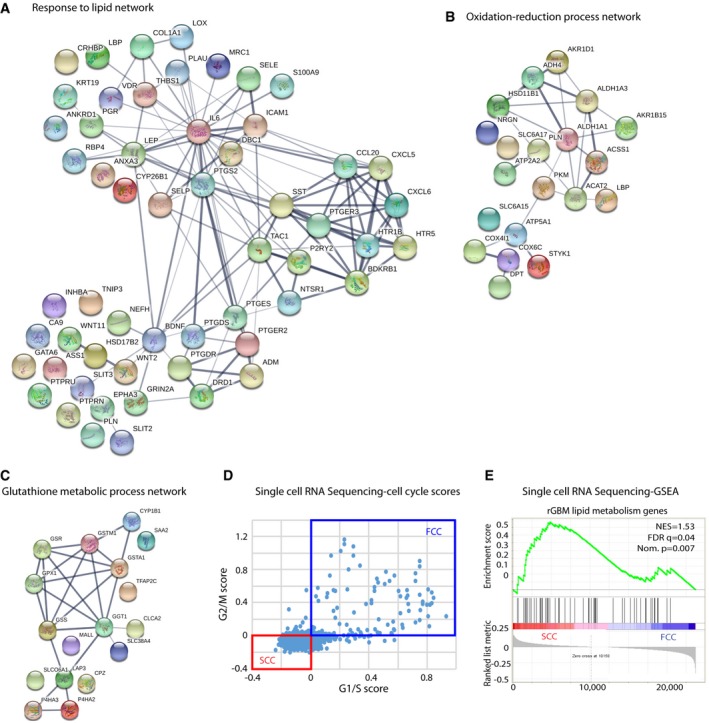
The use of Search Tool in the Retrieval of Interacting Genes/Proteins database (STRING) indicated an overrepresentation of genes associated with lipid metabolism in recurrent GBMs. Red nodes designate the response to lipid genes (n = 56) that are significantly overexpressed in recurrent GBMs within the entire network of genes.
- B, C
Gene networks involved in oxidation–reduction (B) and antioxidant processes (C) are up‐regulated in recurrent tumors.
- D
Cells from single‐cell RNA sequencing data were classified into slow‐ (SCC) and fast‐cycling (FCC) clusters based on the relative expression of cell cycle G1/S (x‐axis) and G2/M (y‐axis)‐associated gene sets.
- E
GSEA of SCC (n = 3 biological replicates, L0‐1‐2) and FCC (n = 3 biological replicates, L0‐1‐2) RNA seq data sets for enrichment of the lipid gene signature identified in TCGA rGBM and our three GBM‐derived SCCs. FDR, false discovery rate; NES, normalized enrichment score; Nom., nominal.
- A
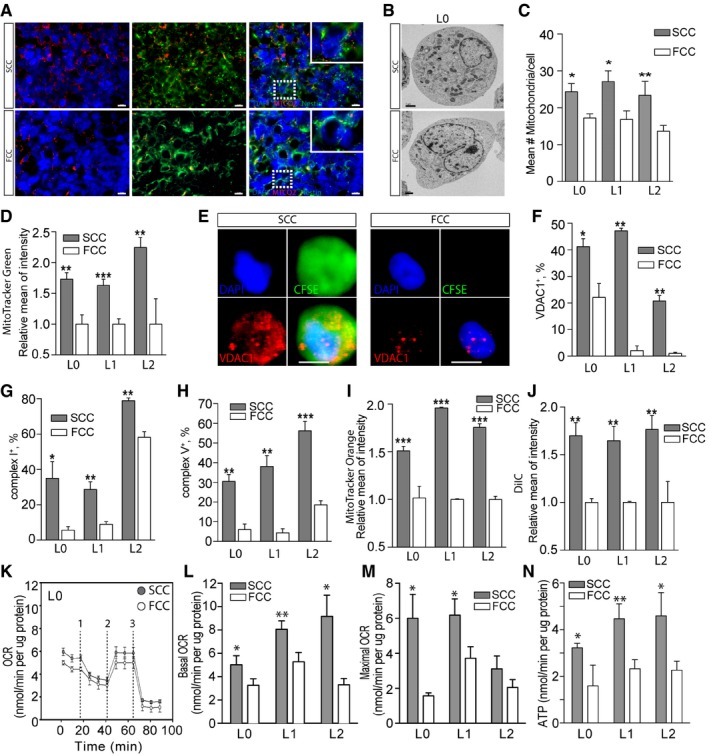
Fluorescence microscopy images of tumor sections, derived from intracranial xenografts of L1 SCCs or FCCs and immunostained with the mitochondrial marker MTCO2, showed a higher number of mitochondria in SCC‐derived tumors. Scale bars, 10 μm.
- B, C
Electron microscopy analysis (B) and quantification (n = 6–11) (C) revealed a higher number of mitochondria per cell in SCCs than in FCCs for L0, L1, and L2. Scale bar, 1 μm.
- D
Quantification of MitoTracker Green staining in SCCs and FCCs derived from hGBM L0 (n = 10), L1 (n = 13), and L2 (n = 6) consistently showed higher mitochondrial content in SCCs.
- E
Fluorescence microscopy images of single cells labeled for VDAC1 (red), DAPI (blue), and CFSE (green). Scale bar, 5 μm.
- F
Flow cytometry quantification of VDAC1 in SCCs and FCCs showed increased VDAC1 levels in SCCs (n = 2 for all lines).
- G, H
Flow cytometry quantification of mitochondrial complex I (n = 3 for all lines) (G) and complex V (L0, n = 3; L1, n = 3; L2, n = 6) (H) revealed an increase in these mitochondrial electron transport chain components in SCCs when compared with FCCs.
- I
Quantification of MitoTracker Orange staining showed significantly higher mitochondrial reactive oxygen species production in SCCs than in FCCs (L0, n = 9; L1, n = 2; L2, n = 6).
- J
SCC and FCC mitochondrial membrane potentials were analyzed with the MitoProbe DilC1 assay (L0, n = 4; L1, n = 2; L2, n = 5). Carbonyl cyanide m‐chlorophenyl hydrazone (CCCP) was added as control mitochondrial membrane uncoupler.
- K
Seahorse experiments were conducted to compare the mitochondrial function between SCC and FCC populations. The oxygen consumption rate (OCR) responses were quantified using the Seahorse XF Cell Mito Stress Test. The dashed lines indicate the timing of oligomycin (1), FCCP (2), and rotenone with antimycin A (3) injections.
- L–N
Basal (n = 9–21) (L) and maximal (n = 8–17) (M) oxygen consumption rates (OCR) as well as ATP production (n = 4–14) (N) were significantly higher in SCCs than in FCCs for L0, L1, and L2.
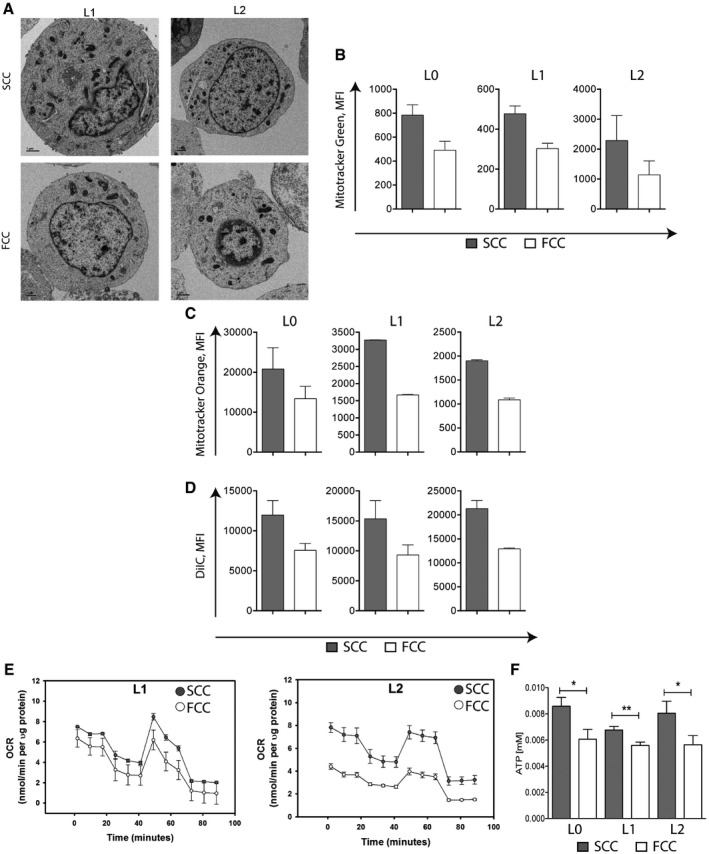
- A
Electron microscopy images of SCCs and FCCs from L1 and L2 patient‐derived GBM cell lines showing greater number of mitochondria in SCCs than FCCs. Scale bar, 1 μm.
- B
Raw values of mean fluorescence intensity (MFI) following MitoTracker Green staining in SCCs and FCCs derived from hGBM L0 (n = 10), L1 (n = 13), and L2 (n = 6). Values are mean ± SEM.
- C
Raw values of mean fluorescence intensity (MFI) following MitoTracker Orange staining in SCCs and FCCs (mean ± SEM, L0, n = 9; L1, n = 2; L2, n = 6).
- D
Raw values of mean fluorescence intensity (MFI) in SCCs and FCCs following the MitoProbe DilC1 assay (mean ± SEM, L0, n = 4; L1, n = 2; L2, n = 5).
- E, F
Oxygen consumption rate (OCR) measured using the XF Cell Mito Stress Assay (E) and ATP production measured using the luciferase‐based ATP‐lite assay (F) in SCCs and FCCs (mean ± SEM, L0, n = 18; L1, n = 15; L2, n = 15, *P < 0.05, **P < 0.01, t‐test).
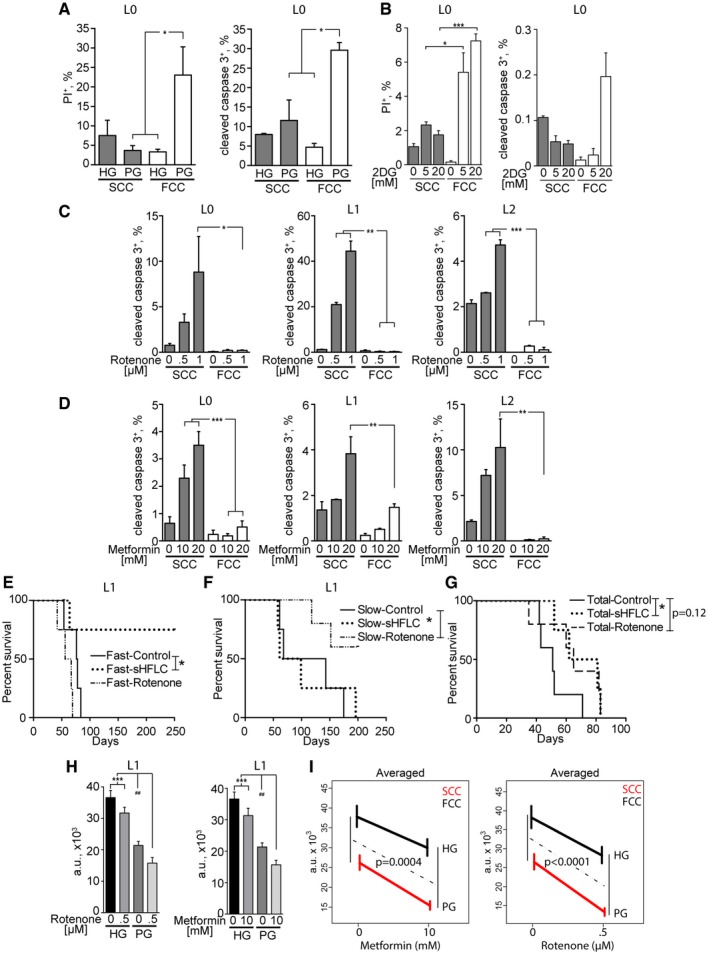
- A
SCCs and FCCs were cultured in high glucose (HG, > 500 mg/dl) or physiological glucose (PG, 90–110 mg/dl) conditions for 24 h. Cell death was quantified by flow cytometry through propidium iodide (PI) incorporation (L0, n = 3–5) and cleaved caspase‐3 expression (L0, n = 2–3). *P < 0.05, 1‐way ANOVA.
- B
SCCs and FCCs were cultured in 0, 5, or 20 mM 2‐deoxyglucose (2DG) for 24 h. Cell death was quantified by flow cytometry through propidium iodide (PI) incorporation (L0, n = 3) and cleaved caspase‐3 expression (L0, n = 3). *P < 0.05, **P < 0.01, 1‐way ANOVA.
- C, D
Quantification of cleaved caspase‐3 and CellTrace signals in cultured hGBM cells after 24 h of treatment with rotenone (L0, n = 4–5; L1–L2, n = 3; L2) (C) or metformin (L0, n = 4; L1, n = 3–4; L2, n = 2) (D). *P < 0.05, **P < 0.001, ***P < 0.0005, one‐way ANOVA with Tukey post‐test.
- E–G
Kaplan–Meier curves showing the survival of animals intracranially implanted with SCCs or FCCs (n = 4–5) and treated with rotenone (0.5 mg/kg) or fed with a glucose‐restricted/supplemented high‐fat, low‐carbohydrate diet (sHFLC; *P ≤ 0.05, log‐rank test).
- H
The combinatorial effects of administering glucose restriction along with mitochondrial targeting with rotenone (n = 16, left) or metformin (n = 16, right) were measured using CyQUANT assays after 24 h of treatment (***P < 0.001, one‐way ANOVA with Tukey post‐test, ## P < 0.01, t‐test).
- I
Mean responses predicted by the generalized linear model (GLM). The effect of lowering glucose on cell viability (HG‐PG vertical differences) depended on the presence/absence of metformin or rotenone. F tests were used to measure the significance of the interactions between glucose and metformin or rotenone effects. Interaction P‐values are indicated.
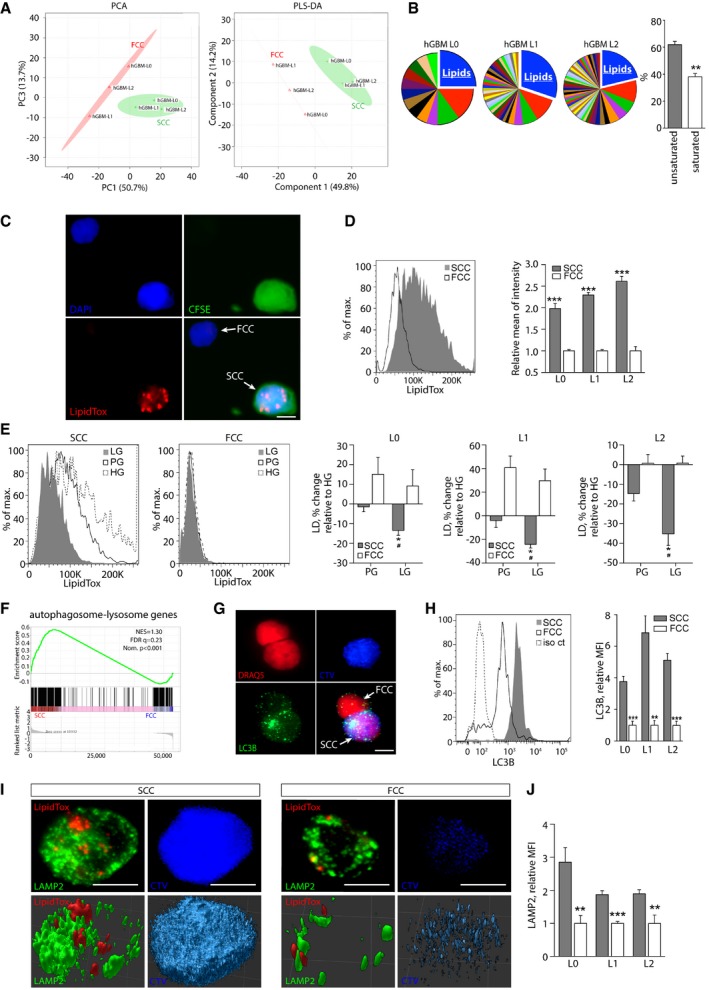
PCA and PLS‐DA score plots derived from UHPLC/HRQMS metabolomics. Green cross: SCCs; red triangle: FCCs.
Pathway analysis performed for each individual hGBM cell line revealed that lipids constitute the most represented metabolic intermediates that are up‐regulated in SCCs compared with FCCs. The majority of lipids up‐regulated in SCCs are unsaturated (mean ± SEM, n = 3, **P < 0.01, t‐test).
Representative fluorescence microscopy images of single cells showing lipid droplets that were detected using LipidTox (red). SCCs were identified with CFSE‐CellTrace (green). Nuclei were stained with DAPI (blue). Scale bar, 5 μm.
Flow cytometry quantification of lipid droplets in hGBM L0, L1, and L2 cell lines (mean ± SEM, n = 3–7, ***P < 0.001, t‐test).
Using flow cytometry, lipid droplet contents were compared between cells cultured for 24 h in high (HG), physiological (PG), or low (LG, 65–80 mg/dl) glucose conditions. Results are represented as average percent change relative to HG (mean ± SEM, n = 3 for all lines; *P < 0.05, t‐test compared to HG; # P < 0.05, t‐test compared to PG).
GSEA of SCC (n = 3 biological replicates, L0‐1‐2) and FCCs (n = 3 biological replicates, L0‐1‐2) RNA seq data sets for enrichment of the autophagosome–lysosome pathway. FDR, false discovery rate; NES, normalized enrichment score; Nom., nominal.
Fluorescence microscopy images of LC3 (autophagosome marker) in CellTrace‐positive (blue) and negative cells. Nuclei were stained with DRAQ5 (red). Scale bar, 5 μm.
Quantification of LC3 by flow cytometry demonstrated greater amounts of autophagosomes in SCCs than in FCCs (mean ± SEM, L0, n = 4; L1, n = 4; L2, n = 7, **P < 0.01, ***P < 0.001, t‐test).
Confocal microscopy images of lipid droplets (LipidTox, red) and lysosomes (LAMP2, green) in a single SCC (CTVhigh, blue) and FCC (CTVlow). Top panels represent maximum z‐stack projections, and bottom panels show 3D reconstructions. Scale bar, 5 μm.
LAMP2 expression was measured and compared between SCCs and FCCs by flow cytometry (mean ± SEM, L0, n = 3; L1, n = 4; L2, n = 4, **P < 0.01, ***P < 0.001, t‐test).
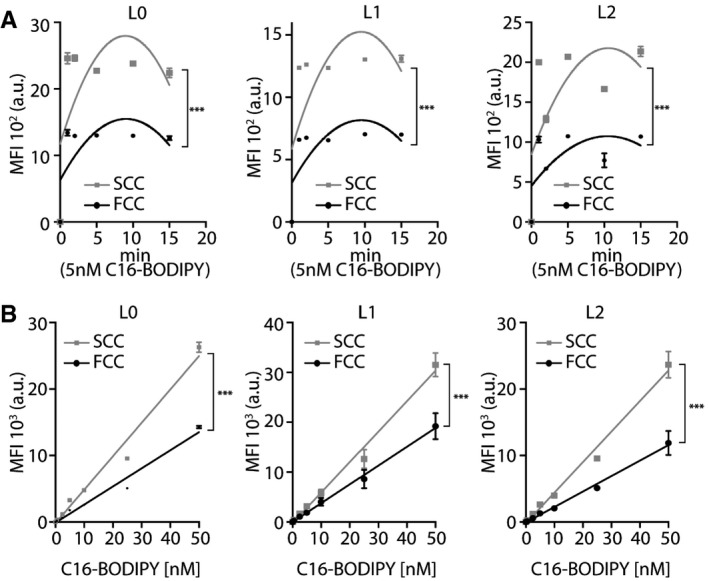
- A, B
C16‐BODIPY uptake was measured using flow cytometry. (A) Time‐course, second‐order polynomial nonlinear regression fit, L0, n = 3; L1, n = 3; L2, n = 2, ***P < 0.0001, two‐way ANOVA, MFI: mean fluorescence intensity. (B) Dose–response, mean ± SEM, L0, n = 3; L1, n = 6; L2, n = 3, ***P < 0.0001, linear regression.
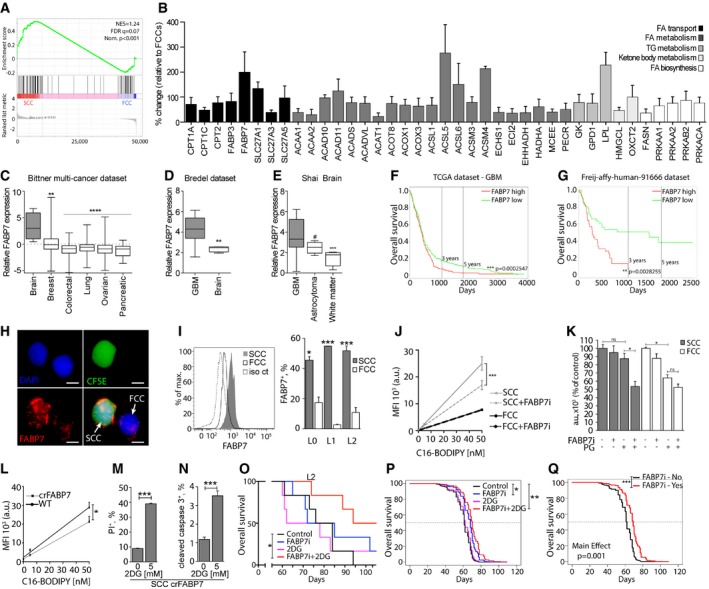
- A
GSEA comparing RNA sequencing results for the fatty acid metabolism gene signature between SCCs and FCCs (n = 3 biological replicates, L0‐1‐2) . FDR, false discovery rate; NES, normalized enrichment score; Nom., nominal.
- B
Results of qRT‐PCR of genes with statistical significant differential expression between SCCs and FCCs using the RT2 Profiler PCR Array for Human Fatty Acid Metabolism. Changes in transcript levels are given as percent change relative to FCCs (mean ± SEM, n = 3–8, P < 0.05, one‐sample t‐test).
- C
FABP7 expression in brain (n = 4), breast (n = 336), colorectal (n = 374), lung (n = 117), ovarian (n = 242), and pancreatic (n = 20) cancer cell lines (**P < 0.005, ****P < 0.0001, one‐way ANOVA). Boxes extend from 25th to 75th percentiles. The line in the boxes represents the median, and the whiskers go down to the smallest value and up to the largest.
- D
Evaluation of the Bredel dataset indicated higher expression of FABP7 in glioblastoma (GBM, n = 27) compared to non‐malignant (n = 4) brain tissue (**P < 0.005, t‐test). Boxes extend from 25th to 75th percentiles. The line in the boxes represents the median, and the whiskers go down to the smallest value and up to the largest.
- E
Data from the Shai database showed greater FABP7 expression in GBM (n = 27) versus astrocytoma (n = 5; ***P < 0.001, one‐way ANOVA, # P < 0.05, t‐test). Boxes extend from 25th to 75th percentiles. The line in the boxes represents the median, and the whiskers go down to the smallest value and up to the largest.
- F, G
Kaplan–Meier curves derived from TCGA (high expression, n = 217; low expression, n = 271) (F) and Freij‐affy‐human‐91666 (high expression, n = 42; low expression, n = 41) (G) datasets indicated that high expression of FABP7 (red) correlated with poorer patient survival compared to the low FABP7‐expressing group (green). **P < 0.01, ***P < 0.001, log‐rank test.
- H
Immunofluorescence microscopy images of a representative single SCC (CFSE‐CellTrace positive, green) and FCC (CellTrace negative) labeled for FABP7 (red). Nuclei were stained with DAPI (blue). Scale bar, 5 μm.
- I
Flow cytometry analysis demonstrated that SCCs overexpress FABP7 compared to FCCs (mean ± SEM, L0, n = 2; L1, n = 2; L2, n = 3, *P < 0.05, ***P < 0.001, t‐test).
- J
C16‐BODIPY uptake was measured in L1 GBM line SCCs or FCCs cultured with or without 200 nM FABP7 inhibitor (FABP7i; mean ± SEM, each condition, n = 3, ***P < 0.0001, linear regression).
- K
L1 SCCs and FCCs were separated by FACS and cultured in high glucose or physiological glucose (PG) conditions, with or without 200 nM FABP7 inhibitor. Cell proliferation was assessed using CyQUANT assays 5 days after treatment (mean ± SEM, n = 2–3, *P < 0.05, one‐way ANOVA with Tukey post‐test).
- L
C16‐BODIPY uptake was measured in the L1 wild‐type (WT) and CRISPR‐FABP7 (crFABP7) cell line (mean ± SEM, each condition, n = 3, *P < 0.05, linear regression).
- M, N
Cell death of the crFABP7 cell line in the absence or presence of 5 mM 2‐deoxyglucose (2DG) was quantified by flow cytometry 24 h after treatment through propidium iodide (PI) incorporation (n = 3) (M) and cleaved caspase 3 expression (n = 3) (N). Values are mean ± SEM. ***P < 0.001, t‐test.
- O
Kaplan–Meier curves showing the survival of animals intracranially implanted with L2 GBM cells and treated with 15 mg/kg i.p. of the FABP7 inhibitor (FABP7i) once a week for 3 weeks, 500 mg/kg of 2‐deoxyglucose (2‐DG) twice a week for 4 weeks, or a combination of both (n = 5 per group, *P ≤ 0.05, log‐rank test).
- P
Predicted survival curves using the Cox frailty model fit and grouping the results for the L0, L1, and L2 xenografts subjected to the different experimental conditions (*P ≤ 0.05, **P ≤ 0.01, log‐rank test).
- Q
Predicted survival curves using the Cox frailty model fit and grouping the results for the L0, L1, and L2 xenografts with or without treatment with the FABP7 inhibitor (***P ≤ 0.001, log‐rank test).
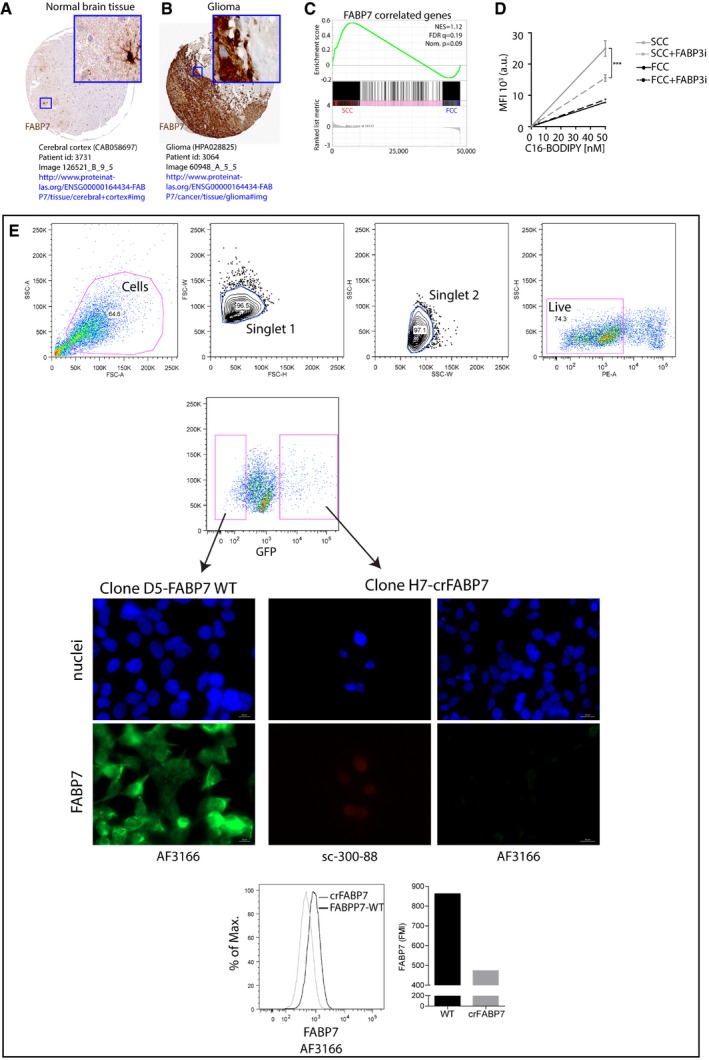
- A, B
FABP7 protein expression in normal brain tissue (A) and glioma (B). Image credit: Human Protein Atlas v16.1,
http://www.proteinatlas.org . - C
GSEA of SCC (n = 3 biological replicates, L0‐1‐2) and FCC (n = 3 biological replicates, L0‐1‐2) RNA seq data sets for enrichment of FABP7‐correlated genes. FDR, false discovery rate; NES, normalized enrichment score; Nom., nominal.
- D
C16‐BODIPY uptake in control conditions or with 250 nM of FABP3 inhibitor (BMS309403; mean ± SEM, n = 3, ***P < 0.0001, linear regression).
- E
FACS of least and most intense GFP‐positive single cells and representative immunofluorescence microscopy images of FABP7 immunoreactivity in wild‐type (clone D5 WT) and crFABP7 (clone H7) clones following CRISPR/Cas9 plasmid transfection for FABP7. FABP7 fluorescence mean intensity (FMI) was higher in wild‐type than crFABP7 clones as measured by flow cytometry. FABP7 expression was assessed using two different antibodies (clone AF3166 and clone sc‐300‐88). Nuclei were labeled with DAPI.
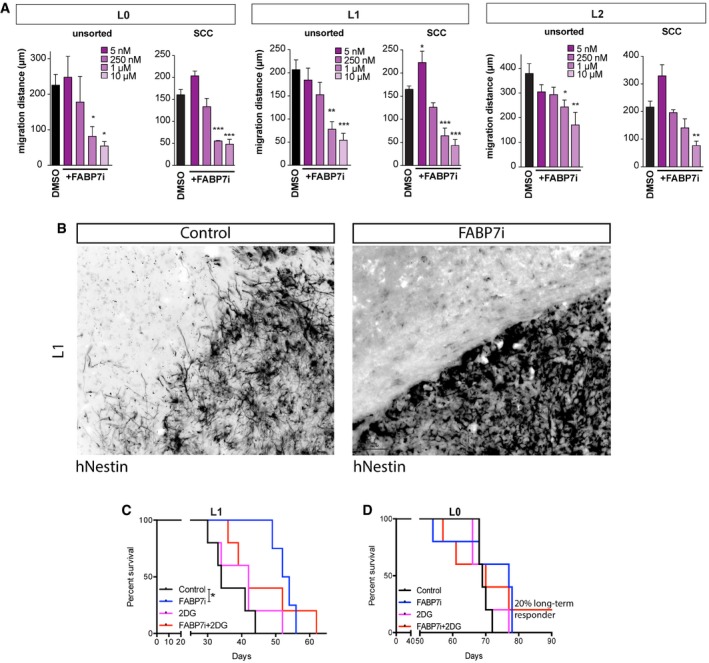
- A
Total and SCC populations were treated with FABP7i concentrations ranging from 5 nM to 10 μM. In L0 and L1, 1 and 10 μM concentrations of FABP7i significantly reduced the migration distances of overall unsorted and SCC populations, whereas only 10 μM FABP7i was significant for L2 SCC (n = 3, mean ± SEM, *P < 0.05, **P < 0.001, ***P < 0.0005, one‐way ANOVA with Tukey post‐test).
- B
In vivo inhibition of FABP7 also resulted in decreased tumor cell invasion. Scale bar, 50 μm.
- C, D
The effects of FABP7 inhibition, alone or in combination with pharmacological targeting of glycolysis with 2‐DG, were conducted on tumors derived from the xenotransplants of L1 (n = 4–5) (C) and L0 (n = 5–6) (D) GBM patient‐derived cells lines. *P < 0.05, log‐rank test.
References
-
- Aigner K, Dampier B, Descovich L, Mikula M, Sultan A, Schreiber M, Mikulits W, Brabletz T, Strand D, Obrist P, Sommergruber W, Schweifer N, Wernitznig A, Beug H, Foisner R, Eger A (2007) The transcription factor ZEB1 (deltaEF1) promotes tumour cell dedifferentiation by repressing master regulators of epithelial polarity. Oncogene 26: 6979–6988 - PMC - PubMed
-
- Bensaad K, Favaro E, Lewis CA, Peck B, Lord S, Collins JM, Pinnick KE, Wigfield S, Buffa FM, Li JL, Zhang Q, Wakelam MJ, Karpe F, Schulze A, Harris AL (2014) Fatty acid uptake and lipid storage induced by HIF‐1alpha contribute to cell growth and survival after hypoxia‐reoxygenation. Cell Rep 9: 349–365 - PubMed
-
- Blachly‐Dyson E, Forte M (2001) VDAC channels. IUBMB Life 52: 113–118 - PubMed
Publication types
MeSH terms
Substances
Grants and funding
LinkOut - more resources
Full Text Sources
Other Literature Sources
